SOL Trade Blueprint: Waiting for the High-Conviction EntryAfter printing a SFP at the key high of $180.52 followed by a sharp -8% rejection, SOL made a second attempt to breach the major resistance zone between $180–$185 — but once again, bulls fell short. Since then, price has been in a corrective phase. So the big question is: where’s the next high-probability trade setup? Let’s zoom out and break it down.
📏 Zooming Out: Structure, FVG & Fib Confluence
Back on May 8th, SOL broke through the April 25th swing high at $157 with strong momentum, leaving behind an untested Fair Value Gap (FVG) — a key displacement area that’s yet to be filled. When we draw the Fibonacci retracement from the low of that move to the current high, the 0.618 retracement lands precisely at $157.34 — right on the old breakout high. That’s a beautiful confluence.
Timing-wise, if SOL pulls back to that level between May 21–22, the 0.75 Fib speed fan also kicks in — adding dynamic trendline support to the static Fib level.
📉 What About the $164 Golden Pocket?
There's a golden pocket forming around $164 from a recent mini-impulse, and while it may look tempting, context matters. This pocket isn't supported by enough confluence — no major structure, volume shelf, or EMA alignment. For a quick scalp? Yes. But for a high-conviction swing? It's not ideal.
Remember, in trading we're not here to chase every candle — we're here to wait for the setups that stack the most reasons to say yes.
📍 The Zone to Watch: $157
Now let’s talk about that $157 zone — and why it’s standing out as the highest-probability long setup:
0.618 Fib retracement of the major impulse
Retest of the breakout swing high
Untested Fair Value Gap (FVG)
233 EMA + 233 SMA on the 4H timeframe lining up as dynamic support
1.5 outer pitchfork support line crossing through
1:1 trend-based Fib extension confluence
Prior area of interest
This is what we call a “stacked setup.” The more layers of confluence, the more conviction we have in the trade. Add to that the potential for a liquidity sweep (SFP) just below the current low at $159.44 — and it becomes a zone worth watching closely.
🎯 Long Setup:
Entry: $157–$159.44 (watch for SFP confirmation)
Stop-Loss: Below $154
Target: $200
R:R: Approx. 1:12 — a setup worth being patient for
🧠 Educational Note: Why Confluence Is King
High-probability trades don’t come from guessing. They come from stacking confluence: structure, Fibonacci, moving averages, time-based levels, pitchforks, VWAPs, volume profiles — the more that lines up, the less you need to hope and the more you can trust your edge. Think like a sniper, not a machine gun.
The market rewards patience and precision — not noise and FOMO.
🔻 Short Setup (Alternative Play)
While we’re primarily bullish, there’s a valid short opportunity at the psychological $200 mark — but only if price shows clear rejection and confirmation (e.g. SFP, bearish engulfing, high volume reversal).
Entry: $200 rejection
Stop-Loss: Above $205
Target: $185–$180
R:R: Approx. 1:3+
🔥 Final Words: Trade With Purpose
This is what trading is about — not chasing green candles, but waiting for structure, clarity, and alignment. Whether you’re trading long or short, focus on high-conviction setups backed by logic and levels, not emotion.
Don’t trade for action. Trade for precision. The market will always reward the patient ones who are willing to wait for that clean entry, stacked with reasons to act.
Trust the process, stay disciplined, and let the charts do the talking. 💪📈
___________________________________
If you found this helpful, leave a like and comment below! Got requests for the next technical analysis? Let me know.
Swingtrading

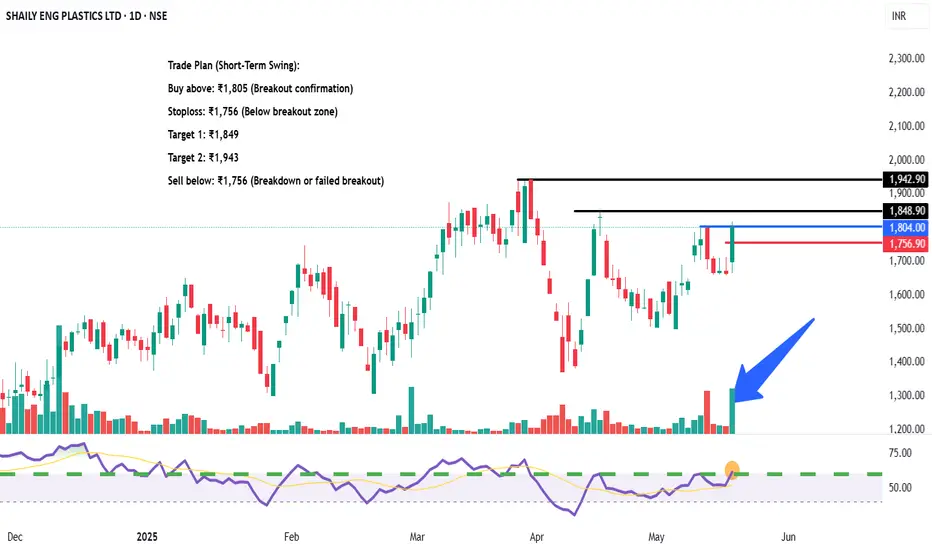
SHAILY ENG PLASTICS LTD – Breakout Watch | High Volume Spike📌 Trade Plan (Short-Term Swing):
Buy above: ₹1,805 (Breakout confirmation)
Stoploss: ₹1,756 (Below breakout zone)
Target 1: ₹1,849
Target 2: ₹1,943
Sell below: ₹1,756 (Breakdown or failed breakout)
🔍 Technical View:
Volume spike with bullish close – institutional interest likely
Breakout zone near ₹1,804 now acting as immediate support
RSI breakout supports momentum entry
Resistance: ₹1,849 and ₹1,943
ONT ANALYSIS 📊 #ONT Analysis
✅There is a formation of Falling Wedge Pattern on daily chart with a good breakout and retest and currently trading around its support zone🧐
Pattern signals potential bullish movement incoming after the confirmation of retest
👀Current Price: $0.1483
🚀 Target Price: $0.1940
⚡️What to do ?
👀Keep an eye on #ONT price action and volume. We can trade according to the chart and make some profits⚡️⚡️
#ONT #Cryptocurrency #TechnicalAnalysis #DYOR

Xrp - Prepare for at least a +50% move!Xrp - CRYPTO:XRPUSD - will head much higher:
(click chart above to see the in depth analysis👆🏻)
Xrp has perfectly been respecting market structure lately and despite the significant volatility, the overall crypto market remains bullish. Especially Xrp is about to perform a bullish break and retest, which - if confirmed by bullish confirmation - could lead to a rally of about +50%.
Levels to watch: $3.0
Keep your long term vision!
Philip (BasicTrading)

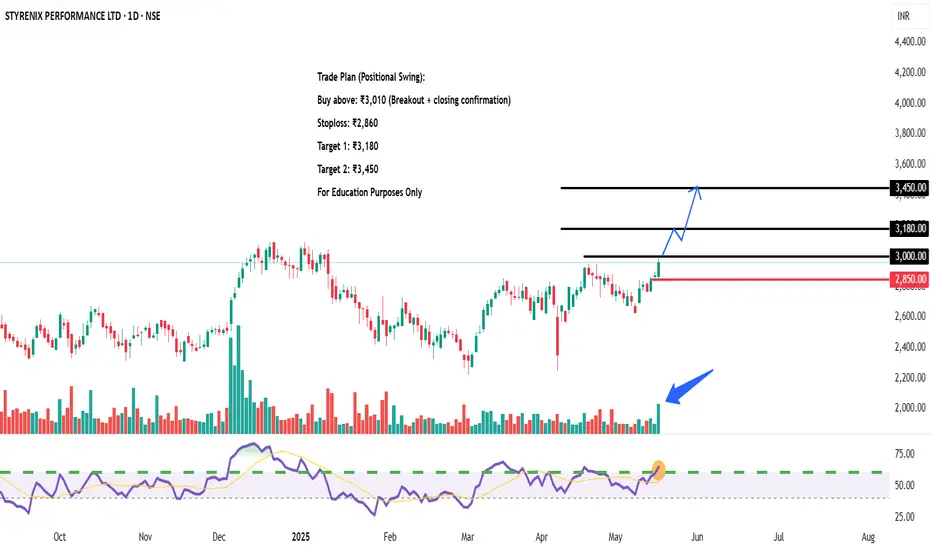
STYRENIX PERFORMANCE LTD – Near Resistance 🔍 Technical View:
Multiple BOS/CHoCH indicate structure shift
Strong low formed at ₹2,100 zone
Demand zones tested & respected between ₹2,400–₹2,600
RSI near breakout level (~70), indicating building momentum
📌 Trade Plan (Positional Swing):
Buy above: ₹3,010 (Breakout + closing confirmation)
Stoploss: ₹2,860
Target 1: ₹3,180
Target 2: ₹3,450
Sell below: ₹2,850 (If resistance holds or breakdown happens)
ETH ANALYSIS📊 #ETH Analysis
✅There is a formation of Falling Wedge Pattern on daily chart and currently trading around its major support zone🧐
Pattern signals potential bullish movement incoming after sustain above the major support zone
👀Current Price: $2380
🚀 Target Price: $2785
⚡️What to do ?
👀Keep an eye on #ETH price action and volume. We can trade according to the chart and make some profits⚡️⚡️
#ETH #Cryptocurrency #TechnicalAnalysis #DYOR

CENTRAL DEPO SER (I) LTD – Supply Zone Test Price has entered a major supply zone (₹1,390–₹1,440). Strong BOS (Break of Structure) confirms bullish momentum. RSI supports strength; breakout looks likely on volume surge.📌 Trade Plan (Swing/Positional):
Buy above: ₹1,445 (on breakout + closing basis)
Stoploss: ₹1,365
Target 1: ₹1,580
Target 2: ₹1,720
Sell Below (Rejection): ₹1,360 (if price gets rejected at supply)
🔍 Technical Highlights:
BOS and CHoCH indicate structure shift from bearish to bullish
Currently testing supply zone after BOS
Volume increasing with bullish candles
RSI approaching overbought — breakout likely, but confirmation needed
For Education Purposes Only

Nasdaq – Fair Value Gap (FVG) in Play: Breakout or Rejection?US100 is going up and reaching a critical inflection point, the Daily Fair Value Gap (FVG) between 21,500 and 21,700.
This FVG is not just any level; it’s the last inefficiency left by aggressive sellers, and the market is now deciding whether to reclaim or reject it.
Key Zones
- Daily FVG (Supply): 21,400 – 21,600
- Major Resistance: 22,400
Trade Scenarios
Bullish Continuation
A clean daily close above 21,600 confirms FVG reclamation.
Could trigger a momentum burst toward 22,250.
Ideal play: wait for consolidation above 21,700 or breakout-retest setup.
Bearish Rejection
Rejection from the FVG could lead to a retracement toward 20,300, where demand and a lower imbalance reside.
Look for rejection in the FVG zone.
Technical Takeaways
The FVG at 21,400–21,600 is acting as both a magnet and a battlefield expect volatility.
The impulsive move leading here lacks a clear retest, which may increase the probability of a short-term correction.
Momentum is strong, but traders should wait for confirmation not emotion.
Summary
The Nasdaq 100 is knocking on a daily FVG door and what happens next will set the tone for the coming weeks.
Above 21,600 = bull trend continuation
Rejection = short-term dip to 20,300 possible
What's your take, breakout or rejection?
Follow for real-time trade updates and educational charts.

Possible Swing Trade in Realty Sector Index1. MACD Signal turned green
2. RSI crossing above 50
3. Index returning after forming a base at 50.0% retracement
4. Good weekly close
5. Risk - Reward is more than 2

Possible Swing Trade in IRCTC1. Good volumes
2. MACD Signal turned green
3. RSI crossing above 50
4. Stock returning after forming a base at 78.6% retracement
5. Good weekly close
6. Risk - Reward is more than 2

USDCHF bullish There's a clear descending triangle with price testing the upper resistance. A breakout is anticipated.
You can enter from FVG (Stop loss 0.83230)or wait a breakout above the triangle, then retest.
We have two targets:
-The distance from the highest point to the support line which will be at 0.8522
-Second target will be swing deal take it on weekly IFVG which will be at 0.87132

Weekly Market Wrap: Nifty Surges Past 25,000 – What's Next? The Nifty 50 index closed the week at 25,019, posting an impressive 1,000-point rally from the previous week’s close. The index made a high of 25,116 and a low of 24,378. The rally was driven by short covering and a surprise truce between India and Pakistan, which injected a wave of optimism into the market.
More importantly, Nifty broke out of the consolidation range of 23,200–24,600, closing strong above the psychologically significant 25,000 mark – a clear sign of bullish sentiment.
What to Expect Next Week (Outlook May 20–24)
Expected Range: 24,450 – 25,600
A breakout above 25,600 could open the doors for a retest of the all-time high (ATH) at 26,277.
As long as Nifty trades above 23,800, the broader trend remains intact.
Monthly Chart Patterns to Watch
A bullish "W" pattern could be forming, which ideally would require a pullback from current levels before resuming upward.
On the flip side, a bearish "M" pattern may emerge if the index tests ATH and faces rejection, which could trigger a sharp correction of 2,500–2,600 points.
For now, I remain cautious until the monthly time frame confirms a clear bullish breakout.
Global Markets Check: S&P 500 Eyes Key Resistance
The S&P 500 closed at 5,958, gaining 300 points week-on-week. As anticipated, a breakout above 5,770 propelled the index to meet all short-term targets of 5,821 / 5,850 / 5,900.
Key Level to Watch: 6,013
This is a major Fibonacci resistance — the same level where the market started correcting back on March 3, 2025.
A weekly close above 6,013 would be bullish, potentially triggering rallies toward 6,091 / 6,142 / 6,225.
However, a breakdown below this week’s low of 5,786 would confirm a failed breakout, with downside targets at 5,637 / 5,551 / 5,458.
Momentum traders, get ready – sharp moves are coming either way!

Netflix - The bulls just never stop!Netflix - NASDAQ:NFLX - is insanely bullish now:
(click chart above to see the in depth analysis👆🏻)
The entire stock market basically collapsed during April. Meanwhile, Netflix is creating new all time highs with a +20% parabolic bullish candle. Looking at the chart, this strength is very likely to continue even more until Netflix will (again) retest the upper resistance trendline.
Levels to watch: $1.400
Keep your long term vision!
Philip (BasicTrading)

NFLX Great Long Term but Risky Shorter Term NASDAQ:NFLX
Looks riskier shorter term due to confluence resistance, but not impossible to see larger breakout here.
Longer term (2027-2028) $5,000 price target.

TBO TEK LTD – 19 May Trendline Resistance Test Incoming 📌 Trade Plan (Aggressive Swing Setup):
Buy above: ₹1,250 (on breakout + volume confirmation)
Stoploss: ₹1,195
Target 1: ₹1,310
Target 2: ₹1,385
Sell Below: ₹1,180 (if price rejects the trendline with high volume)
🔎 Technical Insights:
Strong volume buildup near resistance
RSI trending upwards with bullish momentum
Trendline acting as dynamic resistance since Nov 2024
For Education Purposes Only

GBP/USD 4H Analysis – Bearish Bias in PlayThe market never lies, it simply reflects behaviour. And right now, the behaviour around GBP/USD suggests one thing: bearish momentum.
As seen in this clean 4H chart, price failed to hold above the key horizontal resistance zone and now showing signs of weakness after a retest. I’ve marked a potential bearish projection (red arrow) based on:
Key Technical Factors:
Rejection from a prior structure zone
Clean lower highs forming
Breakdown and retest of minor support
Room below toward - near 1.30300 (next yellow line)
This setup aligns with a potential swing move down toward the next area. If price follows through, we could see a solid continuation to the downside in the coming sessions.
Patience and discipline over prediction. Let price confirm the story it’s telling.

EURCAD: Another Bearish Pattern 🇪🇺🇨🇦
Earlier, we spotted a head & shoulder pattern on EURCAD on a daily
and a confirmed breakout of its neckline.
Analysing a price action, I spotted another bearish formation today.
The price formed a bearish flag pattern, and it is retesting a broken
trend line at the moment.
I think that the pair may drop lower soon.
Next support - 1.5503
❤️Please, support my work with like, thank you!❤️
I am part of Trade Nation's Influencer program and receive a monthly fee for using their TradingView charts in my analysis.

PEL | Breakout Setup | Short-Term Buy | Target ₹1100🟩 Trade Plan:
Buy Zone: ₹1059 – ₹1060
Target: ₹1100 (approx. 3.77% upside)
Stop Loss: ₹1037
Risk-Reward Ratio: ~2:1
Setup Type: Breakout above resistance zone (marked on chart)
Volume Confirmation: Strong bullish candle with high volume
RSI Confirmation: RSI bouncing above 60, momentum building
📈 Chart Annotations (TradingView Tips):
Draw resistance zone on 1H around ₹1060 – ₹1070 (breakout zone)
Plot EMA (9 & 21) or EMA crossover to confirm short-term bullish trend
Use RSI (14) to highlight momentum breakout
Highlight entry point, stoploss, and target with labels
Use TradingView’s “Long Position Tool” to visually display RR
For Education Purposes only

OIL – Oil India Ltd | Target: ₹429.00🟢 Trade Details:
LTP: ₹417.30
Recommended Buy Range: ₹415.50 – ₹416.00
🎯 Target: ₹429.00
🛑 Stop Loss: ₹408.70
🔍 Technical Snapshot:
✅ Strong bullish candle with volume confirmation
✅ EMA crossover supports the uptrend (9 EMA > 13 EMA)
✅ RSI at 62.22 shows healthy momentum
✅ Breakout above previous range box visible on Daily & 1H TF
📊 BB %B at 0.82 – still room before overbought levels
💼 Strategy:
Suitable for short-term MTF holding (2–5 days)
Risk-Reward ~1:1.5
Trail SL to cost once ₹424+ is breached
Use smaller timeframes (15m / 1H) to confirm entry with volume
For Education Purposes Only

GBPUSD SWING: +1000 Pips Later, GU Is Still Climbing in Stealth 🧠 Last Idea Recap from Early Feb 2025:
- We previously caught a multi-leg upside off the bottom channel (~1.2550) with over 350 pips in structured recovery.
- Price is now grinding within upper consolidation, testing the 1.3315–1.3350 supply shelf.
Note: Check out the previous Idea from related publications to verify.
Update: GBPUSD has now delivered over 1000+ pips in swing structure from the bottom breakout (1.2550s), with even more gains harvested through intra-day and scalp setups inside this multi-week ascending channel.
Recent UK macro strength (GDP beat across MoM, QoQ, YoY) injected new life into price action, adding fundamental confluence to the clean bullish technicals already building. Price continues to respect the rising structure with higher lows and controlled consolidation near a breakout shelf at 1.3350–1.3375.
🔍 Current Structure :
- Bullish flag forming near key supply zone
- No sign of distribution or exhaustion
- Channel still intact, buyers defending every dip
Next Leg:
- Break and hold above 1.3375 could fuel another 100–150 pip run toward 1.3470 and eventually 1.3550+
- Short-term traders: watch for a stop-hunt sweep before the real move
Entry Notes:
- Use lower timeframes (4H/1H) for confirmation wicks, volume spikes, or engulfing candles
- Avoid getting trapped on the first breakout candle—look for retest/reclaim plays
Whether you’re swinging or scalping, this pair has remained one of the cleanest GBP structures in months, and this ride might not be over yet.

ENDURANCE – Breakout from Supply Zone | Target ₹2136 ⚙️ ENDURANCE TECH LTD (NSE:ENDURANCE)
Time Frame: 15min / 1 Hour
📊 Trade Type: Positional / Intraday Momentum
📌 Buy Zone: ₹2042 (Above supply zone breakout)
🎯 Target 1: ₹2136
🎯 Target 2: ₹2287
🛑 Stop Loss: ₹1915
📈 CMP: ₹2022.60
📌 Chart Insights:
✅ Strong volume breakout from horizontal resistance
✅ Cleared EMA 9/13/26 crossover
✅ RSI > 60 indicates bullish momentum
✅ Bollinger Band breakout (BB %B > 1.00)
✅ Breaking above pivot R2 zone (₹2042) opens room to R3
⚠️ Strategy:
Enter on confirmation above ₹2042 with volume support on 15min or 1H timeframe.
Stop loss below breakout candle or EMA cluster around ₹1915.
Trailing stop as it approaches targets.
For Education Purposes Only

S&P500 - The bottom we have been waiting for!The S&P500 - TVC:SPX - officially created the bottom:
(click chart above to see the in depth analysis👆🏻)
This month we officially saw one of the craziest stock market fakeouts of the past decade. With a drop and reversal rally of about +15%, the S&P500 is about to even close with a green monthly candle, which then indicates that the stock market bottom was created.
Levels to watch: $120, $250
Keep your long term vision!
Philip (BasicTrading)

HIMS – Pullback Opportunity After Massive RunHIMS has been one of the hottest stocks in the market recently, with a massive run fueled by strong earnings. But now we’re seeing the first meaningful pullback — and this could be a golden opportunity:
🔹 Earnings Gap Reversal (Bullish Signal)
Despite an earnings gap down, buyers stepped in aggressively, pushing the stock higher.
This is a classic earnings gap down reversal — a strong sign of demand.
🔹 First Pullback Opportunity
Historically, the first pullback after a major run tends to get bought.
I’m watching two key levels for a potential buy:
The shaded zone between the 9 EMA and 20 EMA (dynamic support).
The 0.38 - 0.50 Fibonacci retracement for added confirmation.
🔹 My Trading Plan:
1️⃣ Initial Entry: Starter position in the shaded EMA zone (9 EMA - 20 EMA).
2️⃣ Confirmation Add: If price bounces off the Fib zone (0.38 - 0.50) with strength.
3️⃣ Stop Loss: Below the 20 EMA for any initial position — keeping risk tight.
🔹 Why This Setup is Compelling:
Strong run + earnings reversal shows real buyer interest.
First pullback after a big run is typically a strong buying opportunity.
The dual confluence of EMAs + Fibonacci enhances this setup.
⚠️ Risk Management: Tight stop below 20 EMA — always control risk.
