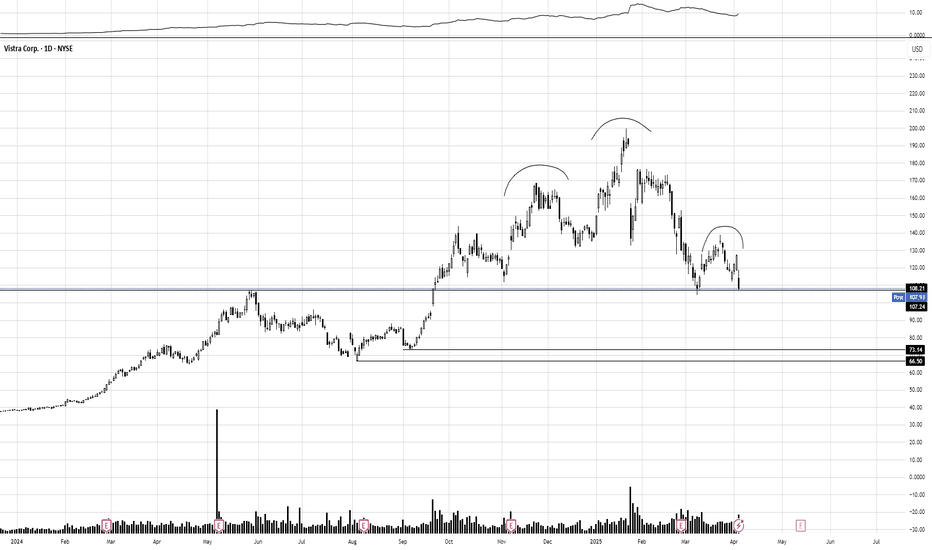
OptionsMastery: Looking at a H&S on VST! 🔉Sound on!🔉
📣Make sure to watch fullscreen!📣
Thank you as always for watching my videos. I hope that you learned something very educational! Please feel free to like, share, and comment on this post. Remember only risk what you are willing to lose. Trading is very risky but it can change your life!
Swingtrading
Apple - All This Was Expected!Apple ( NASDAQ:AAPL ) perfectly plays out:
Click chart above to see the detailed analysis👆🏻
Just a couple of months ago, Apple perfectly retested the rising channel resistance trendline and has been creating the expected bearish rejection. This could perfectly form the next all time high break and retest, which would eventually lead to another significant move higher.
Levels to watch: $190
Keep your long term vision,
Philip (BasicTrading)
OptionsMastery: H&S on JPM! Sound on!🔉
📣Make sure to watch fullscreen!📣
Thank you as always for watching my videos. I hope that you learned something very educational! Please feel free to like, share, and comment on this post. Remember only risk what you are willing to lose. Trading is very risky but it can change your life!
Dogecoin - You Should Not Be Afraid!Dogecoin ( CRYPTO:DOGEUSD ) could reverse right now:
Click chart above to see the detailed analysis👆🏻
Four months ago Dogecoin perfectly retested the previous all time high and is now creating the anticipated bearish rejection. However during every bullish cycle we saw a correction of at least -60%, which was followed by a parabolic rally, so there is no reason to be worried at all.
Levels to watch: $0.2, $0.5
Keep your long term vision!
Philip (BasicTrading)
OptionsMastery: 2 scenarios on CSCO. 🔉Sound on!🔉
📣Make sure to watch fullscreen!📣
Thank you as always for watching my videos. I hope that you learned something very educational! Please feel free to like, share, and comment on this post. Remember only risk what you are willing to lose. Trading is very risky but it can change your life!
OptionsMastery: Looking for an immediate buy on RIOT!🔉Sound on!🔉
📣Make sure to watch fullscreen!📣
Thank you as always for watching my videos. I hope that you learned something very educational! Please feel free to like, share, and comment on this post. Remember only risk what you are willing to lose. Trading is very risky but it can change your life!
RENDER ANALYSIS📊 #RENDER Analysis
✅There is a formation of Falling Wedge Pattern on daily chart with a good breakout and currently retests from the major resistance zone🧐
Pattern signals potential bullish movement incoming after a breakout of major resistance zone
👀Current Price: $3.455
🚀 Target Price: $4.4-6.0
⚡️What to do ?
👀Keep an eye on #RENDER price action and volume. We can trade according to the chart and make some profits⚡️⚡️
#RENDER #Cryptocurrency #TechnicalAnalysis #DYOR
JPMorgan at a Crossroads Bullish Surge or Bearish Retreat ? Hello, fellow traders!
Today, I’m diving into a detailed technical analysis of JPMorgan Chase & Co. (JPM) on the 2-hour chart, as shown in the screenshot. My goal is to break down the key elements of this chart in a professional yet accessible way, so whether you’re a seasoned trader or just starting out, you can follow along and understand the potential opportunities and risks in this setup. Let’s get started!
Price Action Overview
At the time of this analysis, JPM is trading at 243.62, down -1.64 (-0.67%) on the 2-hour timeframe. The chart spans from late March to early May, giving us a good look at the recent price behavior. The price has been in a strong uptrend, as evidenced by the higher highs and higher lows, but we’re now seeing signs of a potential pullback or consolidation.
The chart shows a breakout above a key resistance zone around the 234.50 level (highlighted in red on the Volume Profile), followed by a retest of this level as support. This is a classic bullish pattern: a breakout, a retest, and then a continuation higher. However, the recent price action suggests some hesitation, with a small bearish candle forming at the current price of 243.62. Let’s dig deeper into the tools and indicators to understand what’s happening.
Volume Profile Analysis
The Volume Profile on the right side of the chart is a powerful tool for identifying key price levels where significant trading activity has occurred. Here’s what it’s telling us:
Value Area High (VAH): 266.25
Point of Control (POC): 243.01
Value Area Low (VAL): 236.57
Profile Low: 224.25
The Point of Control (POC) at 243.01 is the price level with the highest traded volume in this range, acting as a magnet for price. Since the current price (243.62) is just above the POC, this level is likely providing some support. However, the fact that we’re so close to the POC suggests that the market is at a decision point—either we’ll see a bounce from this high-volume node, or a break below could lead to a deeper pullback toward the Value Area Low (VAL) at 236.57.
The Total Volume in VP Range is 62.798M shares, with an Average Volume per Bar of 174.44K. This indicates decent liquidity, but the Volume MA (21) at 165.709K is slightly below the average, suggesting that the recent price action hasn’t been accompanied by a significant spike in volume. This could mean that the current move lacks strong conviction, and we might see a consolidation phase before the next big move.
Trendlines and Key Levels
I’ve drawn two trendlines on the chart to highlight the structure of the price action:
Ascending Triangle Pattern: The chart shows an ascending triangle formation, with a flat resistance line around the 234.50 level (which was later broken) and an upward-sloping support trendline connecting the higher lows. Ascending triangles are typically bullish patterns, and the breakout above 234.50 confirmed this bias. After the breakout, the price retested the 234.50 level as support and continued higher, reaching a high of around 248.02.
Current Support Trendline: The upward-sloping trendline (drawn in white) is still intact, with the most recent low around 241.50 finding support on this line. This trendline is critical—if the price breaks below it, we could see a deeper correction toward the VAL at 236.57 or even the 234.50 support zone.
Key Price Levels to Watch
Based on the Volume Profile and price action, here are the key levels I’m watching:
Immediate Support: 243.01 (POC) and 241.50 (recent low on the trendline). A break below 241.50 could signal a short-term bearish move.
Next Support: 236.57 (VAL) and 234.50 (previous resistance turned support).
Resistance: 248.02 (recent high). A break above this level could target the Value Area High at 266.25, though that’s a longer-term target.
Deeper Support: If the price breaks below 234.50, the next significant level is 224.25 (Profile Low), which would indicate a major trend reversal.
Market Context and Timeframe
The chart covers 360 bars of data, starting from late March. This gives us a good sample size to analyze the trend. The 2-hour timeframe is ideal for swing traders or those looking to capture moves over a few days to a week. The broader trend remains bullish, but the recent price action suggests we might be entering a consolidation or pullback phase before the next leg higher.
Trading Strategy and Scenarios
Based on this analysis, here are the potential scenarios and how I’d approach trading JPM:
Bullish Scenario: If the price holds above the POC at 243.01 and the trendline support at 241.50, I’d look for a bounce toward the recent high of 248.02. A break above 248.02 could signal a continuation toward 266.25 (VAH). Entry could be on a strong bullish candle closing above 243.62, with a stop-loss below 241.50 to manage risk.
Bearish Scenario: If the price breaks below 241.50 and the POC at 243.01, I’d expect a pullback toward the VAL at 236.57 or the 234.50 support zone. A short position could be considered on a confirmed break below 241.50, with a stop-loss above 243.62 and a target at 236.57.
Consolidation Scenario: Given the lack of strong volume and the proximity to the POC, we might see the price consolidate between 241.50 and 248.02 for a while. In this case, I’d wait for a breakout or breakdown with strong volume to confirm the next move.
Risk Management
As always, risk management is key. The 2-hour timeframe can be volatile, so I recommend using a risk-reward ratio of at least 1:2. For example, if you’re going long at 243.62 with a stop-loss at 241.50 (a risk of 2.12 points), your target should be at least 248.02 (a reward of 4.40 points), giving you a 1:2 risk-reward ratio. Adjust your position size to risk no more than 1-2% of your account on this trade.
Final Thoughts
JPMorgan Chase & Co. (JPM) is showing a strong bullish trend on the 2-hour chart, with a confirmed breakout above the 234.50 resistance and a retest of this level as support. However, the recent price action near the POC at 243.01 and the lack of strong volume suggest that we might see a pullback or consolidation before the next move higher. The key levels to watch are 241.50 (trendline support), 243.01 (POC), and 248.02 (recent high).
For now, I’m leaning slightly bullish as long as the price holds above 241.50, but I’ll be ready to adjust my bias if we see a break below this level. Stay disciplined, manage your risk, and let the market show its hand before taking a position.
What are your thoughts on this setup? Let me know in the comments below, and happy trading!
This analysis is for educational purposes only and not financial advice. Always do your own research before making any trading decisions.
OptionsMastery: Sitting in a weekly demand on NKE!🔉Sound on!🔉
📣Make sure to watch fullscreen!📣
Thank you as always for watching my videos. I hope that you learned something very educational! Please feel free to like, share, and comment on this post. Remember only risk what you are willing to lose. Trading is very risky but it can change your life!
Microsoft - A Little Lower And Much Higher!Microsoft ( NASDAQ:MSFT ) is about to retest strong support:
Click chart above to see the detailed analysis👆🏻
In mid 2024 Microsoft perfectly retested the previous channel resistance trendline and the recent weakness has not been unexpected at all. However the overall trend still remains rather bullish and if Microsoft retests the previous all time high, a significant move will most likely follow.
Levels to watch: $350
Keep your long term vision!
Philip (BasicTrading)
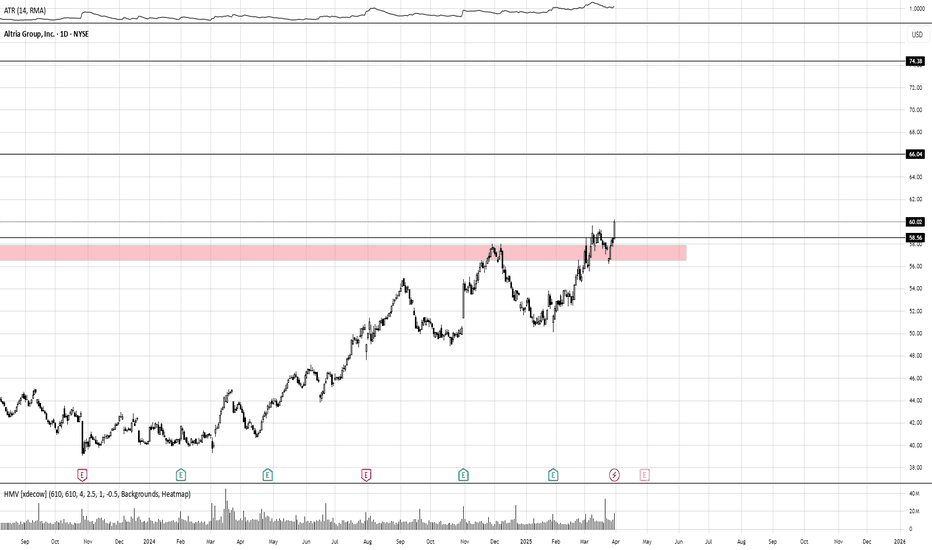
OptionsMastery: Immediate buy on MO!?🔉Sound on!🔉
📣Make sure to watch fullscreen!📣
Thank you as always for watching my videos. I hope that you learned something very educational! Please feel free to like, share, and comment on this post. Remember only risk what you are willing to lose. Trading is very risky but it can change your life!
OptionsMastery: Breakout Setup on SBUX!🔉Sound on!🔉
📣Make sure to watch fullscreen!📣
Thank you as always for watching my videos. I hope that you learned something very educational! Please feel free to like, share, and comment on this post. Remember only risk what you are willing to lose. Trading is very risky but it can change your life!
Gold - They All Call Me Crazy!Gold ( TVC:GOLD ) is just starting the next rally:
Click chart above to see the detailed analysis👆🏻
Just a couple of months ago, Gold perfectly broke out of the long term rising channel formation. After we then witnessed the bullish break and retest confirmation, it was quite clear that Gold will head much higher. This just seems to be the beginning of the next crazy major bullrun.
Levels to watch: $4.000
Keep your long term vision!
Philip (BasicTrading)
OptionsMastery: H&S on XLC!🔉Sound on!🔉
📣Make sure to watch fullscreen!📣
Thank you as always for watching my videos. I hope that you learned something very educational! Please feel free to like, share, and comment on this post. Remember only risk what you are willing to lose. Trading is very risky but it can change your life!
Looking for a bearish swing on META! H&S!🔉Sound on!🔉
📣Make sure to watch fullscreen!📣
Thank you as always for watching my videos. I hope that you learned something very educational! Please feel free to like, share, and comment on this post. Remember only risk what you are willing to lose. Trading is very risky but it can change your life!
GBPUSD Dusting 350+ PIPS in Choppy Waters - Breakout is Brewing?Technical / Chart Analysis:
Double Top Formation: The chart clearly exhibits a potential double top pattern around the 1.30564 resistance level. This is a bearish reversal pattern that suggests a potential trend change from bullish to bearish.
Breakdown of Uptrend: The preceding price action shows an uptrend, which has now been halted by the double top.
Key Support Level: The most crucial level to watch is the support around 1.28642. A confirmed break below this level would validate the double top pattern and signal a potential strong move downwards.
Monthly Performance: January saw a +180 pip move, followed by February with a +230 pip gain. This demonstrates the potential for significant profits in GBPUSD through swing trading.
Swing Analysis: February's +230 pip move consisted of 3 upward swings and 2 downward swings, highlighting the importance of capturing both upward and downward momentum in this pair due to the Choppy Price Action.
Conclusion:
FX:GBPUSD is at a critical juncture. The potential double top formation suggests a bearish bias, but confirmation is needed. Traders should closely monitor the key support level at 1.28642 for a potential breakdown and look for LONG Trades on breaking key levels to the Upside
What are your thoughts on GBPUSD's potential for swing trading? Do you see a breakdown or a bounce? Share your analysis and comments below!
SHORT ON ES?This could be a short rade idea for swing trade.
Las week price invalidate long ideas and the structure remain bearish.
Depending on how we open on Sunday, and with NFP week ahead, I would see ha Monday price will dive quick again, or retrace a little and offer short second half of he week.
Tesla - There Is Hope For Bulls!Tesla ( NASDAQ:TSLA ) is just crashing recently:
Click chart above to see the detailed analysis👆🏻
After Tesla perfectly retested the previous all time high just a couple of weeks ago, we now witnessed a quite expected rejection of about -50%. However market structure remains still bullish and if we see some bullish confirmation, a substantial move higher will follow soon.
Levels to watch: $260, $400
Keep your long term vision!
Philip (BasicTrading)
SUI Swing: The Art of Patience in TradingSUI has been playing nice with the technicals lately, giving us some really neat swing trade opportunities. Remember that short trade we talked about—from $3 down to around $2? Well, here's why that setup was a winner.
After that initial short trade, SUI bounced off $2 and then traded in a tight range between $2.5 and $2.2 for about two weeks. Then it broke higher to test the monthly open at $2.83—and it hit that level right on the dot. That’s where all the magic happens.
Why This Short Trade Worked
Fibonacci Confluence: When you draw a Fibonacci from the high at $3 to the low at $1.9626, the 0.786 level comes in at about $2.778. This is right near the monthly open, and we know that price tends to reverse between the 0.618 and 0.786 zones.
Trading Range POC: The $2.8 area was our previous point of control, so it adds extra weight as a resistance level.
Anchored VWAP: The VWAP from the high at $3.8999 sits just above the monthly open at around $2.855, giving us another nod that this level is important.
Fib Speed Resistance Fan: Even the speed resistance fan at the 0.618 level lines up with the $2.8 zone.
All these factors lined up to form a solid resistance area. That’s why short entries between $2.778 and $2.855 made sense.
Trade Setup Recap
Short Trade:
Entry Zone: $2.778 to $2.855
Target: The bullish order block at about $2.4745, which also lines up with the 0.618 fib retracement from the low at $2.2358 and the high at $2.8309
Risk-to-Reward: This setup gave us a risk-to-reward of 4:1 or even better, depending on where you set your stop-loss.
There’s also a possible long trade at the bullish order block, but that one’s only for when you see the confirmation.
Wrapping It Up
The takeaway? Confluence is your best friend. Waiting for that high-probability setup can really pay off. Let the trade come to you, don’t force it, and stay calm and focused.
Thanks for reading this SUI analysis. If you liked it, please leave a like and drop a comment. Happy trading!
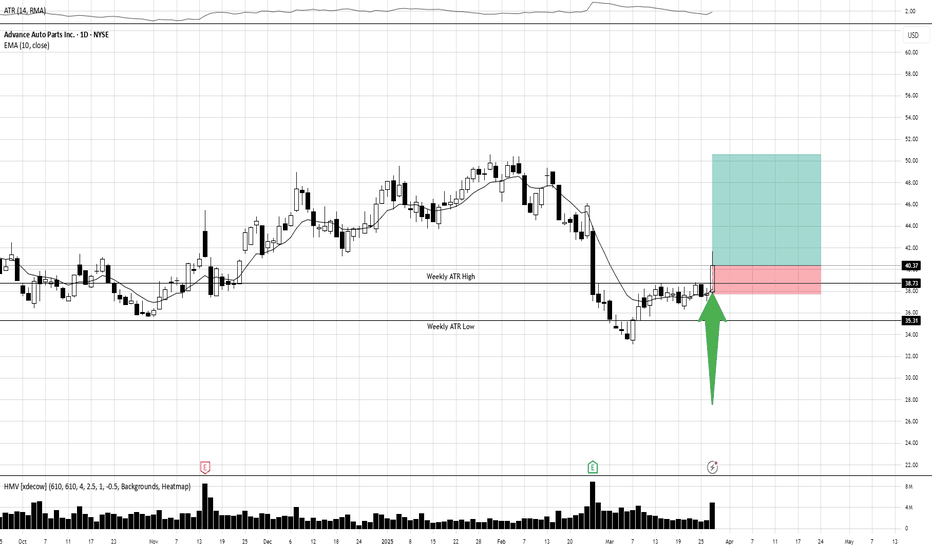
Looking for an immediate buy on AAP! 🔉Sound on!🔉
📣Make sure to watch fullscreen!📣
Thank you as always for watching my videos. I hope that you learned something very educational! Please feel free to like, share, and comment on this post. Remember only risk what you are willing to lose. Trading is very risky but it can change your life!
Bitcoin - Please Just Listen To The Charts!Bitcoin ( CRYPTO:BTCUSD ) remains in a bullish market:
Click chart above to see the detailed analysis👆🏻
Despite literally everybody freaking out about cryptos lately, big brother Bitcoin is still creating bullish market structure. During every past cycle we witnessed a correction of at least -20% before we then saw a parabolic rally. So far, Bitcoin is just doing its normal "volatility thing".
Levels to watch: 70.000, $300.000
Keep your long term vision,
Philip (BasicTrading)


