Jindal Steel- Time to move?!
Buy Above 895.3
Risk: Reward- 01:01
Target and stop Loss: 4%
1.Parallel downward channel Resistance breakout and retest
2.Good green bars formation
3.Double bottom( W Pattern) and resistance in RSI
4. 21 EMA Support taken
5.Bullish fair value gap rejection
6. Bounced from Resistance turned to support zone
Swingtrading

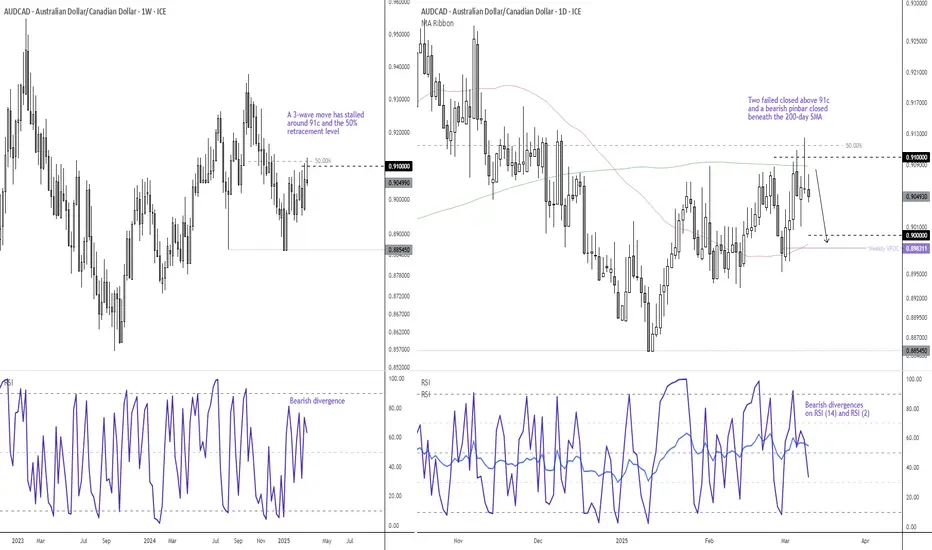
AUD/CAD stalls around 91c, pullback pending?A 3-wave move has developed from the January low, that for now appears hesitant to hold above 91c or its 50% retracement level. Twice we have seen false breaks of the 91c level on the daily chart, and Monday presented a bearish pinbar which closed below the 200-day SMA.
Bearish divergences have also formed on the weekly and daily RSI (14) and daily RSI (2). Perhaps a pullback is brewing.
Bears could fade into moves towards the 200-day SMA, in anticipation for a move down to at least 90c, just above the 50-day SMA and weekly VPOC (volume point of control).
And if the BOC refrain from promising further cuts while delivering an expected 25bp cut tomorrow, it could further strengthen the Canadian dollar and weaken AUD/CAD further.
Matt Simpson, Market Analyst at City Index and Forex.com
Solana: Time to Buy or More Pain Ahead?Solana has been in freefall since peaking at nearly $300 on January 19, 2025, dropping a staggering 61% to $115,47 in just 50 days, currently trading at around $119. A support zone for potential reversals.
The big question now: Is this the time to go long, or is more selling pressure ahead? Let’s break it down.
Key Support & Resistance Levels
Lost Key Level at $120
Solana lost the key support at $120, turning it into a resistance zone. For bulls to regain control, SOL must reclaim this level with confirmation and increased volume.
Next Key Lows to Watch
Below the current price, the next key liquidity zones are at $110 and $105, where buyers may step in.
Major Support Zone – $104 to $96
If selling continues, we have a strong support zone between $104.14 and $96.96, backed by multiple confluences:
Anchored VWAP Support: Taking the anchored VWAP from the 2023 lows at $8, we find it currently aligning near $100, a key psychological level.
Monthly Order Block: On the monthly timeframe, an order block sits right at $100 mark, reinforcing this level as strong support.
2024 Yearly Open: The yearly open from 2024 is at $101.72, adding another layer of confluence.
0.666 Fibonacci Retracement: Measuring from $8 to the all-time high of $295.83, the 0.666 Fib retracement is at $104.14, further strengthening this support zone.
Liquidity Pools: There's a lot of liquidity around the $100 area
Fib Speed Fan Support: The 0.7 Fib speed fan also aligns perfectly with this support zone.
Conclusion: The $104–$97 range becomes a high-probability long entry zone with minimal risk.
Long Trade Setup
Entry Zone: $118 – $97
Stop Loss: Below $95
Take Profit Target: $135
Average Entry: $105 (DCA)
Risk-to-Reward (R:R): a solid 3:1 or better
Strategy & Execution
With SOL already down over 60%, scaling into a long position makes sense. Here's how to do it the right way:
1️⃣ DCA Strategy – Instead of going all in, scale in gradually within the $118–$97 range for a better average entry.
2️⃣ Volume & Price Action – Watch for a spike in volume and bullish price action before adding to the position.
3️⃣ Psychological Level Play – There are likely many buy orders around $100, meaning a bounce before hitting lower support is possible.
Stay tuned for updates as this trade unfolds! 🚀

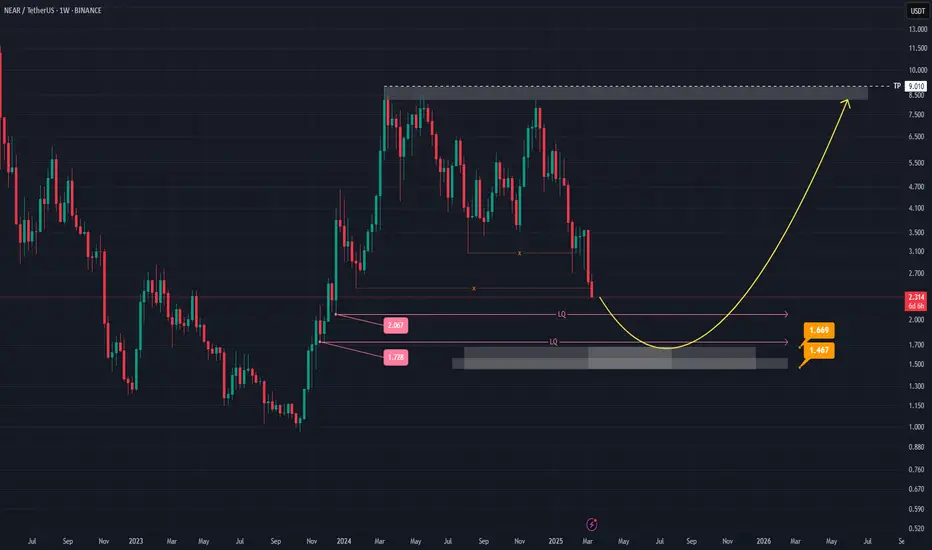
NEAR (NEARUSDT) Weekly Analysis: Potential Reversal in SightHey everyone! Let’s take a look at NEAR (NEARUSDT) on the weekly chart. There’s a chance the price might move into the 1.728–2.067 range, possibly sweeping up some liquidity before heading toward the 1.467–1.669 zone. This area seems like it could act as a launchpad for a potential bounce, aiming for higher targets afterward.
Watch for a spike in trading volume around that zone—if volume picks up, it could indicate stronger buying interest. Another key signal to look out for is a bullish candlestick pattern (like a hammer or a bullish engulfing), which might confirm a reversal if it appears near the 1.467–1.669 level.
Of course, if the price drops below 1.467, it might change this outlook and suggest a different path forward. Since the market can be unpredictable, it’s always important to keep an eye on these levels and stay prepared.
Above all, remember to do your own research and stay informed—this space can move fast, and it’s best to approach it with a curious mind. Keep learning, stay positive, and good luck out there! 📈
ENA Breaks Downtrend – Is a Rally Incoming?$ENA/USDT 12H chart shows a breakout above the resistance trendline and the 50 EMA, indicating a potential trend reversal. However, the price is currently facing resistance near the previous support-turned-resistance zone.
A retest of the trendline breakout is possible before further upside. If the price holds above the trendline and reclaims support, it could confirm a bullish continuation.
However, failure to hold may result in a fakeout and further downside.
DYOR, NFA

INJ Price Analysis: Key Zones & Reversal ScenariosHey everyone! 👋
Let's dive into this price chart and see what’s going on with INJ.
Overview:
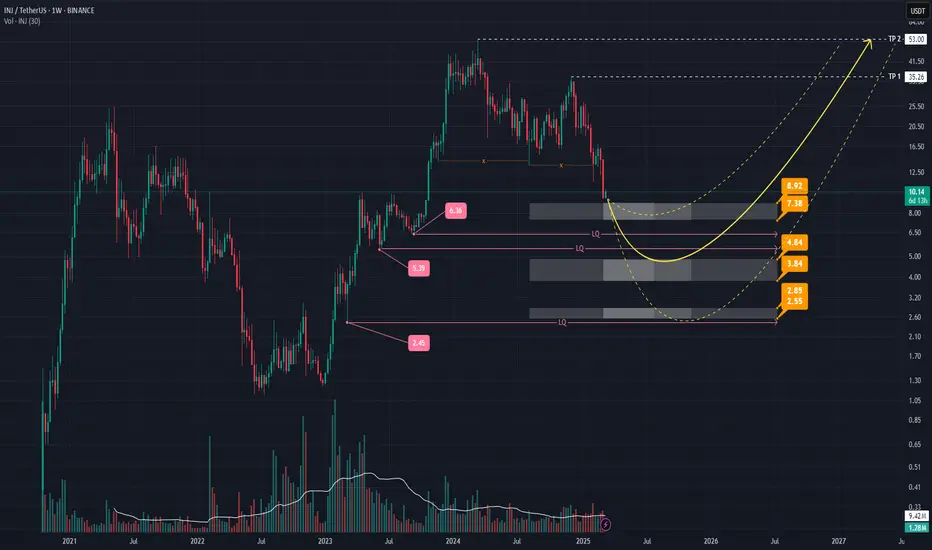
We’re looking at INJ on a weekly timeframe , and there are some interesting levels to watch. The chart shows **three key zones** where price reactions might happen, marked with price levels. There are also areas of liquidity (LQ) , where the market might make a move before reversing direction.
Potential Reversal Scenarios:
Three possible price movements are shown with yellow arrows , each representing a different way the price might reverse. The second arrow is the primary scenario, suggesting that after sweeping at least one liquidity level, the price could bounce back up—especially if there’s solid volume and a strong candlestick pattern.
- Main Support Zone (3.84 - 4.84): This area is the most important. If the price reaches this zone and shows good volume and a strong candlestick pattern, it could signal a trend change.
- Other Support Zones (2.55 - 2.85 and 7.38 - 8.92): These are additional key levels. A drop below these could change the outlook.
Take Profit (TP) Targets:
TP levels are marked on the chart. If the price reverses as expected, these targets may be reached.
Final Thoughts:
Nothing in crypto is guaranteed! Always look for confirmations like volume and candlestick patterns before making decisions. Stay informed, trade smart, and always do your own research! 📊💡
GBPUSD Week 11 Swing Zone/LevelsLast week marked the first losing week of the year.
With a strong upward trend, a price pullback is expected.
By using tight stop losses and effective trade management, we keep losses small while aiming for larger gains. To achieve this, the stop loss is moved to break even once the price gains 20 pips.
a or b? Only price can tell

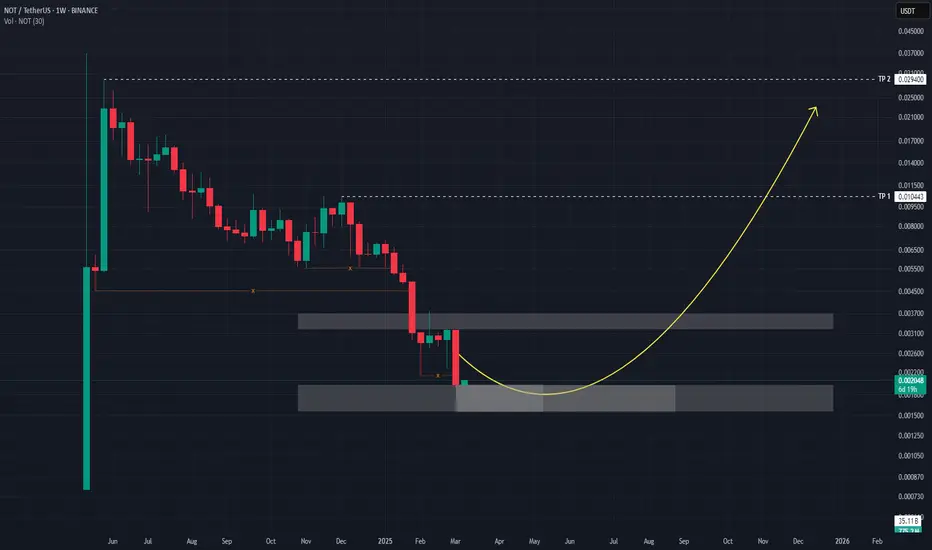
NOTUSDT Weekly Demand Zone: Potential Bullish Reversal at 0.0019This analysis focuses on Notcoin (NOTUSDT) on the Weekly timeframe , identifying a key demand zone that suggests a potential bullish reversal .
Based on chart observation, the price of NOTUSDT is approaching a critical demand zone located between 0.001971 and 0.001561 . This zone is anticipated to act as strong support, potentially marking a significant price low for the asset in the current market cycle.
The expectation is that within this demand zone , buyers will step in with sufficient volume , leading to a change in the current price trend and initiating a bullish reversal . The presence of proper volume upon entering this zone will be crucial to confirm the strength of the demand and the likelihood of a sustainable upward movement.
To illustrate the potential upside, Take Profit (TP) levels have been marked on the chart. These TP levels represent projected targets for the price following a successful bounce from the demand zone. Traders and investors should monitor price action closely as it interacts with this zone, looking for bullish confirmation signals such as:
Increased buying volume: A surge in volume as the price tests the demand zone would indicate strong buyer interest.
Bullish candlestick patterns: Formation of reversal candlestick patterns within the zone (e.g., bullish engulfing, hammer) could further validate the potential for an upward move.
In summary: This analysis suggests that the 0.001971 - 0.001561 zone presents a significant opportunity for a potential bullish reversal in NOTUSDT on the weekly timeframe. Closely monitoring price action and volume within this zone is recommended to identify potential long entry opportunities, targeting the marked Take Profit levels as the asset recovers.
New Setup: MPUsing a simple 5-SMA crossing 20-SMA strategy, we got MP setup for a possible up move soon.

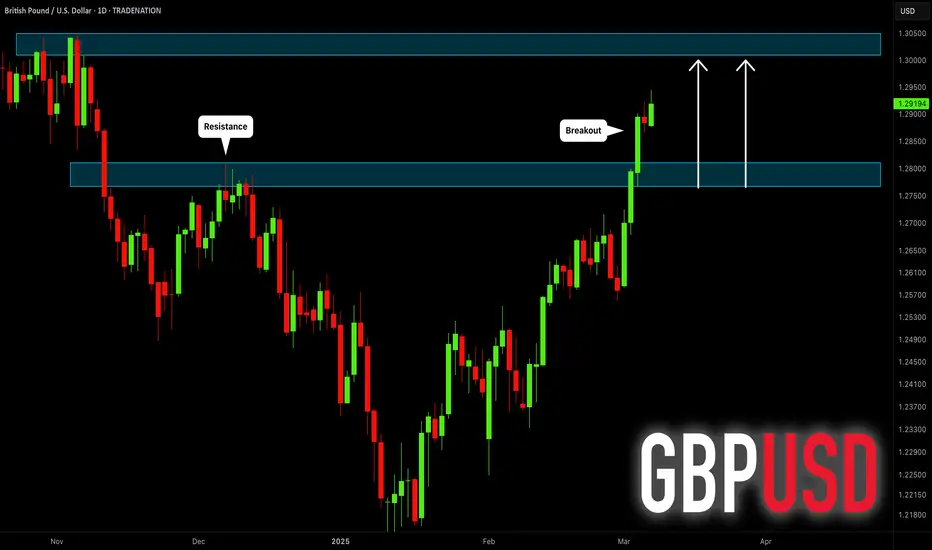
GBPUSD: Bullish Outlook For Next Week Explained 🇬🇧🇺🇸
GBPUSD broke and closed above a key daily horizontal
resistance this week.
The next strong historic structure is 1.3.
It will most likely be the next goal for the buyers the following week.
❤️Please, support my work with like, thank you!❤️
I am part of Trade Nation's Influencer program and receive a monthly fee for using their TradingView charts in my analysis.
Gold (XAUUSD) - Liquidity Grab & Potential ReversalGold has been showing interesting price action around key levels, forming a potential double top structure. The market tested the 2,930.19 resistance level, rejecting it sharply and showing signs of exhaustion.
Possible Scenario:
- Point A : Price is currently reacting from a key resistance level where liquidity is stacked.
- Point B : A potential sweep of liquidity around 2,874.04 , where price could create a demand zone before reversing.
- Point C : If buyers step in after the liquidity grab at B, we could see a rally back into the resistance zone, targeting a break of 2,930.19 .
However, if the structure breaks lower without a strong buyer reaction, further downside could come into play, possibly targeting 2,820 as the next liquidity zone.
Key Considerations:
- Monitoring fundamental catalysts such as economic data and interest rate decisions. With NFP and Fed updates this week, volatility is expected!
- Watching for confirmation of bullish intent after the liquidity grab.
- Tracking volume to gauge potential momentum.
🚀 Do you think gold will hold above 2,874.04 , or will bears take over? Drop your thoughts below! 🚀
#Tradingview
FOREXCOM:XAUUSD

TTD at multi month supportTTD has been beat to pieces the past month. However we have just reached a multi month support which could present a short term bounce

The Dollar's Demise May Not Be Over Just YetThe US dollar index is on track for its worst week in nearly two and a half years. It is also nearly 6% off from the January high, which is similar in depth to the two previous selloffs seen in 2023 and 2024. Yet I do not think we've seen the low just yet, even if there is evidence of a potential bounce on the daily chart.
Matt Simpson, Market Analyst at City Index and Forex.com

Gold - A Bullish Close Would Be Insane!Gold ( TVC:GOLD ) has to close bullish now:
Click chart above to see the detailed analysis👆🏻
Just since the end of 2022, Gold rallied about +80% which is simply unbelievable looking at the already significant market cap of the precious metal. However this bullrun does not seem to be over and if Gold confirmes the trendline breakout, another rally of +40% will follow soon.
Levels to watch: $4.000
Keep your long term vision,
Philip (BasicTrading)

Demand zone for STNG!🔉Sound on!🔉
📣Make sure to watch fullscreen!📣
Thank you as always for watching my videos. I hope that you learned something very educational! Please feel free to like, share, and comment on this post. Remember only risk what you are willing to lose. Trading is very risky but it can change your life!

GBP/USD: Bulls in Control… For Now! Key Levels to Watch Hello Folks
GBP/USD is holding strong above 1.2533, and I see a potential bullish move toward 1.2805 if momentum continues. But I’m staying flexible—if price breaks below 1.2450, my bias shifts, and I’ll look for downside targets instead. 📊
📍 Here’s how I see it:
✅ Bullish above: 1.2533 → 1.2627 → 1.2650 → 1.2805 🚀
❌ Bearish shift below: 1.2450 → 1.2378 👀
💡 My Plan:
As long as GBP/USD stays above 1.2533, I’m bullish and expecting a push toward 1.2805 📈
If price drops below 1.2450, I’ll reconsider and look for shorts instead 📉
⚠️ No need to rush—let the market confirm the move!


Potential Bounce ComingPart 1 of 2: Seeing some signs of a short term bounce coming. Planning to unload the few positions I still have open for now.

SWING IDEA - SAILSAIL Stock Technical Analysis
Steel Authority of India Limited ( NSE:SAIL ) has been consolidating around the 95 resistance level for over a year. After multiple attempts, the stock finally broke out above this level in January 2024, turning it into a strong support zone.
Following the breakout, SAIL surged to a peak of 175, marking an 85% gain. However, the stock then saw a sharp retracement, correcting by nearly 47% and revisiting the rising trendline support around the 100-105 range. This level, which previously acted as resistance, has now become a critical demand zone.
Currently, SAIL is showing signs of renewed bullish momentum, bouncing off its trendline support and forming a potential reversal. The weekly MACD crossover, observed in the chart, further reinforces a trend reversal signal. Additionally, a short-term upside target of 12% is indicated, while a long-term potential target of 76% upside is visible in the chart, aligning with the previous swing high.
The chart also highlights three take-profit targets:
Target 1: The first profit-taking zone, offering an initial opportunity to secure gains.
Target 2: A mid-level profit-taking zone, aligning with previous consolidation areas.
Target 3: The final take-profit level around 175, marking the prior high and a potential full exit point for long-term investors.
KEY OBSERVATIONS:
One-year resistance of 95 was decisively broken in January 2024
Stock surged 85% to a high of 175 before correcting 47%
100-105 level now acts as a strong rising trendline support
Weekly MACD crossover signals a bullish momentum shift
Three take-profit targets identified, with the final target at 175
Potential upside target of 76% from support levels, aligning with previous highs
RECOMMENDATION:
Based on this technical analysis, holding SAIL for the long term could be a strong strategy. The potential returns include:
12% upside in the short term
76% upside from current levels, targeting previous highs around 175
This analysis presents a compelling buying opportunity in SAIL, fueled by its breakout, support validation, and momentum reversal.
IMPORTANT NOTE:
Investors should be aware that there is a chance the stock may retest the 100-105 support level before resuming its upward trajectory. This potential pullback should be carefully monitored, and investment strategies should be adjusted accordingly.
DISCLAIMER: This analysis is for educational and informational purposes only and should not be considered as financial advice. Technical indicators and historical data are not guarantees of future performance. Investors should conduct thorough research, assess risk tolerance, and consult a financial advisor before making any investment decisions.

Meta - The Breakout Is About To Be Confirmed!Meta ( NASDAQ:META ) is attempting the breakout:
Click chart above to see the detailed analysis👆🏻
Over the past couple of months, we have been witnessing an incredible rally of about +750% on Meta. Looking at the long term reverse triangle pattern, this rally was not unexpected and such is the breakout. We still need to see confirmation, but then Meta will target the four digit level.
Levels to watch: $700, $1.000
Keep your long term vision,
Philip (BasicTrading)

JNJ Update | Swing Trade 2 PlaysShort term price action is at a high in which I'd like to see a retracement for a short opportunity. The long term play I would like to buy once price is near $150 to hold towards $180.
Last Post
*A break below the trendline followed by a retest and rejection would invalidate the trend based on my bearish TA.*

LEMONTREE HOTELS 240 MINS TIME FRAMEThe Structure looks good to us, waiting for this instrument to correct and then give us these opportunities as shown on this instrument (Price Chart).
Note: Its my view only and its for educational purpose only. Only who has got knowledge about this strategy, will understand what to be done on this setup. its purely based on my technical analysis only (strategies). we don't focus on the short term moves, we look for only for Bullish or Bearish Impulsive moves on the setups after a good price action is formed as per the strategy. we never get into corrective moves. because it will test our patience and also it will be a bullish or a bearish trap. and try trade the big moves.
We do not get into bullish or bearish traps. We anticipate and get into only big bullish or bearish moves (Impulsive Moves). Just ride the Bullish or Bearish Impulsive Move. Learn & Know the Complete Market Cycle.
Buy Low and Sell High Concept. Buy at Cheaper Price and Sell at Expensive Price.
Please keep your comments useful & respectful.
Keep it simple, keep it Unique.
Thanks for your support
Tradelikemee Academy
Saanjayy KG

Bearish BTCOn the daily and weekly stochastic RSI is in the overbought zone.
Using fibonacci, on the daily, price has not finished out the fib sequence to the d extension and had less than a 38.2 pullback.
We hit a d extension on the monthly.
Still bearish on this pair at least to 77K = 38.2 up fib retracement zone with inclination toward further downside potential to 68K = 61.8 up fib retracement zone.
