Ethereum (eth) Long entry setup supply and demand + ote 📊 Precise Setup for a Long Entry on ETH/USD
💡 Why this trade?
🔹 Strong demand zone detected (S&D)
🔹 Optimal Trade Entry (OTE) confirmed by the 62%-79% Fibonacci retracement
🔹 Bullish breakout + strong reaction at a key order block
🎯 ETH/USD Trade Plan
✅ Optimal entry point (OTE) 📍: Waiting for a fresh bullish demand zone on H1 or M15
✅ Key demand zone (S&D) 🛑: $3,060.00
🔥 ETH is setting up for a strong move! This Supply & Demand + OTE strategy offers a high-probability trade with an excellent risk-to-reward ratio.
📢 Follow for more exclusive analysis and trade signals! 🚀
#Ethereum #Crypto #Trading #ETH #SupplyAndDemand #OTE #SmartMoney #DayTrading #SwingTrading #CryptoSignals #TechnicalAnalysis
Swingtrading

Trade Review - BYONWhen SAGE showed up in screener there was a bullish continuation pattern on the daily timeframe and a potential exhaustion on the higher timeframe.
The higher timeframe is in a downtrend, have made a measured move down (volatility projection) and is extended from the mean, thus we observe for potential reversion.
The lower timeframe provided a bullish continuation setup, which allows us to enter with a more structured approach. The target was a measured move up, as this is a projection of the current volatility.

EurUsd - This Will Impact Your Trading In 2025!EurUsd ( OANDA:EURUSD ) is heading much lower:
Click chart above to see the detailed analysis👆🏻
For basically an entire year, EurUsd has been retesting a massive previous support which was then turned resistance. Over the past couple of months, we then saw a significant drop breaking all structure towards the downside and it is quite likely that this won't stop soon.
Levels to watch: $1.090, $0.970
Keep your long term vision,
Philip (BasicTrading)

UPDATE SWING TRADE SETUP EURUSDThe two major news events have come and gone and the long setup on EU is not only still valid but we have gotten confirmation with a bullish choch
I'm looking for price to react bullish on the lower timeframe from the fair value gap or the 2H OB. This is to get the best possible entry with a relatively smaller SL.
There is always a chance that the setup won't work out however in my opinion this has a small chance of failing.
Main target is the daily high and a longer term target is December's high unless price action changes bearish.
Hope this analysis helps and remember to always follow your rules and keep good risk management

USDCAD: To the Year's High 🇺🇸🇨🇦
USDCAD looks bullish after a breakout of a neckline
of an ascending triangle pattern on a daily.
Probabilities are high, that the resistance based on the year's high
is going to be reached soon.
Goal - 1.448
❤️Please, support my work with like, thank you!❤️

BUY OPPORTUNITY ON NVIDIA Hello,
According to my analysis We've identified a huge current opportunity to buy NVIDIA with a high probability and a favorable risk-reward ratio of over 3 in Daily chart.
Our target is $152.5 within a few days (Swing trade).
Ibrouri

New Setup: ARKKTo help minimize risk exposure during Earnings, ETF's such as ARRK would be a safe swing trade providing they have the right setup for me.

New Setup: APPWe're going into Earnings and normally stocks tend to head-up going into Earnings. One additional factor that I missed to point out is that the 20 and 50-SMA are converging below it as support.

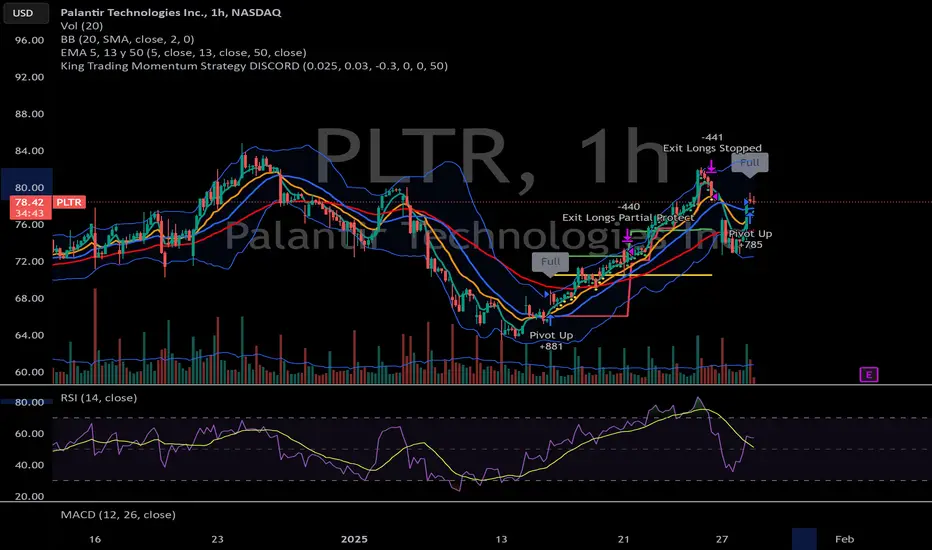
Can PLTR Press to All Time Highs??? and breakout this time?PLTR just signaled on the hour utilizing the King Trading Momentum Strategy. This one from a technical standpoint, looks like an inverse head and shoulders and as much as MM's keep trying to sell it, it keeps bouncing back. A full measure move takes this one back to the neckline where it can balance and fail or breakout. This aligns well with the take-profit of 6% and a stop-loss of 3.5%.
The King Trading Momentum Strategy combines the 5 EMA crossing above the 13 EMA, RSI strength, favorable momentum as measured by ADX plus evaluating recent volume changes and even something that measures breakout momentum called Beta for this one! PLTR and over 100 equities are built into this script with optimal backtest take profits and stop losses and can be toggled on by simply checking a box (default they are turned off). This week even with the crazy DEEPSEEK Monday selloff, the algo has 6 winners and 3 losers! Hopefully this is the next winner!
EURGBP: Bearish Confirmation After Test of Resistance 🇪🇺🇬🇧
EURGBP may continue falling after a test of a significant
daily resistance.
We see multiple violation on minor supports, indicating
the strength of the sellers.
With a high probability, the pair is going to reach 0.8367 support soon.
❤️Please, support my work with like, thank you!❤️

New Setup: FHNFound a bank stock that is setup. Banks sector has been bullish lately, so this may be ready to run this week.

New Setup: FNKOWhile the news are all calling for a bloodbath in stocks, there are a few notable stocks that are now setup.

USD/CHF | Bearish Season IncomingHigher timeframes (3-Day+) are at a nice resistance zone to see short plays only as we head into the next season
We got a ~600 pip swing but first I'd like to see maybe one more long position back to the main resistance zone for a high sell entry up top and then scaling in as price falls after more confirmation and price development
Trend Reader is looking nice too as its in the overbought zone signaling a bearish play to come with clear divergence
The blue EMA at around 150-Days also acts as good dynamic Support/Resistance to help confirm that flipside once price looks to break below with a rejected pullback.

BUY AMD!!!!Approaching a significant level where we can expect AMD to complete this bearish cycle and begin a bullish cycle. Partial Profits at All-Time-Highs.

Need a Vacation with OOTO?This one just fired and vacation stocks likely don't care about semi-conductors. Who knows, maybe they even benefit from cheaper AI on a laptop computer!
This bull flag if it breaks out has a 7% profit target based on Fib Extension, with the algo backtest saying 5% take-profit and a 3.5% stop loss. If it hits 5%, I will go ahead and protect by selling half and then set trailer for 1.75% on remainder, with the intention of selling on the way up to 7%! But for now, I will just be happy if momentum continues to the upside!
The King Trading Momentum Strategy combines the 5 EMA crossing above the 13 EMA, RSI strength, favorable momentum as measured by ADX plus evaluating recent volume changes and even something that measures breakout momentum called Beta for this one! OOTO and over 100 equities are built into this script with optimal backtest take profits and stop losses and can be toggled on by simply checking a box (default they are turned off).

Chips No Longer Power Hungry?With news of DeepSeek overnight hitting semi-conductors, is there all of a sudden less need for power? Well if there is then the first place I typically go is ERY. This ETF trades as a Bear 2x leveraged ETF to XLE. This means that for every penny XLE goes down, ERY goes up two pennies... Developing situation here so will watch this one closely!

NVDA Stock Update: Downtrend Alert!📉 NVDA Stock Update: Downtrend Alert! 🚨
Attention traders!
As we analyze the current market structure for NVIDIA (NVDA), it's crucial to note the recent developments on the daily chart.
Key Observations:
Market Behavior Since December 20, 2024: NVDA has been in a ranging market, characterized by significant volatility.
Bearish Signal: We witnessed a huge bearish engulfing pattern, indicating strong selling pressure. This is a critical signal for traders to consider.
Break of Key Level: The recent higher high can now be defined as a Lower High (LH) as the base of the order block at $129.60 has been broken.
Expected Support Levels:
As we move forward, we anticipate the following support levels:
$124.94
$120.33
$115.78
We are particularly focused on potential accumulation within this Demand Zone. It's essential to stay vigilant and adapt your strategies accordingly!
Happy trading, and stay safe! 📊💼

NZDCAD: Important Structure Breakout 🇳🇿🇨🇦
NZDCAD broke and closed above a significant
daily horizontal structure cluster.
The broken zone turned into a support now.
With a high probability, the pair will continue rising.
Next resistance - 0.82345
❤️Please, support my work with like, thank you!❤️

GBPUSD Week 5 Swing Zone & LevelWelcome back traders.
Swing zone and levels are set in, with predicted path.
As always price action determines trades

Time to "ZOOM" back to winnings ways?On Thursday afternoon, the King Trading Momentum Strategy triggered alongside eleven other alerts, followed by five more on Friday. This flurry of signals doesn’t exactly indicate a “bearish” sentiment, but as always, the market has its unpredictable ways! With markets approaching all-time highs, I’ve been cautious, limiting my positions to just a few with low allocations in TNA, ADBE, PYPL, and XYZ.
When I analyzed Zoom (ZM), I noticed that it experienced a strong rally from July through the end of the year, gaining over 50%. Now, the key question is: has it finished consolidating, or is there more downside ahead?
Looking back to July, ZM’s performance suggests a classic bull flag pattern. It’s retraced to the 38% Fibonacci level, and during a two-hour window when the signal fired, the impressive “wick” formed caught my attention. Now, after a short-term pump, it’s retracing again, and I’m eyeing the 50% Fibonacci level as a potential entry point.
Unless Monday brings a major selloff due to concerns over the Fed meeting on Wednesday or the PCE data on Friday, I’ll likely use the usual morning volatility to position myself in this trade. Let’s see how this one unfolds!
The King Trading Momentum Strategy employs a robust combination of indicators: the 5 EMA crossing above the 13 EMA, RSI strength, favorable momentum measured by ADX+, and MACD confirmation. ZM, along with over 100 other equities, is integrated into this script with optimized backtested take-profit and stop-loss levels. Activating these parameters is as simple as checking a box (they’re off by default), making this strategy both powerful and user-friendly.

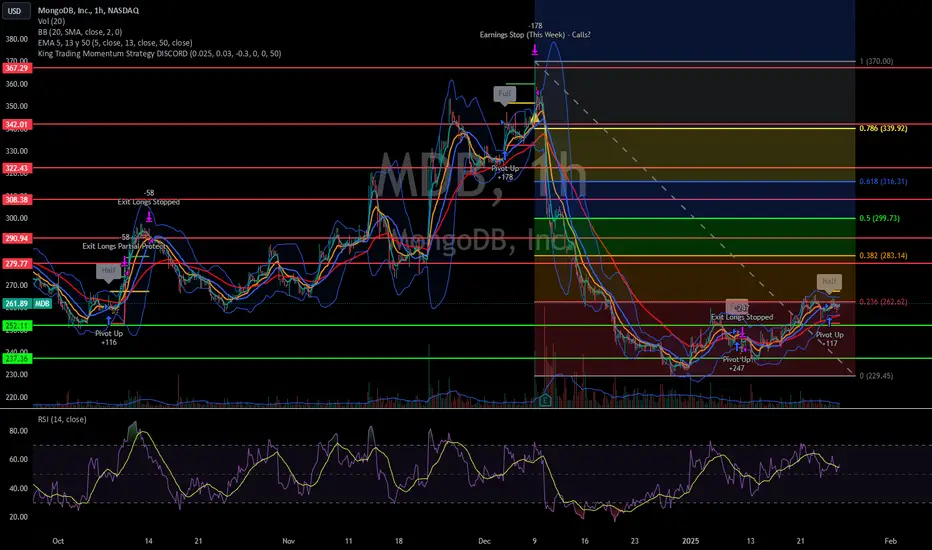
Time to Enter MDB Again?On Thursday afternoon, the King Trading Momentum Strategy signaled alongside eleven other alerts that day, followed by five more on Friday. This activity doesn’t exactly scream “bearish” to me, but the market has a way of keeping you on your toes! With markets once again approaching all-time highs, I’ve been treading cautiously. My positions have been limited to just a few, with low allocation sizes in TNA, ADBE, PYPL, and XYZ.
When I looked at MongoDB (MDB), I found myself wondering why it was hammered after posting a double beat on earnings and providing decent guidance. It turns out the recent drop was primarily driven by the announcement that Michael Gordon, MongoDB's Chief Operating Officer and Chief Financial Officer, will be stepping down on January 31, 2025. Is this reaction overblown? After all, the company delivered a strong earnings report.
That said, MDB seems to have planted its bull flag in the ground. Even if this news creates headwinds, there’s a possibility it could retrace back to the 38% Fibonacci level. Even if the broader market eventually pulls MDB lower, this setup suggests an 8% potential upside, and I’ve set an initial take profit at 5% with a 3% stop loss. If this can hit the take profit, I will sell half to protect the trade and then set a trailing stop loss of 1.5% on the remainder, trying to sell of much of it as possible on the way up!
Unless Monday brings a complete washout due to fears surrounding the Fed meeting on Wednesday or the PCE data on Friday, I’ll likely use the typical morning volatility as an opportunity to enter this trade. Let’s see how this one plays out!
The King Trading Momentum Strategy combines the 5 EMA crossing above the 13 EMA, RSI strength, favorable momentum as measured by ADX plus evaluating recent volume changes and even something that measures breakout momentum called Beta for this one! MDB and over 100 equities are built into this script with optimal backtest take profits and stop losses and can be toggled on by simply checking a box (default they are turned off).
Gold - This Resistance Decides Everything!Gold ( TVC:GOLD ) is retesting massive resistance:
Click chart above to see the detailed analysis👆🏻
All bullruns will eventually end with a consolidation or a correction but on Gold it is clearly not certain whether this bullrun is actually over or not. We are seeing a lot of indecision price action lately but in order to turn bullish, Gold has to break this resistance.
Levels to watch: $2.700, $2.000
Keep your long term vision,
Philip (BasicTrading)

Long Setup GBPJPY👋Hello Traders,
Our 🖥️ AI system detected that there is an H1 timeframe ICT Long setup in
GBPJPY for session trade (a couple of Hours)
Here is a session trade idea Sell limit order level for reference, TP and SL in pips
Cancel limit order before any great news in Forex.
For more ideas, you are welcome to visit our profile in tradingview.
Have a good day!
Please give this post a like if you like this kind of simple idea, your feedback will bring our signal to next better level, thanks for support!
