GBPUSD Live Week 49 Swing ZonesWeek 48 ended with 20pp, with price moving in fairly the predicted direction.
Week 49 Sz is as highlighted 210-160, price is currently trending below having failed to bounce off.
Will be looking @ calculated lower levels of 814 and 616, for bounce back up.
As always Price action determines trades.
Swingtrading

Jackpot | The begin of impulsehello fellas,
The monthly swing has corrected for about 61%, now at weekly/Daily there is a clear indication of the trend change to buy after the correction.
The impulse of the weekly swing has begun, the market can move to the previous high(2979.45) which is 80% from the CMP.
The risk : reward is 1:3.45

BTCUSD Swing trade ideaThough I am not very active in posting on the platform, I decided to once again share my ideas on BTC. While I personally would love to see a retest of the prior ATH break, I don't believe it is on the table for the time being. The following is a simple swing trade setup using some already very publicly known retail concepts such as SMC.

XRPUSD on the Rise: Positioning for Profits with X1X2 AnalysisXRPUSD is currently positioned for a bullish breakout, and I’m excited to share my analysis using the X1X2 methodology to capture potential long opportunities.
In my approach, I will leverage probabilities to strategically get positioned for long entries.
Key Fundamentals Supporting the Bullish Bias
Several fundamental factors are contributing to this bullish outlook:
- Legal Clarity: Recent developments in regulatory clarity surrounding cryptocurrencies are fostering a more favorable environment for XRP, which is crucial as it aims to expand its use case in cross-border payments.
- Increased Adoption: There’s growing interest from institutional investors and partnerships that enhance XRP's utility within the financial ecosystem.
- Market Sentiment: The overall market is experiencing a resurgence, with Bitcoin's recent price action influencing altcoins positively, including XRP.
With the combination of technical analysis and supportive fundamentals, there’s a compelling case for entering long positions.
Let’s stay informed and ready to capitalize on the opportunities ahead!
Feel free to share your thoughts or questions below!
1M:
2W:
4H:
P.S. If you have any questions about how I trade probabilities with the overall market direction, feel free to reach out.

CADJPY: Important Breakout 🇨🇦🇯🇵
CADJPY broke and closed below a key daily horizontal support.
After a breakout, the broken structure turned into a resistance.
With a high probability, the market will continue falling
and reach 105.37 level soon.
❤️Please, support my work with like, thank you!❤️

AMD to the upside? 🔉Sound on!🔉
Thank you as always for watching my videos. I hope that you learned something very educational! Please feel free to like, share, and comment on this post. Remember only risk what you are willing to lose. Trading is very risky but it can change your life!

A classic break and retest on RBLX! 🔉Sound on!🔉
Thank you as always for watching my videos. I hope that you learned something very educational! Please feel free to like, share, and comment on this post. Remember only risk what you are willing to lose. Trading is very risky but it can change your life!

Looking for a break and retest on Apple! 🔉Sound on!🔉
Thank you as always for watching my videos. I hope that you learned something very educational! Please feel free to like, share, and comment on this post. Remember only risk what you are willing to lose. Trading is very risky but it can change your life!

Looking for a breakout on MSFT! 🔉Sound on!🔉
Thank you as always for watching my videos. I hope that you learned something very educational! Please feel free to like, share, and comment on this post. Remember only risk what you are willing to lose. Trading is very risky but it can change your life!

GBP/USD: Bullish Bias and Strategic PositioningToday, I’m excited to share my analysis on the GBPUSD currency pair, which is currently showing a strong bullish bias.
As we navigate through the market, I will be utilizing probabilities to strategically position myself for long trades.
Current Market Dynamics
The GBP/USD pair has recently shown resilience, bouncing off critical support levels around 1.2670. This rebound suggests a potential bullish reversal, driven by positive sentiment surrounding the UK economy.
Key fundamentals such as the Bank of England's recent decisions to maintain interest rates amidst inflationary pressures signal confidence in economic stability, which supports our bullish outlook.
Global Influences
On the global stage, factors such as a weakening U.S. dollar and improving economic indicators from the UK create a favorable environment for the British Pound. Additionally, geopolitical developments are leaning towards stability, which typically boosts investor confidence in GBP.
Trading Strategy
In this context, I plan to leverage statistical probabilities to identify optimal entry points for long positions. By focusing on key technical indicators, I aim to maximize potential gains while effectively managing risk.
Join me as we explore this exciting opportunity in GBP/USD! Let’s make informed trading decisions together and capitalize on this bullish momentum. Happy trading!
2W:
3H:
P.S. If you have any questions about how I trade probabilities with the overall market direction, feel free to reach out.

TH Plant - Wedge Breakout (A+ Swing Trade Setup)TH Plant Wedge Breakout (A+) - Swing trade
CP - Wedge Breakout
RSI > 50 (Rebound at 50 during Entry)
SCDMX - Red Candle 20% (Strong Institution influence)
AP - 1st Buy Signal
2nd Confluence (A+)
A+ Setup - Breakout on the 4th rebound point on the strong upward trendline
CD - Tweezer Bottom on the rebound point
Entry Price Close above 200SMA
www.tradingview.com
EP - 0.675
TP - @ R0.715 / @R0.775 / TP @ 0.8 (XOX) / @ R0.840
SL - @0.61 (below previous low)
R:R - 1:2
Market Condition - KLCI is rebounding on 200SMA with Morning Star CD.
Bursa Plantation Index - Still Bullish with RSI > 50. But in Consolidation upon entry and rebound on closing.
FCPO Index - Bullish.
All the best guys. Will let you know the results.

Breaks Out of a Bullish Flag: Key Levels and What to Watch NextWillis Towers Watson NASDAQ:WTW is breaking out of a classic flag pattern, reclaiming key resistance with strong volume.
The price action suggests solid momentum, and the breakout above 321$ could pave the way for further upside. The high-volume also support this move and shows strong buyer interest, making it a setup interesting.
As long as the price holds these levels, the breakout could continue driving bullish sentiment.

SWING IDEA - APTUS VALUE HOUSING Aptus Value Housing Finance , a leading home loan provider focusing on affordable housing, is showing promising signs for a swing trading opportunity.
Reasons are listed below :
370-390 Zone Breakout : This level has been tested multiple times, and the stock is now attempting to break out, indicating potential for further upward movement.
Breaking Consolidation Zone of 3+ Years : The price is emerging from a prolonged consolidation phase, which could lead to a new bullish trend.
Higher Highs and Higher Lows : The trend remains intact with consistent upward movements, suggesting continued strength.
Trading Above Weekly 50 and 100 EMA : The stock is trading above these key moving averages, reinforcing the bullish outlook.
New All-Time High : The stock has made a new all-time high, reflecting strong market sentiment.
Volume Spike : A noticeable increase in trading volume indicates increased buying interest.
Target - 450 // 510
Stoploss - weekly close below 335
DISCLAIMER -
Decisions to buy, sell, hold or trade in securities, commodities and other investments involve risk and are best made based on the advice of qualified financial professionals. Any trading in securities or other investments involves a risk of substantial losses. The practice of "Day Trading" involves particularly high risks and can cause you to lose substantial sums of money. Before undertaking any trading program, you should consult a qualified financial professional. Please consider carefully whether such trading is suitable for you in light of your financial condition and ability to bear financial risks. Under no circumstances shall we be liable for any loss or damage you or anyone else incurs as a result of any trading or investment activity that you or anyone else engages in based on any information or material you receive through TradingView or our services.
@visionary.growth.insights

SWING IDEA - HDFC LIFE INSURANCE HDFC Life Insurance , one of India's leading life insurance companies, is showing strong technical signals for a swing trade.
Reasons are listed below :
750 Zone Breakout : This level has been tested several times and the stock is now poised to break out, indicating potential upward momentum.
Breaking Consolidation Zone of 3.5+ Years : The stock is emerging from a prolonged consolidation phase, which could signal the start of a new bullish trend.
Highest 52-Week Close : It recently achieved its highest close in the past 52 weeks, reflecting strong market sentiment.
Trading Near All-Time High : The price is approaching its all-time high, showing that the bullish momentum is intact.
Trading Above Weekly 50 and 200 EMA : This reinforces the positive outlook, with the stock maintaining its position above key moving averages.
Target - 870 // 990
Stoploss - weekly close below 660
DISCLAIMER -
Decisions to buy, sell, hold or trade in securities, commodities and other investments involve risk and are best made based on the advice of qualified financial professionals. Any trading in securities or other investments involves a risk of substantial losses. The practice of "Day Trading" involves particularly high risks and can cause you to lose substantial sums of money. Before undertaking any trading program, you should consult a qualified financial professional. Please consider carefully whether such trading is suitable for you in light of your financial condition and ability to bear financial risks. Under no circumstances shall we be liable for any loss or damage you or anyone else incurs as a result of any trading or investment activity that you or anyone else engages in based on any information or material you receive through TradingView or our services.
@visionary.growth.insights

Swing BTC thesis by Titan_KarmaPrediction( investment_thesis="**Market Sentiment Analysis:** The current market sentiment for BTCUSDT is cautiously bullish. Despite the absence of recent news, the financial data indicates a slight leaning towards long positions, particularly in the 4-hour and 1-hour intervals. This suggests that traders are optimistic about Bitcoin's short-term price movements. However, the lack of news necessitates vigilance for any sudden market changes. **Technical Analysis:** The technical indicators across various time frames suggest a bullish sentiment. The RSI values are neutral to slightly bullish, and the price remains above key moving averages (EMA20 and SMA20) across all time frames. The MACD indicates mild bullish momentum, especially in the 4-hour and 1-hour charts. However, the low ADX values in shorter time frames suggest weak trends, warranting caution. Key support is around $90,000, with resistance at $96,000. **Fundamental Analysis:** The fundamental outlook is stable, with no recent news impacting Bitcoin's price. The financial metrics show a strong upward trend over the past few months, with the price consolidating around $96,000. This consolidation suggests potential resistance, but the overall trend remains positive. The increase in long positions among top traders further supports a bullish outlook. **Risk Management Strategy:** Given the bullish sentiment but weak trend signals, a cautious approach is recommended. Set a stop-loss below the $90,000 support level to protect against potential downturns. A take-profit target can be set around $100,000, considering the current resistance and potential for further upside. Regularly monitor technical indicators and market news to adjust positions as needed. OUTCOME: HOLD_BUY STOP_LOSS: $89,500.00 TAKE_PROFIT: $100,000.00 CONFIDENCE LEVEL: 78% EXIT_POINT: $96,000.00 CURRENT PRICE: $96,386.84 ENTRY CRITERIA: - **TIMEFRAME**: 4h - **RSI**: below 70 - **MACD**: Bullish crossover - **MA20**: Above - **ATR**: Moderate volatility - **Bollinger Bands**: Middle band - **Stochastic Oscillator**: Neutral - **News Impact**: Neutral - **Historical Data**: Support at $90,000, Resistance at $96,000 CURRENT OPEN LONG POSITIONS: 0 CURRENT OPEN SHORT POSITIONS: 0" )

Swing ETH thesis by Titan_KarmaPrediction( investment_thesis='**Market Sentiment Analysis:** The current market sentiment for ETHUSDT is cautiously bullish. Despite the absence of recent news, the financial data indicates a strong bullish sentiment among top traders, with a high long account ratio. However, there is a slight decrease in the long account ratio and longShortRatio in the most recent 1-hour and 4-hour data, suggesting some short-term caution. This mixed sentiment calls for close monitoring of market developments. **Technical Analysis:** The technical indicators present a mixed picture. On the daily chart, the RSI and Stochastic indicators suggest slightly overbought conditions, while the MACD and ADX indicate a strong upward trend. The 4-hour chart shows a neutral RSI and a slightly negative MACD histogram, indicating potential weakening of bullish momentum. The hourly chart reflects indecision with a neutral RSI and low ADX. Key support and resistance levels are around the Pivot points and Bollinger Bands, with the daily chart suggesting a strong trend but shorter time frames indicating potential consolidation. **Fundamental Analysis:** With no recent news impacting ETHUSDT, the focus remains on financial metrics and market trends. The historical data shows a strong upward trend with significant price and volume increases, supporting a bullish outlook. However, the lack of new developments necessitates caution and readiness to adjust positions based on emerging information. **Risk Management Strategy:** Given the mixed signals, a cautious approach is recommended. Set a stop-loss at $3,500.00 to manage potential downside risks and a take-profit at $3,800.00 to capitalize on the bullish trend.
The confidence level for this trade is 78%, indicating moderate risk. Monitor key support at $3,600.00 and resistance at $3,750.00 levels closely. OUTCOME: HOLD_BUY STOP_LOSS: $3,500.00 TAKE_PROFIT: $3,800.00 CONFIDENCE LEVEL: 78% EXIT_POINT: $3,750.00 CURRENT PRICE: $3,650.00 ENTRY CRITERIA: - **TIMEFRAME**: 1d - **RSI**: above 65 - **MACD**: Bullish crossover - **MA20**: Price above MA20 - **ATR**: Moderate volatility - **Bollinger Bands**: Price near middle band - **Stochastic Oscillator**: Overbought - **News Impact**: Neutral - **Historical Data**: Support at $3,600.00, Resistance at $3,750.00 CURRENT OPEN LONG POSITIONS: 2 CURRENT OPEN SHORT POSITIONS: 1' )

Optiemus India Soon Will be 1000 Rs!Optiemus India will going to hit 1000 Rs, in this script shwoing bulish momentum in this choppy market, it will so0n going upto 1000 Rs in 1 to 2 month

Swing BTC thesis by Titan_KarmaPrediction( investment_thesis='**Market Sentiment Analysis:** The current market sentiment for Bitcoin is predominantly bullish, driven by recent price highs and positive predictions for future growth. However, the movement of Bitcoin to exchanges by short-term holders suggests potential volatility and price corrections. This mixed sentiment indicates a need for a balanced approach, considering both the bullish long-term outlook and the potential for short-term fluctuations. **Technical Analysis:** The technical indicators present a mixed picture. On the 1-day chart, the RSI is slightly overbought, and the MACD shows bearish momentum, while the ADX indicates a strong upward trend. The price is below the EMA20 and SMA20, suggesting short-term bearishness. The 4-hour chart shows bullish momentum with a positive MACD, but a weak trend as indicated by a low ADX. The 1-hour chart supports short-term bearishness with a negative MACD and low ADX. Key support is around $90,000, with resistance at $98,000. **Fundamental Analysis:** The bullish sentiment is supported by increased long positions among top traders and significant trading volume, indicating strong market interest. However, the potential for increased volatility due to short-term holders moving Bitcoin to exchanges should not be overlooked. Diversification and risk management are crucial in navigating these market conditions. **Risk Management Strategy:** Given the mixed technical signals and potential for volatility, a cautious approach is recommended. Set a stop-loss at $90,000 to protect against downside risk, and a take-profit at $98,000 to capitalize on potential upward movements. Monitor market conditions closely and adjust these levels as needed based on new data and sentiment shifts. CONFIDENCE LEVEL: 78% OUTCOME: HOLD_BUY STOP_LOSS: $90,000.00 TAKE_PROFIT: $98,000.00 EXIT_POINT: $96,000.00 CURRENT PRICE: $95,014.49 ENTRY CRITERIA: - **TIMEFRAME**: 1d - **RSI**: above 60 - **MACD**: Bearish crossover - **MA20**: Below price - **ATR**: Moderate volatility - **Bollinger Bands**: Price near upper band - **Stochastic Oscillator**: Neutral - **News Impact**: Positive - **Historical Data**: Resistance at $98,000, Support at $90,000 CURRENT OPEN LONG POSITIONS: 0 CURRENT OPEN SHORT POSITIONS: 0' )

Swing thesis with RAG AI by Titan:KarmaPrediction( investment_thesis="**Market Sentiment Analysis:** The current market sentiment for ETHUSDT is cautiously bullish. Recent news highlights significant technological advancements and venture capital interest in ETH Zurich-related projects, which could positively influence the broader sentiment towards Ethereum. Financial data indicates a strong long position among top traders, with a long-short ratio above 1, suggesting a preference for long positions. However, a recent decline in the long-short ratio and long account percentage suggests some caution is warranted. **Technical Analysis:** On the 1-day chart, ETHUSDT shows bullish momentum with a positive MACD and strong ADX, although the RSI and Stochastic Oscillator indicate slightly overbought conditions. The price is below the EMA20 and SMA20, suggesting short-term bearish sentiment. The 4-hour chart shows a neutral RSI and potential overbought conditions, with the price slightly above the EMA20 and SMA20, indicating potential short-term bullish sentiment. The 1-hour chart shows bearish momentum with a negative MACD and oversold conditions, suggesting a potential short-term rebound. **Fundamental Analysis:** Recent news about ETH Zurich's technological innovations and venture capital funding in Switzerland's tech ecosystem could positively impact Ethereum's price. The strong long position among traders and the historical upward trend in price and volume support a bullish outlook. However, the recent high volatility and potential for pullbacks necessitate careful monitoring of market conditions and news developments. **Risk Management Strategy:** Given the mixed technical signals and potential for short-term rebounds, a cautious approach is recommended. Set a stop-loss at $3,500.00 to manage downside risk and a take-profit at $3,800.00 to capitalize on potential upward movements. Monitor key support at $3,600.00 and resistance at $3,750.00 levels closely. Adjust stop-loss and take-profit levels based on market developments and technical confirmations. OUTCOME: HOLD_BUY STOP_LOSS: $3,500.00 TAKE_PROFIT: $3,800.00 CONFIDENCE LEVEL: 78% EXIT_POINT: $3,750.00 CURRENT PRICE: $3,653.27 ENTRY CRITERIA: - **TIMEFRAME**: 1h - **RSI**: below 50 - **MACD**: Bearish crossover - **MA20**: Price below - **ATR**: Moderate volatility - **Bollinger Bands**: Price near lower band - **Stochastic Oscillator**: Oversold - **News Impact**: Positive - **Historical Data**: Support at $3,600.00, Resistance at $3,750.00 CURRENT OPEN LONG POSITIONS: 3 CURRENT OPEN SHORT POSITIONS: 1" )

SWING TRADE HFCL
HFCL looks good above 152 breaking out with volumes creating higher and higher low moving in a uptrend momentum consolidating just before breakout can be good swing trade.

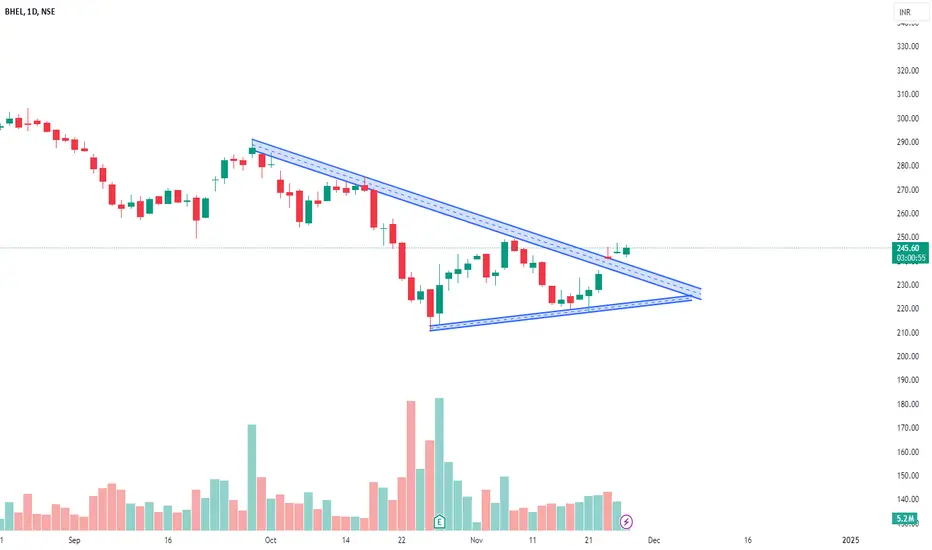
SWING TRADE- BHEL
Stock breaking out trendline after good correction can be a good reversal trade, low risk high reward potential TARGET 260 270 280 SL 232 ON CLOSING BASIS
EurUsd Just Near to TP. (Late Post)Looking for Impulse down.
EurUsd moving down on retracement. It's important to have your own rules on RR and adhere to them. This trading idea is intended to assist you and enhance your knowledge. If you have any questions, please ask me in the comments.
Learn & Earn!
Wave Trader Pro

Tilaknagar Industries upside potential 40%in this falling market Tilaknagar Industries showing bulish momentom now it can gives 30 - 40% upside potential.
