Heng Seng seeks rally from 61.8% fib level (7th time this year)This is purely observational, but today I noticed that Hang Seng futures have risen from a 61.8% Fibonacci level six times this year. And as the rallies have landed anywhere between 6.5% to nearly 50%, it is worth noting that it is trying to rally from it a seventh.
A 3-day bullish reversal pattern formed on Monday (morning star formation) and the daily RSI (2) was oversold on Friday. Bulls could seek dis back towards the 61.8% in anticipation of a leg higher to 20k or 20.5k over the near term.
MS
Swingtrading

The S&P 500 just hit me with a 'deja vous' - gains to follow?Once every so often I look at a chart and instantly get struck by a familiar pattern, which is exactly what happened today with the S&P 500 futures chart. And with asset managers firmly backing the ES1! futures market, I'm not on guard for a bounce form support. Just as long as Nvidia earnings allow.
MS.

National allmunium Upside PotentialNational allmunium more then 20% Upside Potential, add in your watchlist

EURCADHello Traders,
Here is my analysis for this pair. Please feel free to leave any questions or comments below. I'm happy to engage with you!
The entry will only be considered once all your trading rules are satisfied. I recommend adding this pair to your watchlist and monitoring it closely. If the conditions of your strategy align, then it could present a potential opportunity.
Pro Tip:
One of the best ways to improve your trading is by learning from others. Whether it's predictions, market analysis, or trade set-ups based on clear market conditions, studying ideas will help enhance your skills and refine your strategies.
Good luck and happy trading!

EURJPYHello Traders,
Here is my analysis for this pair. Please feel free to leave any questions or comments below. I'm happy to engage with you!
The entry will only be considered once all your trading rules are satisfied. I recommend adding this pair to your watchlist and monitoring it closely. If the conditions of your strategy align, then it could present a potential opportunity.
Pro Tip:
One of the best ways to improve your trading is by learning from others. Whether it's predictions, market analysis, or trade set-ups based on clear market conditions, studying ideas will help enhance your skills and refine your strategies.
Good luck and happy trading!

70% Pump On The Horizon (:Massive Upside Potential.
Lows of the range has been swept. Next challenge is to break the trendline and continue upwards.
Calculate Your Risk/Reward so you don't lose more than 1% of your account per trade.
Every day the charts provide new information. You have to adjust or get REKT.
Love it or hate it, hit that thumbs up and share your thoughts below!
This is not financial advice. This is for educational purposes only.

CHFJPY / SHORTHello Traders,
Here is my analysis for this pair. Please feel free to leave any questions or comments below. I'm happy to engage with you!
The entry will only be considered once all your trading rules are satisfied. I recommend adding this pair to your watchlist and monitoring it closely. If the conditions of your strategy align, then it could present a potential opportunity.
Pro Tip:
One of the best ways to improve your trading is to learn from others. Whether it's predictions, market analysis, or trade set-ups based on clear market conditions, studying well-thought-out ideas from fellow traders can greatly enhance your skills and decision-making process.
Good luck and happy trading!

Trade Review - LUNR
When found in the screener, the stock showed a decent continuation pattern on the weekly chart. It was added to the watchlist to track a potential move, still were some distance to prior swing high.
Execution Chart.
Trade Overview
• Structure: Bullish Continuation
• Position: Near Mean
• Entry Trigger: Range Expansion
Entry Details
• Entry Price: 9.38
• Stop Price: 8.30
• Target Price: 12.36
• Expected Risk/Reward: 2.65 R
Exit Strategy
• Exit Price: Closed 50% into 1R and rest at 12.18.

Short Setup US30USD, Swing Trade#MarketUpdate #US30USD
📢The Low of yesterday stopped at the Fib. 0.382 of the Daily Chart.
There was a accumulation on this Fib. level.
🔔If London Session breakout to downside, possible target the next Fib. levels below.

United Spirits Ltd. (NSE: MCDOWELL-N) - Technical AnalysisKey Observations:
1️⃣ Bullish RSI Divergence:
The RSI indicates a bullish divergence, suggesting potential reversal or upside momentum.
2️⃣ Breakout from Descending Channel:
After a period of consolidation within the descending channel, the stock has broken out, supported by improving momentum.
3️⃣ Volume Profile Support:
Strong accumulation zone observed between ₹1,440-₹1,490, indicating demand at these levels.
4️⃣ Fibonacci Levels:
Resistance levels are identified at ₹1,491, ₹1,541, ₹1,591, and ₹1,634 based on Fibonacci retracements.
5️⃣ Moving Averages:
The stock is trading above key short-term moving averages, reinforcing the positive trend.
Trading Strategy:
🚀 For Long Positions:
Entry Zone: ₹1,440–₹1,460 (if price sustains above breakout level).
Targets: ₹1,491, ₹1,541, ₹1,591.
S top-Loss: ₹1,430 (below support zone).
⚠️ Risk Management:
If the stock re-enters the descending channel, it could invalidate the bullish outlook. Monitor price action and volume closely.
Outlook:
With the RSI divergence, breakout confirmation, and strong support at ₹1,440, United Spirits Ltd. presents a promising bullish setup for short- to medium-term gains. Watch for sustained volume as the price approaches resistance levels.
💬 Your Thoughts?
What’s your take on this setup? Share your views below! 🚀

Breakout leap for AFRM?🔉Sound on!🔉
Thank you as always for watching my videos. I hope that you learned something very educational! Please feel free to like, share, and comment on this post. Remember only risk what you are willing to lose. Trading is very risky but it can change your life!

CHFJPY SHORTLooking for shorts on CHFJPY from the supply zone above. It's pretty far away so it will probably take a few days to get there but then I'll just be looking for a lower timeframe trend change to get entries.

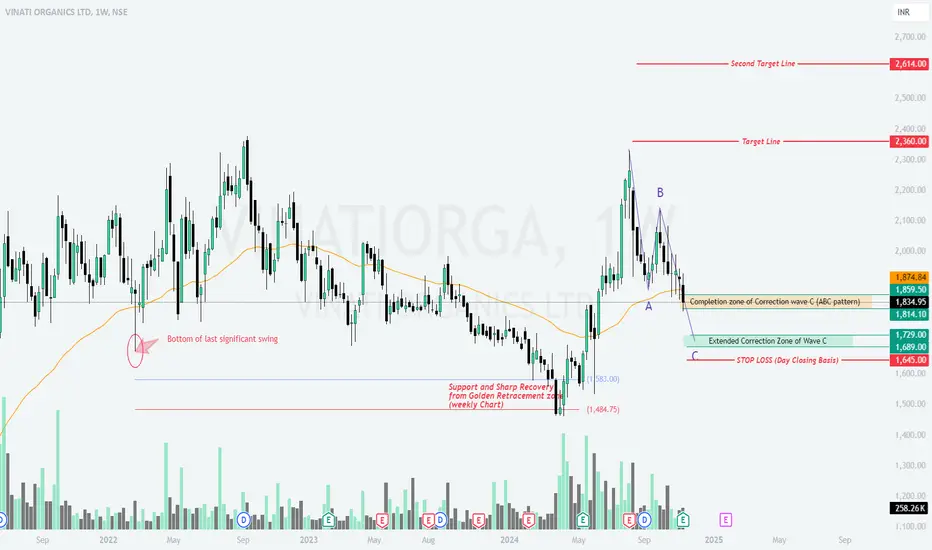
VINATIOR - ABC Correction Near Completion (weekly)Vinati Organics Ltd – Weekly Chart Analysis
1. Current Correction and Support Zone
The price has completed the ABC corrective structure with wave C nearing its completion in the Extended Correction Zone (₹1,729-₹1,689) .
The current price (₹1,834.95) is hovering near the completion zone of wave C , and a sharp recovery is anticipated if support holds.
2. Key Levels and Trading Plan
b Bullish Scenario
Sustained buying from the current levels or the demand zone (₹1,729-₹1,689) could lead to a recovery toward the following target zones:
Target 1: ₹2,360
Target 2: ₹2,614
b Bearish Scenario
A break below ₹1,645 (on a day closing basis) could invalidate the bullish setup, with potential downside to lower levels.
3. Observations and Indicators
Support at Golden Retracement Zone: The stock had shown sharp recoveries in the past from the 61.8% Fibonacci retracement levels, as seen in earlier price movements on the weekly timeframe.
Volume Analysis: A noticeable increase in volume during previous support testing phases indicates buyer interest around key levels.
4. Key Risks
A failure to hold the current correction zone could push the stock toward lower levels. Watch for macroeconomic factors or company-specific news that might impact sentiment.
📈 What’s Your Take on the Setup?
Are we heading toward the targets, or will bears take over? Share your insights in the comments! 🚀📉
WEATH : Recovery ahead?Wealth First Portfolio Management Ltd – Daily Chart Analysis
1. Golden Extension Zone (113%-127%) Reaction
The price reversed after reaching the Golden Extension Zone near ₹1,693.80. This zone acted as a strong resistance, pushing the price down into a key Demand Zone (₹1,355-₹1,331) .
2. Corrective Structure and Support
The price appears to follow an ABC corrective wave pattern , with wave C nearing completion around ₹1,395.20.
Initial support has been observed in the Demand Zone , suggesting potential for a reversal.
3. Trading Plan and Key Levels
b Bullish Scenario
If the price sustains above ₹1,355, it could rally toward the Golden Retracement Zone at ₹1,666-₹1,710.
Key Levels:
Target 1: ₹1,666.60
Target 2: ₹1,710
b Bearish Scenario
A break below ₹1,319 (day close basis) may trigger further downside to the next Demand Zone at ₹1,127-₹1,155 .
Stop Loss: ₹1,319 (day close basis).
4. Observations and Indicators
Volume: Higher volume near the current Demand Zone hints at potential institutional buying.
Moving Averages: The price is trading below the short-term MA, indicating caution until a confirmed reversal.
5. Macro Considerations
Sector-related news or market-wide movements may act as catalysts for either direction. Monitor updates closely.
📈 Share Your Views Below!
Does this setup align with your strategy? 🚀📉

RTNINDIAHi guys,
In this chart i Found a Demand Zone in RTNINIDA CHART for Positional entry,
Observed these Levels based on price action and Demand & Supply.
*Don't Take any trades based on this Picture.
... because this chart is for educational purpose only not for Buy or Sell Recommendation..
Thank you

Watchlist - Nov 17, 2024Here’s my weekend watchlist from the passive screener. The list is short, as many stocks have already made their swing moves higher. Both the market and some stocks show temporary indication of exhaustion, so it might be a good idea to be selective.
Bullish List: PLCE
Bearish List: UPST, SMLR, AMSC

SIGACHIHi guys,
In this chart i Found a Demand Zone in SIGACHI CHART for Positional entry,
Observed these Levels based on price action and Demand & Supply.
*Don't Take any trades based on this Picture.
... because this chart is for educational purpose only not for Buy or Sell Recommendation..
Thank you

Bearish Signals: Time to Short ADAUSDAs I prepare to share my bearish trade idea for ADAUSD, here are key trends that support my outlook:
- Market Sentiment: Cardano (ADA) has faced a significant downturn, losing nearly 13% this week and about 41% year-to-date. This reflects growing concerns among investors and a lack of bullish momentum.
- Technical Indicators: A bearish divergence between ADA's price and daily active addresses suggests weakening demand, indicating potential further declines.
- Price Action: ADA is trading below crucial moving averages (20-day and 50-day), trapped in a declining channel. This reinforces the bearish sentiment as it approaches the lower boundary.
In my trading strategy, I focus on probabilities to position myself for short trades on ADAUSD.
In summary, by leveraging probabilities alongside market trends, I aim to strategically position myself for potential declines in ADAUSD.
This disciplined approach not only enhances my trading strategy but also aligns perfectly with the current bearish environment.
Join me as we navigate this market together!
P.S. If you have any questions about how I trade probabilities with the overall market direction, feel free to reach out.
4H:https://www.tradingview.com/x/IFRT8mYP/

GBPUSD ShortLooking to potentially short GBPUSD from the supply zone above. Gonna be waiting for a lower timeframe CHOCH when price taps in and will look to ride it out to the equal structure lows

GBPUSD Swingers! Let's keep it simple.
A reversal is often needed for the trend to keep going. But, it's not a sure thing. However, the odds are in our favor. If not, the trend might break, leading to a new one.
So, who's ready to catch the next big wave? Let's wait for the setup to form. Don't rush. Let the price action tell us what to do. It's that easy!
PS: THERE IS NO LONG CONFIRMATION RECEIVED YET.

SWING IDEA - CLEAN SCIENCE AND TECHClean Science and Technology , a prominent player in the specialty chemicals sector, is exhibiting strong technical signals that suggest a potential swing trading opportunity.
Reasons are listed below :
1550-1600 Resistance Zone Broken : The price has successfully broken through the 1550-1600 resistance zone, indicating strong bullish momentum and potential for further upside.
Break of 1.5+ Year Consolidation : The stock has broken out of a prolonged consolidation phase of over 1.5 years, signaling a new bullish trend and increased investor interest.
50 EMA Support on Weekly Timeframe : The stock is finding solid support at the 50-week exponential moving average, reinforcing the overall bullish sentiment and providing a reliable support level.
Volume Spike : A noticeable increase in trading volumes confirms the strength of the price move, indicating strong investor interest and participation in the current trend.
Target - 1960 // 2150
Stoploss - weekly close below 1425
DISCLAIMER -
Decisions to buy, sell, hold or trade in securities, commodities and other investments involve risk and are best made based on the advice of qualified financial professionals. Any trading in securities or other investments involves a risk of substantial losses. The practice of "Day Trading" involves particularly high risks and can cause you to lose substantial sums of money. Before undertaking any trading program, you should consult a qualified financial professional. Please consider carefully whether such trading is suitable for you in light of your financial condition and ability to bear financial risks. Under no circumstances shall we be liable for any loss or damage you or anyone else incurs as a result of any trading or investment activity that you or anyone else engages in based on any information or material you receive through TradingView or our services.
@visionary.growth.insights

GBPJPY: Bearish Outlook Explained 🇬🇧🇯🇵
GBPJPY dropped heavily on Friday.
The price violated both a support line of a rising parallel channel
and a horizontal demand zone.
With a high probability, the price will continue falling next week.
Next support - 193.9
❤️Please, support my work with like, thank you!❤️

NZDCAD shortsPrice already tapped into supply so I’m now just waiting for a lower timeframe CHOCH or some kind of entry sign
