GBP/JPY Bears Eye Drop to 195GBP/JPY closed lower for a third day on Wednesday, with bearish momentum increasing thanks to political tensions in the UK and dovish comments from BOE voting members.
While the daily RSI (2) is oversold, there could still be room for a move to 195 over the near term. Its less than a day’s trading range away using recent volatility levels, and it also sits near the bullish trendline from the May low.
The 1-hour chart shows prices are drifting higher in an apparent corrective fashion, yet prices remain in the lower third of Wednesday’s range. I suspect bears will seek to fade into any pops higher in anticipation of another drop towards 195, near the daily S1 pivot, weekly S and rising trendline.
Should GBP/JPY drop to the lower target area, how prices react could provide clues over its potential to use the level as a springboard or break lower from that pivotal zone.
Market Analyst at City Index and Forex.com
Swingtrading

Swing Pick +92% in 2 days $1.06 to $2.04Buy message on Friday before market close at $1.06 reaching $2.04 just 2 days later for +92% upside.
Trade had tight stop loss at $0.90 while going for at least +50% gain
NASDAQ:VOR
Review and plan for 3rd July 2025 Nifty future and banknifty future analysis and intraday plan.
Swing ideas.
This video is for information/education purpose only. you are 100% responsible for any actions you take by reading/viewing this post.
please consult your financial advisor before taking any action.
----Vinaykumar hiremath, CMT

“Accumulation, Breakout, Repeat: SBSW’s Time Again?” SBSW | Weekly Chart Analysis
4-Year Cycle | Smart Money Levels | Precious Metals Macro Tailwind
This chart paints a clear picture — Sibanye-Stillwater (SBSW) has followed a reliable 4-year accumulation-to-expansion cycle:
🔹 2015–2016
🔹 2019–2021
🔹 Now shaping up for 2025–2026
Each rally kicked off after institutional accumulation around the $3 level, and once again, we’re seeing the same behavior. History doesn’t just rhyme — it repeats.
🧠 Smart Money Moves
Every major cycle began after price based out near the $3 level. That’s exactly what we’ve just seen — accumulation, basing, and now lift-off. We’ve entered a familiar pattern — the same smart money footprints showing up again.
📊 Technical Breakdown
This is the weekly chart, and we’re now testing the 0.236 Fibonacci retracement level (7.39) drawn from the 2020 high to the recent low.
✅ A weekly close above this level + structure building could confirm the beginning of a long-term leg higher.
📈 Volume Flow Indicator has crossed above the midline for the first time in years, suggesting that real buying pressure is back. That’s a shift in momentum worth noting.
🎯 Key Areas of Interest:
• $10.00 – Volume node + prior S/R
• $12.00 – Fib midpoint + prior pivot
• $14.90 – Confluence zone
These are zones where I’ll be watching for continuation, reaction, or reversal.
🌎 Macro Tailwind: Precious Metals Demand
Platinum and palladium are gaining renewed attention as demand increases in EVs, clean energy, and industrial sectors. SBSW — with its deep exposure to both metals — is positioned as a long-term beneficiary if this trend continues.
Add to that the recent global instability and de-dollarization chatter, and you’ve got a macro backdrop favoring real assets over paper. Precious metals are catching a bid — and SBSW could ride that wave.
🧠 My Position
Started buying $4.00 calls and recently rolled to $5.50s. I’m letting this one develop over time — watching for confirmation and continuation.
(Not financial advice — just sharing my perspective as always.)
🕰️ Cycles matter.
📚 History teaches.
💰 Smart money accumulates before the breakout.
This setup has all the hallmarks of a repeat cycle in progress. I’m locked in.
—
📍 Long-term chartwork, weekly timeframe. Zoom out to see the rhythm.
SBSW | Weekly Chart Analysis
4-Year Cycle | Smart Money Levels | Precious Metals Macro Tailwind
This chart paints a clear picture — Sibanye-Stillwater (SBSW) has followed a reliable 4-year accumulation-to-expansion cycle:
🔹 2015–2016
🔹 2019–2021
🔹 Now shaping up for 2025–2026
Each rally kicked off after institutional accumulation around the $3 level, and once again, we’re seeing the same behavior. History doesn’t just rhyme — it repeats.
🧠 Smart Money Moves
Every major cycle began after price based out near the $3 level. That’s exactly what we’ve just seen — accumulation, basing, and now lift-off. We’ve entered a familiar pattern — the same smart money footprints showing up again.
📊 Technical Breakdown
This is the weekly chart, and we’re now testing the 0.236 Fibonacci retracement level (7.39) drawn from the 2020 high to the recent low.
✅ A weekly close above this level + structure building could confirm the beginning of a long-term leg higher.
📈 Volume Flow Indicator has crossed above the midline for the first time in years, suggesting that real buying pressure is back. That’s a shift in momentum worth noting.
🎯 Key Areas of Interest:
• $10.00 – Volume node + prior S/R
• $12.00 – Fib midpoint + prior pivot
• $14.90 – Confluence zone
These are zones where I’ll be watching for continuation, reaction, or reversal.
🌎 Macro Tailwind: Precious Metals Demand
Platinum and palladium are gaining renewed attention as demand increases in EVs, clean energy, and industrial sectors. SBSW — with its deep exposure to both metals — is positioned as a long-term beneficiary if this trend continues.
Add to that the recent global instability and de-dollarization chatter, and you’ve got a macro backdrop favoring real assets over paper. Precious metals are catching a bid — and SBSW could ride that wave.
🧠 My Position
Started buying $4.00 calls and recently rolled to $5.50s. I’m letting this one develop over time — watching for confirmation and continuation.
(Not financial advice — just sharing my perspective as always.)
🕰️ Cycles matter.
📚 History teaches.
💰 Smart money accumulates before the breakout.
This setup has all the hallmarks of a repeat cycle in progress. I’m locked in.
📍 Long-term chartwork, weekly timeframe. Zoom out to see the rhythm.
🛑 Invalidation below $5.50 — no structure, no conviction, I’m out.
If SBSW breaks back below the $5.50 level with high volume and fails to reclaim it quickly, that would invalidate the current breakout structure and suggest this move was a false start. I'd reassess the cycle thesis if we revisit the $4 range with no buyer defense.
Please feel free to comment and let me your opinion

Mount Fuji Series- Old runners waking upMount Fuji Series- Old runners waking up -
TARC - started running after 50-70 levels.. hope getting ready again.
Realty company with good land holding. Funda strong company.

Swing Trade Plan: MAN Industries (NSE: MANINDS)
A classic Cup & Handle Pattern bullish continuation pattern showing accumulation and a breakout from resistance. Indicates renewed buying interest.
Breakout supported by rising volume, confirming buyer strength.
Price holding above 20 and 50 EMA, indicating bullish trend continuation.
Company has consistent order inflows and is part of infra/pipe supply chain, aligning with current government spending themes.
This is my personal swing trade plan based on price action and fundamental analysis. Please do your own research before taking any investment decision.

Ethereum - This structure decides everything!Ethereum - CRYPTO:ETHUSD - trades at a key structure:
(click chart above to see the in depth analysis👆🏻)
After Ethereum retested the previous all time high in the end of 2024, we saw quite a harsh move lower. This move was followed by an expected recovery, however Ethereum is still trading below a key structure. Either move is still possible and will shape the future of Ethereum.
Levels to watch: $2.500, $4.000
Keep your long term vision!
Philip (BasicTrading)

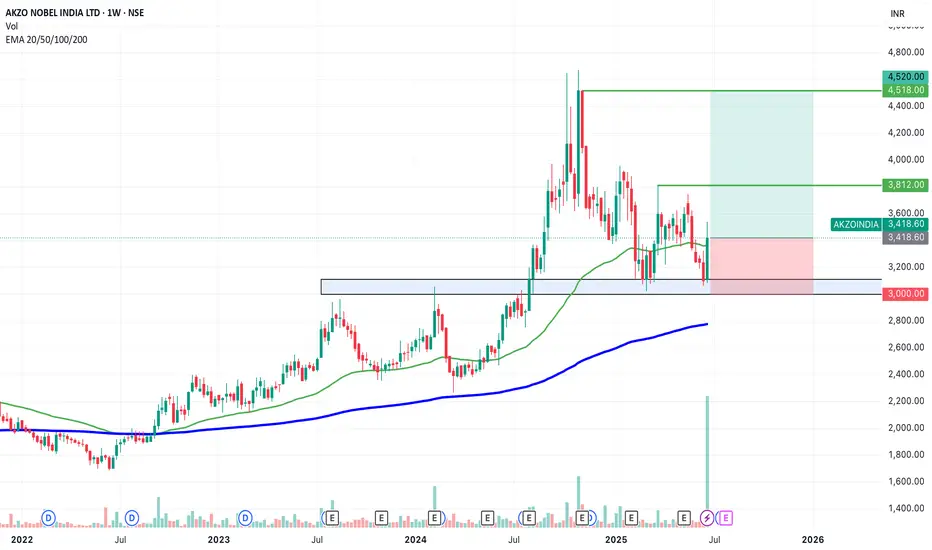
SWING IDEA - AKZO NOBEL INDIA Akzo Nobel India , a subsidiary of the global paints and coatings giant AkzoNobel N.V., is a leading player in India’s decorative and industrial paints market. Known for its premium brand Dulux , the company has strong brand recall, a wide distribution network, and consistent profitability.A strong brand, steady margins, and a bullish chart make this a candidate to watch for a short- to medium-term swing trade.
Reasons are listed below :
Bullish engulfing candle spotted on the weekly timeframe, signaling a potential trend reversal.
Accompanied by the highest-ever volume spike, adding strong conviction to the move.
Price is bouncing off the golden Fibonacci support (0.618), a classic retracement zone where strong reversals often occur.
The level of 3100 acted as a solid support.
The stock is trading above its 50 & 200 EMA on the weekly chart — a sign of long-term strength.
Target - 3812 // 4520
Stoploss - weekly close below 3000
DISCLAIMER -
Decisions to buy, sell, hold or trade in securities, commodities and other investments involve risk and are best made based on the advice of qualified financial professionals. Any trading in securities or other investments involves a risk of substantial losses. The practice of "Day Trading" involves particularly high risks and can cause you to lose substantial sums of money. Before undertaking any trading program, you should consult a qualified financial professional. Please consider carefully whether such trading is suitable for you in light of your financial condition and ability to bear financial risks. Under no circumstances shall we be liable for any loss or damage you or anyone else incurs as a result of any trading or investment activity that you or anyone else engages in based on any information or material you receive through TradingView or our services.
@visionary.growth.insights
Everybody loves Gold Part 6Great week in Part 5.
Starting this week with a strong bias towards the upside.
Here's a breakdown of trading dynamics:
1. Expecting price to break past green line, level of significance (LOS) for continuation up
2. Price might bounce back for which; will be looking for a continuation from -50/-100 or -150pips to the upside
3. Will be looking for double tops/bottom along the way
As always price action determines trades

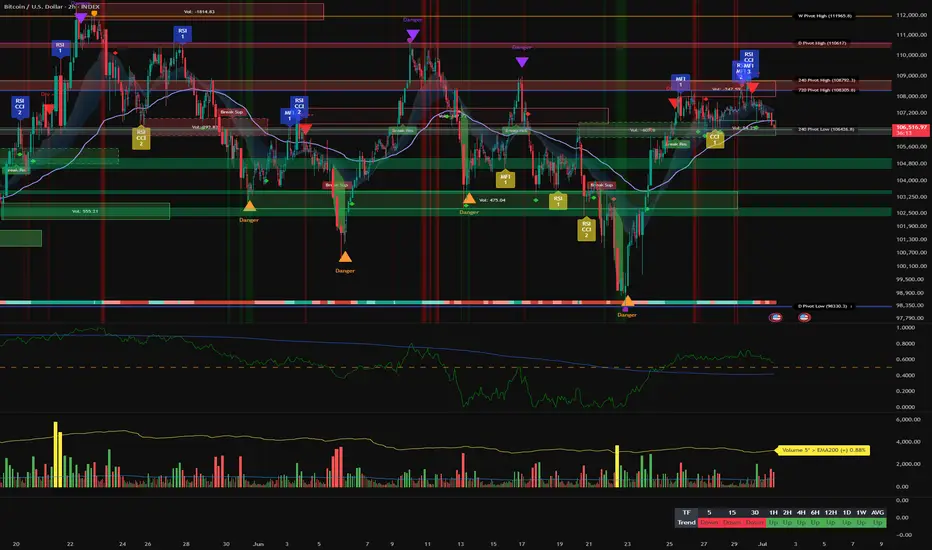
Critical Range 106,036–108,300, Sector Support Remains Bullish__________________________________________________________________________________
Technical Overview – Summary Points
__________________________________________________________________________________
Momentum: Bullish across all timeframes ≥1H (MTFTI UP); corrective compression seen on 15m/30m as short-term selling momentum decelerates.
Support/resistance: Major defensive cluster at 106,036–106,210; multiple resistances at 108,272/108,790 and 110,530–111,980. No excesses or validated breakdowns.
Volume: Historical average across all timeframes, no abnormal flows, no signs of euphoria.
Risk On / Risk Off Indicator: "Strong Buy" signal on all timeframes except 15m (neutral); sector momentum confirmed, software leadership maintained.
Investor behavior (ISPD DIV): Mostly neutral except for a micro-buy on 15m, no extremes of fear or euphoria.
__________________________________________________________________________________
Summary
__________________________________________________________________________________
Global bias: Remains bullish in the medium term, mature range, no imminent trigger catalysts.
Opportunities: Technical bounce/entry favored on 106,036–106,210 if support cluster holds and ISPD DIV validated. Conservative profit-taking below 108,000–108,300.
Risk areas: Confirmed breakdown (1H/4H close <106,036 with high volume and MTFTI reversal). Recommended stop <105,900.
Macro catalysts: Awaiting US data (PMI/ISM/JOLTS). Watch for macro surprises or FOMC. Low expected volatility until late July.
Action plan: Range-buy near support cluster, active stop/profit management, volume watch, confirm with intraday micro-signals.
__________________________________________________________________________________
Multi-Timeframe Analysis
__________________________________________________________________________________
1D: Consolidating below major resistance >110k. Momentum and Risk On / Risk Off Indicator solid. No volume catalysts.
12H–4H: Bullish structure preserved, compression under resistance, supports holding (106k–106.5k), average volume.
2H–1H: Compression, repeated tests of 106,036 support, buying appears at each rebound; no clear selling continuation.
30min–15min: Technical correction, micro-bearish divergence on Risk On / Risk Off Indicator, but ISPD DIV buy marker on 106,036–106,210 cluster. Stable volume.
Summary: All ≥1H timeframes are bullish; 15m/30m show corrective compression in a mature, defended range.
Strategic Outlook:
- BTCUSDT continues to consolidate in a mature range with a multi-frequency support cluster at 106,036–106,210.
- Broadly UP trend, robust Risk On / Risk Off Indicator, no exogenous catalysts.
- Opportunity zone on cluster support test; confirm any bounce with returning flows or 15m behavioral signal.
- Key stop <105,900, progressive profit-taking below 108,000–108,300.
- Macro watch (PMI, ISM, FOMC) essential to anticipate volatility pickup or trend change.
On-chain / Macro: No short-term systemic risks. General wait-and-see, no stress or euphoria. Consolidative setup.
Risk / Reward: Adjust leverage and strict risk control; ratio ≥3:1 maintained as long as cluster support holds.
Recommended management: No chasing, favor range-buy approaches, dynamic stops, and gradual profit-taking on resistance.
__________________________________________________________________________________
AAPL Significant Event NASDAQ:AAPL
1. Bullish Breakout :
In the daily chart bullish breakout has been seen. If the bullish momentum is strong, the price may follow the upward.
2. Target Price : Potential target price 214
3. Risk Factors:
A. Failure to breakout the resistance 206
B. Sideways trend may be started.
C. Broader market weakness or correction
D. False Breakouts
---------------------
Note :
If you’re interested in receiving detailed technical analysis reports on your selected stocks, feel free to reach out to me. I can provide you with customized reports covering trends, key levels, momentum, patterns, and price projections to support your trading or investment decisions.

Xrp - The expected rally of +50%!Xrp - CRYPTO:XRPUSD - is still clearly bullish:
(click chart above to see the in depth analysis👆🏻)
Ever since Xrp rallied more than +550% in the end of 2024, we have been witnessing a quite expected consolidation. However Xrp still remains rather bullish and can easily retest the previous all time highs again. Maybe, we will even see another parabolic triangle breakout.
Levels to watch: $3.0, $10.0
Keep your long term vision!
Philip (BasicTrading)

EAND – Gaining Momentum for the Next MoveEtisalat Group appears to have bottomed, establishing a key accumulation range between 15.74–18.58 AED. Price is currently playing within this range, building a solid base after a prolonged downtrend.
If Etisalat breaks above the 18.58 AED resistance with strong volume and follow-through, it opens the door to a clean upside move toward the next key levels:
T1: 20.14 AED
T2: 22.24 AED
T3: 25.88 AED
T4: 28.70 AED
The structure is tight and range-bound, but the market sentiment shows early signs of strength. A breakout from this base would confirm a shift in trend and could trigger a mid- to long-term bullish leg.
📌 Risk management: The 15.74 AED level serves as the invalidation zone. As long as price holds above it, bulls remain in control of the setup.

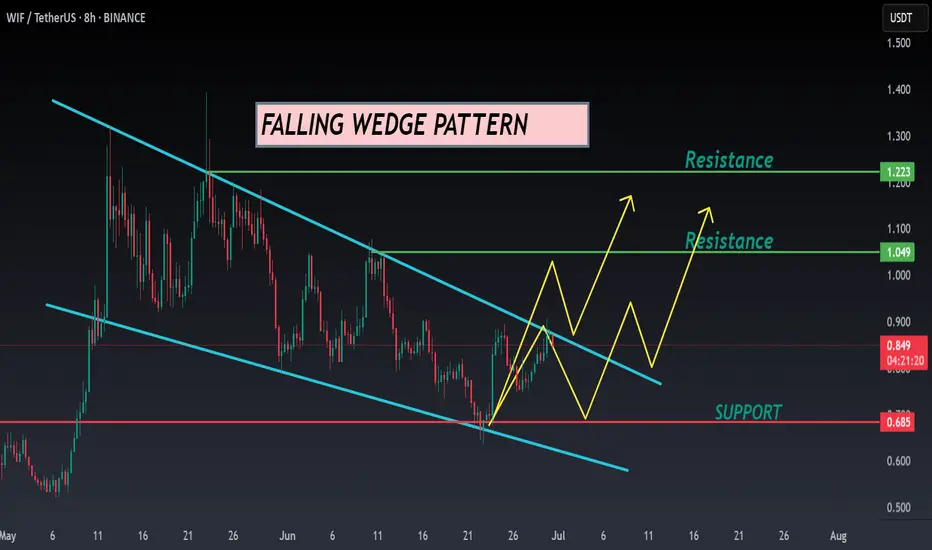
WIF ANALYSIS🔮 #WIF Analysis - Update 🚀🚀
💲 We can see that there is a formation of Falling Wedge Wedge Pattern in #WIF and we can see a bullish movement after a good breakout. Before that we would see a little retest and and then a bullish movement.
💸Current Price -- $0.848
📈Target Price -- $1.049
⁉️ What to do?
- We have marked crucial levels in the chart . We can trade according to the chart and make some profits. 🚀💸
#WIF #Cryptocurrency #Breakout #DYOR
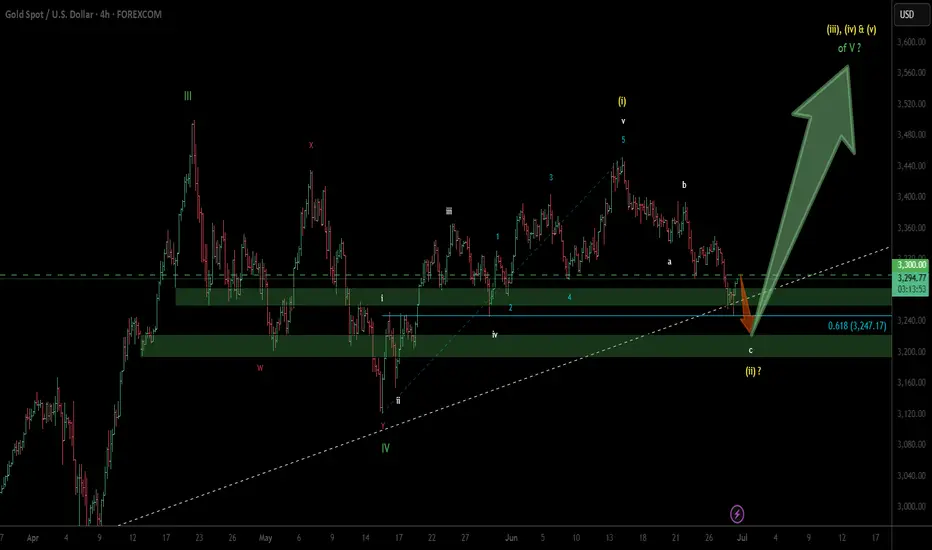
GOLD - next wave up soon...Updated Wave Count... still holding long...
Wave (ii) in yellow is possibly nearing completion.
3200 should limit any move to the downside.
previous wave count...
Market BreadthMarkets are still in 'Bull' mode going into the 4th. Keeping a eye on the 9-EMA which I use as a trailing stop on my long positions. Not likely to pick up any new positions for now.

XAUUSD 4hour TF - June 29th, 2025XAUUSD 4hour Neutral Idea
Monthly - Bullish
Weekly - Bullish
Daily - Bullish
4hour - Bearish
Gold has been on the rally of a century for a while and isn’t showing too many signs of slowing down long term. For now we do have a couple opportunities I can bring to your attention.
4hour bearish continuation - For this to happen we would like to see price action come back to our pocket of confluence near the 3,320.000 level followed by bearish conviction. If this happens look to target lower toward major support levels like 3,225.500.
4hour trend reversal - If we are to see a reversal of the 4hour trend we would need to see price action pop back above the 3,320.000 resistance area. Look for strong bullish conviction above this level and target higher toward appropriate levels of resistance.

EURJPY 4hour TF - June 29th, 2025EURJPY 4hour Bullish Idea
Monthly - Bullish
Weekly - Bullish
Daily - Bullish
4hour - Bullish
EJ has been in a bullish trend on all timeframes and doesn’t really show any signs of stopping. Currently we are right near major monthly resistance around 171.000. It is likely we will see price action push into this zone but we want to identify a potential trade beforehand.
Here are two potential scenarios for this week on EJ
Bullish Continuation - We are a bit close to the 171.000 monthly zone so we would like to see price action come back to our 168.500 4hour support zone before targeting higher.
Trend Reversal - If we see price action fall below 168.500 we want to see bearish conviction and rejection from that same zone. If this happens we can start to consider short scenarios and target lower support levels like 166.250.

USDJPY Daily TF - June 29th, 2025USDJPY Daily Neutral Idea
Monthly - Bullish
Weekly - Bearish
Daily - Bearish
I’m looking at the Daily time frame here as this is the only clear picture for price action in terms of trends. The 4hour looks like price action can’t make a decision so we will wait for price action to get closer to some major zones.
Bearish Continuation - Ideally, we want to see price action touch 147.500 again followed by convincing bearish rejection. Look to target lower toward major support levels if this happens.
Aside from this potential setup we don’t have much to look at here on UJ.

XAUUSD 4H Analysis – Possible Break Below Key StructureStructure Overview:
After printing a multi-month high around 3,473, price has formed a clear rounded top followed by lower highs, showing weakening bullish momentum. Gold is now retesting a key structure zone near 3,270–3,275, which has acted as previous support several times.
📉 Key Technical Observations:
Trend: Short-term bearish within a broader consolidation
Support Zone: 3,270–3,250 (watch closely for a break)
Resistance Levels:
Minor: 3,340
Major: 3,390–3,400
📊 Scenario Outlook
🔻 Bearish Bias (Preferred Scenario)
If price closes below 3,270, expect:
Initial target: 3,210–3,220 zone (clean imbalance + previous resistance)
Secondary target: 3,130–3,150 (March structure break zone)
This would confirm a transition into a mid-term bearish leg unless a fakeout occurs.
🔺 Bullish Recovery (Alternative Scenario)
If price reclaims 3,305 with strength:
A move back toward 3,340–3,360 is possible
Needs volume + momentum confirmation, ideally with a bullish engulfing candle
⚠️ What to Watch
Daily candle close relative to 3,270
Reaction at 3,250–3,260 demand zone
Gold often sweeps key lows before reversing — watch for liquidity grab wicks
📌 Conclusion
Gold is sitting at a critical level — a confirmed close below 3,270 could open the doors for a deeper retracement toward March’s breakout levels. Until then, this remains a watch and react environment. Avoid chasing.

HYPE — How to Combine Fibonacci, VWAP and Market StructureAfter an explosive +392% rally in just 70 days — from $9.298 to a peak of $45.8 — HYPE has entered a consolidation range as expected. Structurally, this appears to be a 5-wave impulse now transitioning into a corrective ABC pattern. Based on current structure, we may now be forming wave B.
What’s Unfolding Now?
A potential Head & Shoulders pattern is developing, with price currently working on the right shoulder. The $40 mark stands out as a key resistance — both technically and psychologically:
0.618 Fibonacci retracement of the down move sits at $40.108
Structural resistance from prior highs
Ideal area for a short rejection
🎯 Short Setup:
Entry: Laddered short between 0.618 ($40.108) and 0.786 ($42.611)
Stop-Loss: Above $44 (after rejection adjust to entry)
Target: $28–$27 zone
R:R potential: 1:3 up to 1:9 depending on entry quality
📍 Why $28–$27 Is Key Support:
0.5 Fibonacci retracement of entire +392% rally sits at $27.549
Anchored VWAP from the rally origin ($9.298) aligns around this zone
Weekly & Monthly S/R convergence
VAH (Value Area High)
0.618 Fibonacci Speed Fan also aligns as dynamic support
Fair Value Gap (FVG) lies in this region
Weekly 21 EMA at $28.05/Weekly 21 SMA at $24.10 — both key moving averages providing layered support and trend structure
📐 Bonus Confluence Insight:
If this is indeed wave B, then projecting a 0.786/1.0 Trend-Based Fib Extension from wave A aligns well with the 0.5 fib retracement at $27.5.
📚 Educational Insight:
Stacking confluences such as Fibonacci retracements, anchored VWAPs, volume zones, EMA/SMA levels, and harmonic structures helps identify high-probability zones where smart money is likely to act. These levels become even more powerful when they align across multiple tools and timeframes. Always confirm with price action.
_________________________________
💬 If you found this helpful, drop a like and comment!
Want breakdowns of other charts? Leave your requests below.


BANCOINDIA - Earnings Gap up (EP)
- Strong prior buying force
- Narrow range consolidation near ATH
- Volume dry up
- Small SL , High R:R
