TRANSRAILL : Swing Trading (1-3 Months)#TRANSRAILL #patterntrading #cupandhandlepattern #breakoutstock #chartpatterntrading #IPOstock
TRANSRAILL : Swing Trading
>> Cup & Handle pattern
>> Breakout + Retest done
>> Trending stock Setup
>> Good Strength & Volumes picking up
Swing Traders can lock profit at 10% and keep trailing
Pls Boost, comment & Follow for more Analysis
Disc : Charts Shared are for Learning Purpose & not a Trade recommendation. Pls consult a SEBI Registered Advisor before taking position in it
Swingtradingsetup

#DOGEUSDT: Swing Trade Targeting $0.50| Swing Trade| Setupsfx_|Hey there! Everyone
DOGEUSDT is at a turning point right now, and it looks like it might just reverse course and head towards its target price of $0.50. This is a swing trade, which means it could take a few weeks, or even months, to complete.
We’d really appreciate your support.
Thanks
Team Setupsfx_

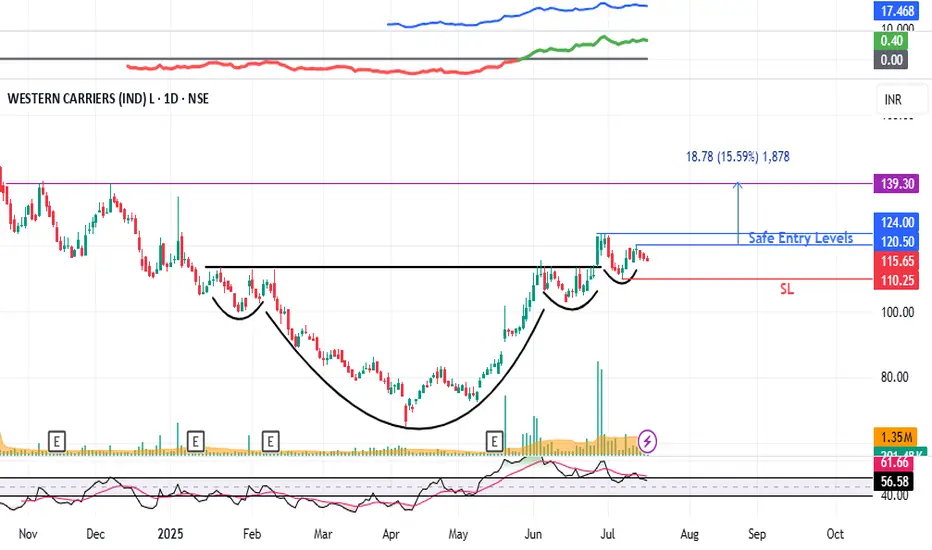
Western Carriers (WCIL) : Breakout Candidate#WCIL #patterntrading #breakout #breakoutstock #inverseheadandshoulder #swingtrading
WCIL : Swing Trade
>> Low PE Stock
>> Inverse Head & Shoulder pattern visible
>> Breakout & Retest Done
>> Ready for New Highs
>> Low Risk High Reward Trade
Swing Traders can lock profits at 10% & Keep Trailing
Pls Comment , Boost and Follow for more such Analysis
Disc : Charts shared are for Learning Purpose and not a Trade recommendation, Consult your Financial afvisor or a SEBI Registered Advisor before taking postion in it.
$1 to $2.70 Swing Pick +150% gain so far in a weekHere is updated chart from what I shared with you past week on NASDAQ:VOR
Awesome runner!

GOLD[XAUUSD]: Breakthrough the bearish pressure, What next?Evening Everyone,
Hope you are doing great, price recently breakthrough the current price inducement, showing a strong bullish volume emerging in the market. Long term approach remain bullish ultimately taking the price towards the new high.
Good luck
Team Setupsfx_

"Crypto Charts Whisper—Are You Listening?"As I’ve mentioned before, the market is manipulated. In a previously published idea, “VSA vs BTC: Into a Bearish Scenario or Not?”, this manipulation becomes obvious. The big players—whales, institutions, banks—are deliberately engineering traps to absorb liquidity from uninformed retail traders, boosting their profits and power.
Some informed retail traders like you and me understand that behind these entities are teams of insiders and highly trained traders operating around the clock—24/7, 365 days a year. That’s what it takes to survive in such a demanding environment.
This is especially true in the crypto market, which—despite its explosive growth—is still a baby in terms of total market cap. That’s why price fluctuations are so extreme, whether it’s Bitcoin, Ethereum, or altcoins.
Many of you who have been in the space since the early days already know: Bitcoin is the king. As the first coin built on cryptography, Bitcoin leads the way—and where it goes, altcoins follow. These movements often align with changes in Bitcoin Dominance.
So, yes, Bitcoin is the king—but its movements aren’t random. Bitcoin follows rules, and these rules are shaped by data—especially macroeconomic data. One major example is the Consumer Price Index (CPI), released monthly by the U.S. Department of Labor and Statistics.
And here's the key: the big players often have early access to this kind of information. They prepare accordingly—days before the official release—and when the data hits, they move the markets up or down. Even whales don’t act on gut feelings. They follow a framework.
We, as retail traders, must adopt a similar approach. We may not have insider access, but we do have knowledge—and with an open mind, we can act in advance.
As I’ve emphasized before: learning to read Market Structure lets you decode not just market psychology, but also the intentions of the big players. Their large positions leave footprints, just like a ship cuts a path through water. That trail is visible—for those who know where to look.
If you study volume correctly, you’ll start to notice certain zones that keep coming back. That’s all I’ll say—for now.
Unfortunately, many traders rely blindly on strategies like swing trading, expecting price to react at predefined swing highs or lows. But this rarely happens on schedule—especially in crypto. Yes, swing highs and lows exist—that’s the nature of all markets—but in between those levels, the big players create hidden structures that act as signals.
These aren’t just random formations—they’re part of how the big players "communicate" with one another. First, to maintain balance within their own circles. Second, to create FOMO and trap emotional retail participants.
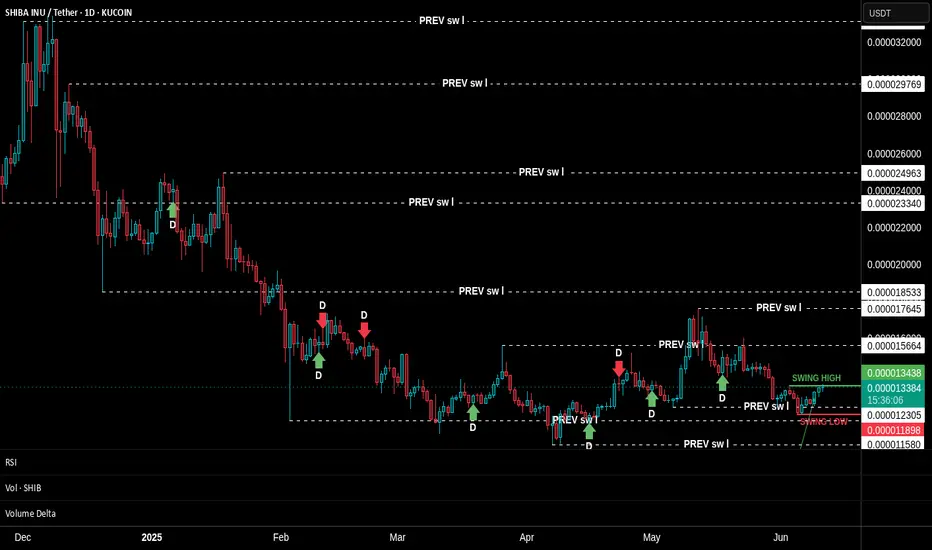
Look at the SHIBA INU chart I’ve shared. This technique is unfolding in real time. Do you notice how the structure is compressing? How price and new swing levels are squeezing in? Look closer at the footprints I’ve highlighted—some of those levels are being respected and reused in the future.
We’re taught from childhood that "we can’t know the future." But is that really true? Repetition of such beliefs is common—worldwide. But again, is it true? I think not.
Think about this: if you drive a car full-speed toward a wall and don’t brake, what happens? You crash. Isn’t that a form of future reading? It’s based on logic, observation, and probability. The same tools we use in market analysis.
So, I hope my words challenge your thinking.
📅 As of this writing (June 11, 2025), Bitcoin is trading at $109,588.
Today’s candle still has about 17 hours left to form, and price action on the daily timeframe is sitting within a previously established supply zone. Bulls and bears are clashing here. But zoom in: what's happening on the lower timeframes? Which signals have been tested, and which haven't?
Are we about to see a breakthrough above the all-time high?
Could this be the launch of the next leg of the bull run?
SMR NNE OKLO – Breakout Setup Triggered by Nuclear CatalystNYSE:SMR is lighting up after Trump’s announcement on nuclear energy — and it’s not alone. NYSE:OKLO and NASDAQ:NNE are also setting up, but NYSE:SMR has one of the cleanest breakout structures on the board.
🔹 Catalyst: Trump’s nuclear energy announcement yesterday is putting serious momentum behind the sector.
🔹 Technical Setup: NYSE:SMR is building a textbook breakout formation, with $32 as the key breakout level.
🔹 Volume & sentiment are increasing — early signs that buyers are positioning.
My Trade Plan:
1️⃣ Anticipatory Entry: I’m looking to buy the first dip before the $32 breakout — getting in early with tight risk.
2️⃣ Add on Breakout: Will scale in above $32 if volume confirms.
3️⃣ Stop Loss: Just below the recent base — staying tight on risk.
Why I’m Watching This Closely:
Sector catalyst + technical setup = 🔥
Nuclear names have been under accumulation, and now they’ve got a narrative tailwind.
First dip after a big catalyst is often the best R/R opportunity.

Is There the Best Moving Average For Swing Trading?Is There the Best Moving Average For Swing Trading?
In swing trading, moving averages are widely used to analyse market trends and identify potential turning points. In this article, we’ll dive into the most commonly used MAs, their unique characteristics, and how they can be applied in swing trading strategies.
What Are Moving Averages?
You definitely know what moving averages are. However, we need to start our article with a brief introduction to this market analysis tool.
A moving average (MA) is a fundamental tool in technical analysis that helps traders understand the direction of a market trend by smoothing out price fluctuations, often touted among the best indicators for swing trading. Instead of focusing on the volatile ups and downs, MAs calculate an average of prices over a specific period, such as 20, 50, or 200 periods. This gives traders a clearer picture of the overall trend by filtering out short-term volatility.
There are different types of moving averages, but they all work on the same principle: tracking the average price over time to highlight the market's trajectory. For example, a 20-period MA shows the average (usually closing price but a trader can choose highs, lows, and opens) over the past 20 periods, updating as new prices come in. This rolling calculation creates a line on the chart, making it easy to identify whether the market is trending upwards, downwards, or moving sideways.
Types of Moving Averages
Moving averages come in various forms, each with unique characteristics that cater to different trading styles and strategies.
Simple Moving Average (SMA)
The simple moving average (SMA) is the most straightforward type, calculated by averaging the closing prices (but a trader can choose any price type) over a set number of periods. For example, a 20-period SMA adds up the last 20 closing prices and divides by 20. It’s popular among traders who want a broader view of price trends without overreacting to short-term fluctuations, making it a contender for one of the best moving averages for swing trading. However, SMAs can lag behind price action, as they give equal weight to all prices in the calculation.
Hull Moving Average (HMA)
The hull moving average (HMA) is designed to reduce lag while maintaining a smooth line. By combining weighted averages with additional smoothing techniques, the HMA offers a balance of speed and clarity, making it an underrated moving average for swing trading.
Exponential Moving Average (EMA)
The exponential moving average (EMA) prioritises recent prices, giving them more weight in the calculation. This makes it more responsive to price changes compared to the SMA. Swing traders often use EMAs in faster-moving markets, where quick adjustments to trend shifts are crucial, with 8- and 21-period EMAs considered by some traders as two of the best EMAs for swing trading. For instance, a 20-period EMA reacts faster to sudden price movements than a 20-period SMA, helping traders spot potential reversals sooner.
Weighted Moving Average (WMA)
Similar to the EMA, the weighted moving average (WMA) also gives more importance to recent prices but does so with a linear weighting system. This means the most recent price has the greatest impact, gradually decreasing with older data. WMAs are less common but useful when traders want a more precise reflection of recent price action.
How to Use Moving Averages in Swing Analysis and Trading
Moving averages are versatile tools that can provide valuable insights for swing traders. Beyond highlighting trends, they can help identify potential turning points and dynamic support or resistance levels. Here’s how they’re commonly used in swing trading:
1. Identifying Trends
MAs are widely used to assess the direction of a trend. For instance, if the price consistently stays above a rising moving average, it suggests an upward trend. Conversely, when prices remain below a declining moving average, the market could be trending downward. Swing traders often rely on shorter moving averages, like the 20-period, for identifying trends that align with their trading horizon.
2. Spotting Reversals with Crossovers
Crossovers happen when two MAs intersect. A common example is a shorter MA crossing above a longer one, which may indicate a shift towards bullish momentum and vice versa.
3. Dynamic Support and Resistance
MAs act as floating support and resistance levels. MAs serve as a support level in an uptrend, with the price bouncing off it repeatedly. In a downtrend, the same moving average might act as resistance, limiting upward moves.
4. Filtering Market Noise
In choppy markets, MAs can smooth out minor fluctuations, making it easier to focus on the bigger picture. Swing traders often use longer MAs, such as the 50-day or 200-day, to filter out irrelevant short-term movements.
5. Timing Entry and Exit Zones
Many traders use crossovers to time their entries and exits, though it’s worth noting their lagging nature means they can result in untimely trades. They can also provide context. For example, if the price approaches a key moving average after a strong move, it might indicate a consolidation phase or a potential reversal, allowing traders to adapt their analysis.
Common Moving Averages for Swing Trading: The 20, 50, and 200 MAs
Swing traders often turn to the 20-, 50-, and 200-period moving averages as their go-to tools for analysing market trends. Each serves a specific purpose, helping traders gauge short-, medium-, and long-term price movements. These moving averages are often used together.
20-Period Moving Average
The 20-period MA is a favourite for short-term trend analysis. It reacts quickly to price changes; therefore, traders use it to identify recent momentum or potential trend shifts. Traders frequently watch for price “bounces” off the 20-period MA as potential indications of continuation in the current trend.
50-Period Moving Average
The 50-period MA provides a medium-term perspective, offering a smoother look at price trends. It’s slower to react than the 20-period MA but avoids being overly lagging. This balance makes it useful for identifying sustained trends while filtering out minor price noise. When prices interact with the 50-period MA, it often acts as a dynamic support or resistance level.
200-Period Moving Average
The 200-period MA is the benchmark for long-term trend analysis. It’s often used to determine the overall market direction. This MA is also a widely followed indicator for institutional traders, adding weight to its significance. Interactions with the 200-period MA often mark key turning points or areas of consolidation.
Traders also monitor crossovers between the 50- and 200-period MAs, recognised by some as the best moving average crossover for swing trading. For instance:
- Golden Cross: When the 50-period MA crosses above the 200-period MA, it suggests potential bullish momentum.
- Death Cross: When the 50-period MA drops below the 200-period MA, it signals a possible bearish shift.
Using Them Together
Using the 20-, 50-, and 200-period MAs together offers a comprehensive approach to identifying the best moving average crossover setups, allowing traders to see the bigger picture while still tracking short-term shifts. For instance, when the price breaks above the 200-period MA while the 20-period MA crosses above the 50-period MA, it may signal the beginning of a broader bullish trend. Meanwhile, a price drop below all three MAs could suggest broader bearish momentum.
Other Moving Average Combinations for Swing Trading
While the 20, 50, and 200-period MAs are staples in swing trading, exploring other combinations can offer nuanced insights tailored to specific trading strategies. Some alternative moving average setups that traders often employ include:
8-Period and 21-Period Exponential Moving Averages (EMAs)
This pairing is favoured by traders seeking to capture short-term price movements with greater sensitivity. They call this the best EMA crossover strategy. The 8-period EMA responds swiftly to recent price changes, while the 21-period EMA provides a slightly broader perspective.
10-Period and 50-Period Simple Moving Averages (SMAs)
Combining the 10- and 50-period SMAs offers a balance between short-term agility and medium-term trend identification. This combination helps traders filter out minor price fluctuations and focus on more sustained movements.
28-Period and 50-Period HMAs
For traders focused on short-to-medium-term trends, the 28- and 50-period HMAs offer a balanced approach. The 28-period HMA reacts quickly to price changes, while the 50-period HMA provides a steadier view of the broader trend. Crossovers between the two can signal potential bullish or bearish momentum shifts, benefiting from the HMA’s reduced lag.
13-Period and 34-Period WMAs
Rooted in Fibonacci sequences, the 13- and 34-period WMAs are employed by traders who believe in the natural rhythm of the markets. A 55-period WMA can also be included for a longer-term perspective. Crossovers between these WMAs can highlight potential trend reversals or continuations, with the WMA adapting more quickly than other MAs due to its weighted calculation.
Implementing These Combinations
When applying these moving average combinations, it's crucial to consider the following:
- Market Conditions: These combinations often perform better in trending markets versus ranging markets. Moreover, shorter MAs might be more effective in capturing quick price movements during high volatility.
- Timeframes: Traders align MAs with their trading horizon. Shorter periods like the 5-period or 8-period MAs are usually used by traders focusing on brief swings, while longer periods like the 50-period MA cater to those looking at extended trends.
- Confirmation with Other Indicators: Relying solely on moving averages can lead to false signals. Traders corroborate these signals with other technical indicators, such as Bollinger Bands or the Relative Strength Index (RSI).
What Moving Averages Should You Use for Swing Trading?
There is no best moving average for swing trading. The choice of MAs ultimately depends on a trader's strategy and preferences. The combinations discussed provide a framework, but experimenting with different setups can help identify what aligns with individual trading styles and objectives.
The Bottom Line
Moving averages are powerful tools for swing trading, offering insights into trends and potential market turning points. Whatever your unique preference for different types and lengths, understanding their application can refine your strategy.
FAQ
Which Moving Average Is Good for Swing Trading?
The 20-period, 50-period, and 200-period moving averages are widely used in swing trading. However, different combinations, like the 8- and 21-period or 13- and 34-period MAs can offer equally valuable insights; it ultimately comes down to the trader’s preference.
What Is the Most Popular Moving Average to Use?
The most popular moving average depends on a trader’s trading style and goals. Shorter MAs, like the 20-day MA, are popular for quick trend identification, while longer ones, such as the 200-day MA, provide a bigger picture. Many traders combine MAs to cover different timeframes.
Is 200 EMA Good for Swing Trading?
The 200-period EMA is useful for swing traders seeking to understand long-term trends. It reacts faster than the 200-period SMA, making it suitable for traders looking to incorporate a responsive indicator in their analysis.
Which Indicator Is Most Popular for Swing Trading?
There isn’t a single best indicator for swing trading. Moving averages, RSI, MACD, and volume indicators are commonly used. Combining these can provide a more comprehensive analysis.
Which Volume Indicator Is Popular for Swing Trading?
The On-Balance Volume (OBV) and Volume Weighted Average Price (VWAP) are popular volume indicators for swing traders, helping assess market momentum.
Which RSI Indicator Is Popular for Swing Trading?
The standard 14-period RSI is widely used. Swing traders often adjust it to shorter periods (e.g., 7) for faster signals or longer periods (e.g., 21) for smoother trends.
This article represents the opinion of the Companies operating under the FXOpen brand only. It is not to be construed as an offer, solicitation, or recommendation with respect to products and services provided by the Companies operating under the FXOpen brand, nor is it to be considered financial advice.

Swing Trading: Unique Features and StrategiesSwing Trading: Unique Features and Strategies
Swing trading stands out as a dynamic approach in the trading world, blending elements of both short-term and long-term strategies. In this article, we will explore the unique features of swing trading, including its reliance on technical analysis, the use of chart patterns, and the strategic timing of entries and exits. Whether you're new to trading or seeking to refine your approach, understanding the nuances of swing trading can provide valuable insights into navigating the financial markets.
The Basics of Swing Trading
Swing trading meaning refers to a style that involves holding short- and medium-term positions - usually from a couple of days to a few weeks - with the aim of capitalising on the “swings” in the market.
What is a swing trader? A swing trader’s definition is simple: swing traders are those who typically enter and exit markets at significant support and resistance levels, hoping to capture the bulk of expected moves.
These traders tend to look at hourly to weekly charts to guide their entries, although the timeframe used will depend on the swing trader’s individual approach and the asset being traded. Swing trading can be used across all asset classes, from stocks and forex to cryptocurrencies* and commodities. In the stock market, swing trading can be especially effective, as stocks tend to experience high volatility and are subject to frequent news and events that can drive prices.
Swing traders predominantly use technical analysis to determine their entries and exits, but fundamental analysis, like comparing the interest rates of two economies, can also play a significant role. It can help determine a price direction over the course of days or weeks.
Swing Trading vs Other Styles
To better understand the unique features of swing trading, let’s compare it with our styles.
Position trading involves holding trades for weeks and months, focusing on capturing long-term trends. Position traders are less concerned with short-term fluctuations and are more likely to use fundamental analysis, such as economic data and company earnings, to make their decisions. This style requires patience and a long-term perspective, with fewer trades but potentially larger returns per trade.
Swing trading involves holding trades for several days to a few weeks, aiming to capture short- and medium-term price movements within a larger trend. This style balances the need for active market participation with the flexibility to not monitor trades constantly. Swing traders primarily rely on technical analysis to identify entry and exit points, focusing on chart patterns and indicators.
Day trading requires traders to buy and sell assets within the same trading day, often holding positions for just minutes or hours. The goal is to capitalise on intraday price movements, and traders close all positions before the market closes to avoid overnight risk. This style demands constant market monitoring and quick decision-making, with a strong reliance on real-time technical analysis.
Scalping is an ultra-short-term trading style where positions are held for seconds to minutes, aiming to make small profits on numerous trades throughout the day. Scalpers rely almost entirely on technical analysis and need to act quickly, often executing dozens or hundreds of trades daily. The focus is on high-frequency trading with very tight stop-losses, requiring intense concentration.
Swing Trading: Benefits and Challenges
Although swing trading provides numerous opportunities which makes it popular among traders, it comes with a few challenges traders should be aware of.
Benefits:
- Lower Time Commitment. One of the most significant benefits for swing traders is the reduced time commitment. This style can be adapted to suit a trader’s individual schedule.
- Flexibility. It is often more flexible than other styles. Not only does it offer time flexibility, but it allows for a wider range of tools to be used to determine price swings. Also, it can be applied to many assets. The most common is swing trading in forex and swing trading in stocks.
- Technical Analysis Focus: Utilises technical indicators and chart patterns to identify entry and exit points, providing clear criteria for decision-making.
- More Opportunities Compared to Long-Term Techniques. Because swing traders usually hold positions for a few days to a few weeks, they have the ability to take advantage of shorter-term market movements that might not be reflected in longer-term price trends.
Challenges:
- Exposure to Overnight Risk. Positions held overnight or over weekends can be affected by unexpected news or events, leading to potential gaps or adverse price movements.
- Requires Patience: Effective swing trading requires waiting for trades to develop over days or weeks, which may test a trader's patience.
- Market Volatility: Performance can be impacted by periods of low volatility or choppy markets, where price movements may not align with your expectations.
Popular Tools to Use When Swing Trading
The effectiveness of a swing traders’ strategies will ultimately depend on their ability to correctly identify price movements. For this, traders use different chart patterns and technical indicators. Here are three common tools that can be used as part of a swing trading strategy.
Channels
Traders can use channels to take advantage of well-identified price trends that play out over days and weeks. To plot a channel, you first need to identify a trending asset that’s moving in a relative zig-zag pattern rather than one with large jumps in price. Traders will often use the channel to open a swing trade in the direction of the trend; in the example above, they might look to buy when the price tests the lower line and take profit when the price touches the upper line of the channel.
Moving Averages
Moving averages (MAs) are one of the commonly used indicators and they can help swing traders determine the direction of the trend at a glance. The options here are endless:
- You could pair fast and slow moving averages and wait for the two to cross; this is known as a moving average crossover. When a shorter MA crosses above a longer one, the price is expected to rise. Conversely, when a shorter MA breaks below a longer one, the price is supposed to decline.
- You could stick with one and observe whether the price is above or below its average to gauge the trend. When the price is above the MA, it’s an uptrend; when it’s below the MA, it’s a downtrend.
- You could use an MA as a support or resistance level, placing a buy order when the price falls to the MA in an uptrend and a sell order when it rises to the MA in a downtrend.
Fibonacci Retracements
Lastly, many swing traders look to enter pullbacks in a larger trend. One of the most popular ways to identify entry levels during these pullbacks is the Fibonacci Retracement tool. Traders typically wait for a shift in price direction, then apply the tool to a swing high and swing low. Then, they enter at a pullback, usually to the 0.5 or 0.618 levels, to take advantage of the continuation of the trend. As seen above, this strategy can offer entry points for those looking to get in early before a trend continues.
The Bottom Line
Swing trading stands out for its ability to balance the demands of active trading with the flexibility of longer-term investing. The unique features of swing trading, such as its moderate holding periods and strategic use of technical indicators, allow traders to potentially manage risk and adapt to various market conditions. Embracing swing trading strategies can help traders refine their approach. As with any trading style, continued learning and disciplined execution are key to achieving consistent results.
FAQ
What Is Swing Trading?
Swing trading is a style that involves holding positions over a period of several days to weeks to take advantage of price movements within a trend. Swing traders use technical analysis, including chart patterns and indicators, to identify potential entry and exit points, balancing the need for active participation with a longer-term perspective.
What Is Swing Trading vs Day Trading?
Swing trading and day trading are distinct methods. The former focuses on capturing price movements over several days to weeks, allowing for less frequent trading and requiring less constant market monitoring. In contrast, the latter involves buying and selling assets within the same trading day, often holding positions for minutes or hours, and requires continuous market observation and quick decision-making.
What Is the Downside of Swing Trading?
The downsides of swing trading include exposure to overnight and weekend risks, as positions held outside market hours can be affected by unexpected news or events. Additionally, this method requires patience and discipline, as trades may take time to develop, and performance can be impacted by periods of low volatility or choppy markets.
*Important: At FXOpen UK, Cryptocurrency trading via CFDs is only available to our Professional clients. They are not available for trading by Retail clients. To find out more information about how this may affect you, please get in touch with our team.
This article represents the opinion of the Companies operating under the FXOpen brand only. It is not to be construed as an offer, solicitation, or recommendation with respect to products and services provided by the Companies operating under the FXOpen brand, nor is it to be considered financial advice.

Castrol India - Swing trading setup!Castrol India - Swing trading setup!
Note: This is not a trading recommendation. This analysis is for educational purposes only. We'll know in few days if the price moved as per the study.
It is not advisable to go long when the general market is trending low.

GBP/USD 4H Analysis – Bearish Breakdown SetupThis chart presents a bearish trading setup for GBP/USD on a 4-hour timeframe from OANDA.
Key Observations:
Ascending Channel Breakdown: GBP/USD was previously trading inside an ascending channel, but it has now broken below support, signaling a potential downtrend.
Retest Level: The price is currently retesting the broken support at 1.29645, which may act as a new resistance.
Resistance Zone: The key resistance level is at 1.30261, marking the last swing high before the breakdown.
Bearish Target: The expected downside target is at 1.26827, aligning with a previous demand zone and support level.
Trading Plan:
Entry: Consider short positions after rejection from the 1.29645 retest.
Stop Loss: Place above 1.30261 to avoid false breakouts.
Take Profit: First target at 1.26827, with the possibility of further downside.
Market Outlook:
If the price fails to reclaim the broken support and starts dropping, it could confirm a bearish trend continuation, making this a strong short setup.

JPY/USD Price Action & Trade Setup
Market Structure & Trend:
The chart illustrates JPY/USD on the 4-hour timeframe, showing a rising channel pattern.
Price has recently rejected from resistance near 0.0068058 and is now showing signs of a bearish move.
Trade Setup:
Bearish bias: The pair is breaking down from the channel, indicating a potential trend reversal.
Key levels:
Resistance: 0.0068058
Support Zone: 0.0064368 (Target area)
Potential Move: A continuation of this bearish movement may lead to a drop toward the support zone.
Conclusion:
If the price sustains below the midline of the channel, further downside is likely.
A retest of support at 0.0064368 could offer potential opportunities for either a bounce or a continuation of the bearish trend.
📌 What’s next? Watch for price action near the support zone for potential trade setups.

EUR/GBP - Bearish Rejection from Resistance
This 4-hour chart of EUR/GBP indicates a potential sell opportunity following a rejection from a key resistance level.
Key Observations:
Resistance Level: Price is struggling to break above 0.84200, suggesting strong selling pressure.
Bearish Structure: The price action shows a rejection at resistance, forming a potential lower high.
Target Support: The next major support level is around 0.83448, followed by 0.82562 for further downside.
Trading Plan:
📉 Sell Entry: After price confirmation below 0.84000
🎯 Take Profit: First target at 0.83448, second target at 0.82562
🔴 Stop-Loss: Above 0.84300 to minimize risk
Technical Indicators to Watch:
✅ Bearish Candlestick Patterns confirming resistance rejection
✅ RSI Divergence or overbought conditions
✅ Break & Retest Confirmation before entering a short trade

USD/CHF - Bullish Reversal Setup
This 4-hour chart of USD/CHF shows a potential bullish reversal from a key support level.
Support Zone: The price is approaching a strong support level around 1.10193 - 1.12261, where previous price action has reacted.
Reversal Expectation: A bounce from this level could trigger a bullish move toward the 1.15719 resistance level.
Target Projection: If price respects the support, a 3.00% potential upside is expected.
Trading Plan:
Buy Entry: Look for bullish confirmation signals at the support zone.
Stop-Loss: Below the support area to minimize risk.
Take Profit: First target at 1.15719.
Technical Indicators to Watch:
Bullish Candlestick Patterns at support.
RSI / MACD for momentum confirmation.
Trendline Breakout for additional bullish confirmation.

Gold Buy SignalHi guys,
Hope you are all doing great.
Here is the gold signal that we have provided. We want the 1hr candle to close above the entry, see some respect for the entry line, and then we can enter the trade
These trades are all about patience, and risk reward management. Here are the numbers.
📌 ENTRY : 2907.43
❌ SL : 2885.83
✔️ TP1 : 2927.76
✔️ TP2 : 2953.74
✔️ TP3 : 2986.48
Good luck, hope you earn lots of profit. Message me if you have any questions.
Sarah

SOXL Has Room to Run?This one has a double bottom look, with a higher low, and another 4% remaining to hit take profit enroute to retesting the neckline before breaking out (another 8% from here) or balance and fail! Stop loss of 5% is pretty steep, so typically I either lower my position size or stop loss. Even at 4% stop loss, according to backtest results this wins more than it loses and has done pretty decent in the past, as I have been forward testing this model for over the past 18 months and profiting from over 100 different equities that I signal on.
The King Trading Momentum Strategy combines the 5 EMA crossing above the 13 EMA, RSI strength, favorable momentum as measured by ADX plus evaluating recent volume changes! SOXL and over 100 equities are built into this script with optimal backtest take profits and stop losses and can be toggled on by simply checking a box (default they are turned off). Check out my script, as I am always looking for people to help test and I am always interested in feedback...

Time for ARKK to Breakout?ARKK has been trading within a channel and finally appears like maybe it's time to breakout? When ARKF and ARKW signaled earlier in the day, figured it was only a matter of time when this one would go! With Fed tomorrow this on is a tricky trade and if anything this bear flag appears it retraced to the golden pocket on dropping volume. However, this one is my favorite one to trade when it signals.
Let me know if you think this is a bear flag ready to move lower with Fed speak or going to move higher?
The King Trading Momentum Strategy combines the 5 EMA crossing above the 13 EMA, RSI strength, favorable momentum as measured by ADX plus evaluating recent volume changes and even something that measures breakout momentum called Beta for this one! ARKK and over 100 equities are built into this script with optimal backtest take profits and stop losses and can be toggled on by simply checking a box (default they are turned off). This one has won a couple in a row and this algo likes to get streaky!

Chips No Longer Power Hungry?With news of DeepSeek overnight hitting semi-conductors, is there all of a sudden less need for power? Well if there is then the first place I typically go is ERY. This ETF trades as a Bear 2x leveraged ETF to XLE. This means that for every penny XLE goes down, ERY goes up two pennies... Developing situation here so will watch this one closely!

Time to "ZOOM" back to winnings ways?On Thursday afternoon, the King Trading Momentum Strategy triggered alongside eleven other alerts, followed by five more on Friday. This flurry of signals doesn’t exactly indicate a “bearish” sentiment, but as always, the market has its unpredictable ways! With markets approaching all-time highs, I’ve been cautious, limiting my positions to just a few with low allocations in TNA, ADBE, PYPL, and XYZ.
When I analyzed Zoom (ZM), I noticed that it experienced a strong rally from July through the end of the year, gaining over 50%. Now, the key question is: has it finished consolidating, or is there more downside ahead?
Looking back to July, ZM’s performance suggests a classic bull flag pattern. It’s retraced to the 38% Fibonacci level, and during a two-hour window when the signal fired, the impressive “wick” formed caught my attention. Now, after a short-term pump, it’s retracing again, and I’m eyeing the 50% Fibonacci level as a potential entry point.
Unless Monday brings a major selloff due to concerns over the Fed meeting on Wednesday or the PCE data on Friday, I’ll likely use the usual morning volatility to position myself in this trade. Let’s see how this one unfolds!
The King Trading Momentum Strategy employs a robust combination of indicators: the 5 EMA crossing above the 13 EMA, RSI strength, favorable momentum measured by ADX+, and MACD confirmation. ZM, along with over 100 other equities, is integrated into this script with optimized backtested take-profit and stop-loss levels. Activating these parameters is as simple as checking a box (they’re off by default), making this strategy both powerful and user-friendly.

SHOP Go Long! Will it break out this time?Recently SHOP has retraced and held the 50% Fib level and has been trading within a channel where it is about at the mid point of it. The King Trading Momentum Strategy yesterday issued a buy signal. This strategy combines the 5 EMA crossing above the 13 EMA, RSI strength, favorable momentum as measured by ADX plus evaluating recent volume changes. It has been forming a bull flag on the hourly and pre-market suggests this may be ready to break out. I followed the signal and bought a half position, looking to protect the trade at take-profit of 4%. During backtest this proved to be an optimum area and a stop-loss of 3% is warranted. SHOP and over 100 equities are built into this script. If trade protects at 4%, a trailing stop-loss of 2% will be adhered to in order to lock in as much profit as possible if this stock breaks out of the descending channel! I'm thinking its not too late for me to add to this position given typical morning volatility.

swing trading for December 23 Crowdstrike Holdings(CRWD)CRWD Is Trading Now Using a Price Channel Pattern. Price channels are continuation patterns of parallel trend lines. They indicate that the price is likely to continue moving within the channel.
The breakout from the channel can signal significant trend changes. An upward channel suggests a bullish trend, while a downward channel indicates a bearish trend.

Tesla (TSLA) short term outlookTesla (TSLA) stock is forming an ascending triangle pattern on its daily chart, which signals a potential bullish continuation. This formation is characterized by a horizontal resistance level and a rising trendline of higher lows, reflecting increasing buyer strength and suggesting the possibility of an upside breakout.
The stock has repeatedly faced selling pressure at a horizontal resistance level, which represents a key inflection point. A breakout above this zone could attract further buying interest and signal a continuation of the upward trend. Meanwhile, the rising trendline, formed by higher lows, highlights consistent buying support even during pullbacks, reinforcing confidence in Tesla's bullish trajectory.
Volume is a crucial factor in validating this breakout. A surge in volume as TSLA moves above resistance would confirm the breakout, whereas low volume could indicate a false move, requiring caution. The stock is currently trading above its key moving averages, which are aligned in a bullish formation. Additionally, momentum indicators like RSI and MACD should be monitored closely to confirm the strength of the move.
For traders looking to capitalize on this setup, a potential strategy could involve entering a long position once the stock decisively breaks above the resistance level, ideally accompanied by increased volume. A stop loss can be placed just below the ascending trendline or the most recent higher low to manage downside risk. Profit targets can be estimated using the height of the triangle, projected upward from the breakout point. As the stock moves higher, trailing the stop loss could help lock in gains while still allowing for additional upside potential.
Tesla’s ascending triangle pattern suggests the stock is at a critical juncture. A breakout supported by strong volume and positive momentum could signal the next leg of its bullish trend. However, as with any technical setup, traders should remain cautious, monitor key levels, and use proper risk management to navigate potential volatility.

EURCADHello Traders,
Here is my analysis for this pair. Please feel free to leave any questions or comments below. I'm happy to engage with you!
The entry will only be considered once all your trading rules are satisfied. I recommend adding this pair to your watchlist and monitoring it closely. If the conditions of your strategy align, then it could present a potential opportunity.
Pro Tip:
One of the best ways to improve your trading is by learning from others. Whether it's predictions, market analysis, or trade set-ups based on clear market conditions, studying ideas will help enhance your skills and refine your strategies.
Good luck and happy trading!
