MUTHOOT FINANCE Swing Long TradeEnter only when 15minute candle closes above the Entry Zone Price - 1955
Target with Risk to reward 1:2 is 2129
Stoploss only when 1 day candle closes below the price - 1868.05
Note: This is not any financial advice, this is for education purpose only.
Swingtradingsetup

CDSL Swing Long SetupEnter only when 15minute candle closes above the Entry Zone Price - 1484.95
Target with Risk to reward 1:2 is 1765.55
Stoploss only when 1 day candle closes below the price - 1344.60
Note: This is not any financial advice, this is for education purpose only.

TRIVENI TURBINE Swing Long TradeEnter with Stop Limit order placed at - 745.10
Target with Risk to reward 1:2 is 929.9
Stoploss only when 1 day candle closes below the price - 641.75
Note: This is not any financial advice, this is for education purpose only.

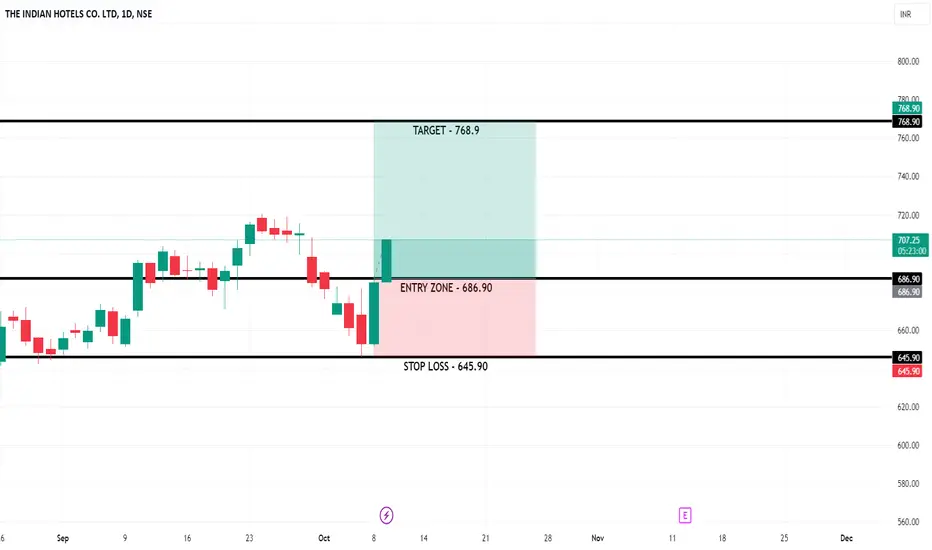
INDIAN HOTELS Swing Long SetupEnter with Limit order placed at - 694
Target with Risk to reward 1:2 is 768.9
Stoploss only when 1 day candle closes below the price - 645.9
Note: This is not any financial advice, this is for education purpose only
Karur Vysya Bank - Swing Long SetupEnter only when 15minute candle closes above the Entry Zone Price - 220.79
Target with Risk to reward 1:2 is 250.20
Stoploss only when 1 day candle closes below the price - 206.10
Note: This is not any financial advice, this is for education purpose only.

POLICYBZR Swing Long SetupEnter with Stop Limit order placed at - 1740
Target with Risk to reward 1:2 is 2130
Stoploss only when 1 day candle closes below the price - 1545.05
Note: This is not any financial advice, this is for education purpose only.

ADITYA BIRLA FASHION (ABFRL) Time to dive for a swing
ADITYA BIRLA FASHION (ABFRL) is trading near its 52 week high & consolidated for few weeks and trying to break resistance, once it breaks and sustain above resistance price will move towards 500INR.
This is just my overview on the basis of price action and i am not recommending to buy or sell.
(I am not SEBI registered)

FEDERAL BANK Swing Long SetupEnter with Limit order placed at - 188.59
Target with Risk to reward 1:2 is 202.31
Stoploss only when 1 day candle closes below the price - 181.73
Note: This is not any financial advice, this is for education purpose only

TVS MOTORS RANGE BREAKOUT ( BULLISH OVERVIEW)TVS MOTORS is looking good till now because a major range is break.
Now If price sustain above support and holds at higher level will proof that this stock is having strength.
My over is bullish for next few days

WIPRO Swing trading setup & Investment opporunity (overview)WIPRO Swing trading setup & Investment opporunity (overview)
WIPRO is looking strong and creating higher high creation..if sustain above support then upmove will be expected next month

WHIRLPOOL Swing Long SetupEnter only when 15minute candle closes above the Entry Zone Price - 2084.60
Target with Risk to reward 1:2 is 2293
Stoploss only when 1 day candle closes below the price - 1980.20
Note: This is not any financial advice, this is for education purpose only.

POWERGRID Swing Long SetupEntry Zone - 335.30 - 336.82
Target - 358.80
Stoploss - 323.55
Stoploss only when 1 day candle closes below the price - 323.55
Note: This is not any financial advice, this is for education purpose only

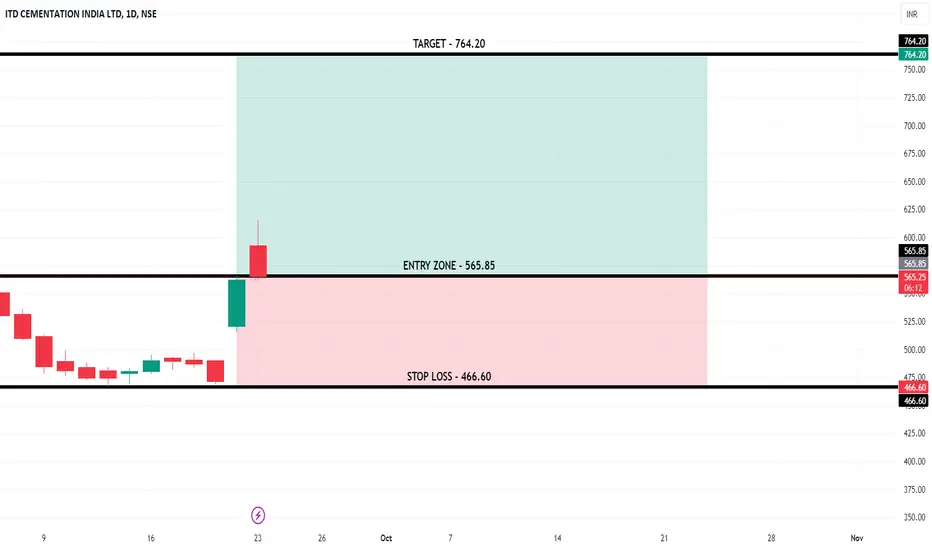
ITDCEM Swing Long SetupEnter with Limit order placed at - 565.85
Target with Risk to reward 1:2 is 764.20
Stoploss only when 1 day candle closes below the price - 466.60
Note: This is not any financial advice, this is for education purpose only
MOTHERSON Swing Long SetupEnter only when 15minute candle closes above the Entry Zone Price - 190
Target with Risk to reward 1:2 is 206
Stoploss only when 1 day candle closes below the price - 182
Note: This is not any financial advice, this is for education purpose only.

Apple Inc. (AAPL) chart analysisThe stock chart for Apple (AAPL) highlights the formation of an Ascending Triangle pattern. This is a bullish continuation pattern characterized by a rising support trendline and a horizontal resistance level, as depicted by the converging red lines.
In an ascending triangle, the rising support indicates that buyers are stepping in at progressively higher levels, while the horizontal resistance suggests that sellers are capping gains at a certain price level. This pattern generally suggests accumulation, where buying pressure builds up, and it often leads to a breakout above the resistance line if enough momentum gathers.
At the moment, AAPL is approaching the resistance line but has not yet broken out. If the stock price moves above the resistance level with strong volume, it could signal a bullish breakout, leading to a new leg higher. However, if the price reverses and breaks below the support line, it could signal a bearish move, making it essential to watch the coming price action closely.
Given the upward slope of the support line, the bias remains bullish, but traders should remain cautious until a clear breakout occurs.

GBPUSD Week 29 Swing ZonesPinched +25 pips in Week 28.
Looking back, we can see where price broke a swing zone but failed to continue, retracing back for what was suppose to be a huge swing to the down side.
Lessons learnt, new week new zones set.

FILATEX - Poised for a 15-30% UpmoveThe stock is in uptrend in Monthly.
It is poised to break out of an inverse head and shoulder pattern.
Entry - 51.15
Target 1 - 59
Target 2 - 64
Target 3 - 69.

XAUUSD: Are We Heading Towards $3000?After looking at monthly price momentum, in our view price can create all time high and go beyond $2500 in long term. Most of the economic data suggests the future growth on Gold. In short term right now we are targeting $2500 region at first after that we can some short term price correction. There will be multiple good entries that market will present, the first one is at the current trading price. We will update the chart as we progress.
good luck ;)

52 WEEK HIGH BREAKOUT STOCKNSE:PENINLAND
All information on this page is for educational purposes only,
we are not SEBI Registered, Please consult a SEBI registered financial advisor for your financial matters before investing And taking any decision. We are not responsible for any profit/loss you made.

52 WEEK HIGH BREAKOUT NSE:ALEMBICLTD
All information on this page is for educational purposes only,
we are not SEBI Registered, Please consult a SEBI registered financial advisor for your financial matters before investing And taking any decision. We are not responsible for any profit/loss you made.


EUR/USD rally loses steam ahead of US inflation reportThe euro's rally from the December low appears to be losing steam. Tuesday's high respected a resistance cluster including a 61.8% Fib level, high-volume node and trend resistance. A 2-bar bearish reversal (which includes an engulfing candle) only made a marginal high above Friday's high, and a bearish divergence has formed on the RSI.
With CPI looming, perhaps the market will try to fill some of the liquidity gaps left during the bearish engulfing candle. And with the potential for a hotter-than-expected CPI report (and therefore a stronger dollar / lower euro), the bias is for an eventual retest of the 200-day average ~1.0832. A break beneath which brings 1.0820 and 1.080 into focus for bears.

Trade Reviews - Recent Positions Taken - Swings & Scalps Here's another video highlighting the trades I took this morning and yesterday and some of the longer term swing positions I'm in with analysis as to why I took them.
Hope this was helpful
Happy Trading :)
