USDCHF Buy Opportunity 300+ pipsUSDCHF oversold and in a strong buy zone in weekly RSI. This pair will reap large pips in the buy direction so keep an eye on it.
Look to enter at past support of .9027 area
Look to enter at break above resistance of 0.9182
Once we have break above resistance we are headed towards 0.9500.
Get ready and Good luck trading!
Charles V
www.cvfxmanagement.com
@cvfxwealth
Trading made Simple
Swiss

What I'm seeing on USDCHF!Price currently on my long term support. Would it hold or break?? lets see

Swis Borg- CHSB is going to rise againSwiss Borg- CHSB is going to rise again
we see dropping volume but higher Lows on each jump up and dip down.
we see dropping RSI and dropping Volume -
This looks like it is going sideways but there are intense pumps up that are sold off.
This tells me someone wants to push this project higher and it is only a matter of time before no one resists this upward push and they smash through the all time high of .16 after that- up up and away.
I have no time line for this but I would think it happens in early September.


What I'm seeing on USDCHF!I no longer trade price chart patterns, buh i still use my knowledge of price patterns to form my bias on an instrument. Moreover most chart patterns are actually formed by trend line. If this bullish pennant holds, then up we go.
NB: EURUSD GBPUSD AUDUSD NZDUSD have formed a bearish pennant cos of negative correlation to USDCHF.
Lets see

What I'm seeing on USDCHF!Triangle pattern in a descending channel. Is this a signal for the reversal?? Let see

What I'm seeing on USDCHF!If you didnt join me to make enough money on USDCHF this week, then that means you werent following at all. USDCHF on our last trade gave us 1:5% RRR.

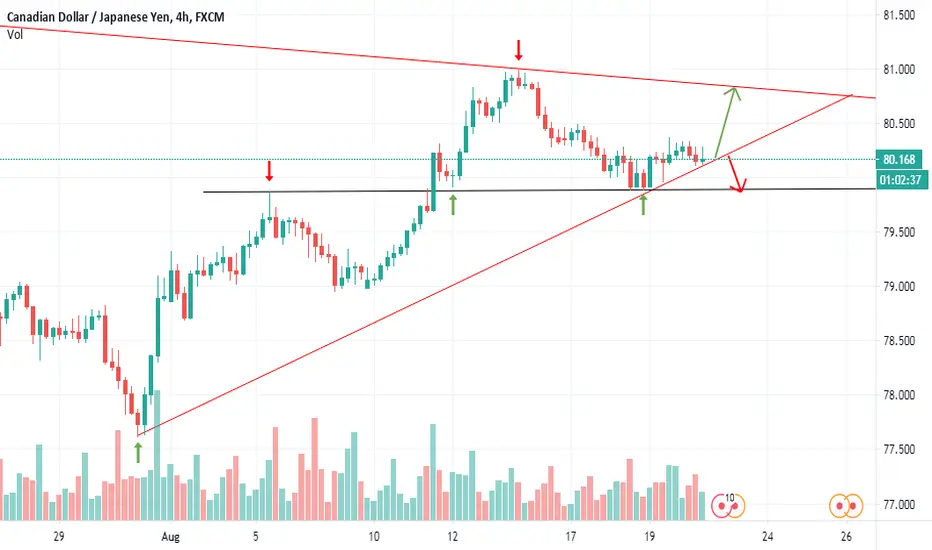


CHFJPY (August 16)This CHFJ on the 4 hour time frame. Currently we are trading within an ascending channel, as we have been for the past 30+ days. In the upcoming week we could see short setups arise. I am looking to see whether price confirms its move by forming a continuation pattern which I would then enter on the break or from the top, defending on the nature of the structure which forms. I would be looking at the beginning of the structure as the first real target, but firstly I would be targeting the bottom of the channel as the first inflection point.

NZDCHF (August 16)This is NCHF on the 4 hour. We could be seeing a reversal on this pair. Using parallel lines (which this pair tends to respond well to) we can make a case for NCHF being in a key value area. Before jumping in, we will need to wait for the market to give us clear confirmation. I would be looking to get involved at a clear rejection from the 4 hour, or if we see a rejection and then a continuation pattern, which would be a better confirmation for a move back up.

CADCHF (August 16)Similar to CJ, CADCHF has been trading within a very corrective structure for just over a month. On Friday we saw this pair close its weekly candle below this lower time frame ascending structure. To get involved, I would be looking for some sort of continuation pattern and I would be targeting the bottom of the expanding, or the double bottom area at 0.67450.

What I'm seeing on USDCHF!This was why USDCHF has been selling. looking forward to an entry at either my trend line resistance or support. lets see

What I'm seeing on USDCHF!Nice trend line reactions so far. waiting for entry either ways. buh for the meantime im bullish. lets see


What I'm seeing on USDCHF!In addy to my previous analysis on USDCHF, price broken my trend line resistance. Its heading towards to my next trend line. if it holds which i'll prefer cos of a favourable RRR, then i'll short. Otherwise, i hope for a long entry if it breaks.


We dont use technical analysis anymore - this is why! A great example - we no longer use technical analysis at all - but I spotted this from elsewhere.
Its a great example - that demonstrates our strategy will catch any big move anyway so save yourself the time and subjectivity.
We have no need to draw and analyse our charts - our strategy is already coded and we now execute and follow with confidence and belief in performance.
The technical traders that DID spot this, will see a trend line break and a push to the upside.
We just see a buy label, after closing our sell for 100 pips too.
All about probability.
Regards
Darren

AUDCHF Looking to fade post RBA spike ( if seen )...Hi,
looking to fade post RBA spike ( if seen )...
AU CPI nagative, Covid outbreak, simply cant see case for hawks ...
Sell rallies towards 66,20/30
Stop 66,80+
Target ( based on equal move ) 63,50/40
Good Luck

NZDCHF (August 3)This pair has the potential to form a form a flag, as right now we are in a corrective state. If the pattern forms I would be looking to short at the rejection of the top of the flag.

CADCHF (August 3)Price is at a key trend line and if we see a break we can look to target the recent high. If we reject this are price could form another touch of the lower structure before seeing buy opportunities.

SPX to Close -3.5% off Highs; 107% of GDP is Debt..SPX to Close -3.5% off of highs while the debt to GDP ratio remains at all time highs. What a great time to have risk-management in check, and not speculate with money we can't afford to lose. If you're outlook is that we've made a true recovery, feel free to post some charts and supporting dialogue below. I would love to hear both bullish and bearish opinions of the current macroeconomic situation as of Jul ending.
