USD/CHF: Bearish ForecastPrice is likely to retrace into the 0.83593 – 0.85750 demand zone or push higher into the FVG (0.8700 – 0.8800) before facing rejection. As long as price holds below these zones, the downtrend should continue, targeting new lows below 0.8100.
Bearish momentum remains intact unless price breaks above the FVG.
Swissfranc

USDCHF: More Bearish Order FlowSimilar to USDJPY , USDCHF has exhibited a change of character, initiating a bearish order flow for the week. Price has reached a key point of interest where a potential continuation to the downside could occur. The DXY is reflecting similar behaviour, supporting the bearish outlook.
An entry position has been established, and now it is a matter of monitoring the trade and allowing the market to develop accordingly.

Market Analysis: USD/CHF – 4H ChartThe USD/CHF pair is exhibiting a **clear bearish trend** on the 4-hour chart, with price currently consolidating around the **0.81500** level after a sharp decline. This consolidation is forming a **range-bound structure**, with support near the recent H4 low and resistance around the **0.82500** zone.
Key Observations:
Bearish momentum remains dominant, evidenced by lower highs and lower lows.
Price is currently trading just above a well-tested H4 support level.
There are two probable outcomes from this consolidation zone:
Potential Scenarios:
1. Bullish Breakout:
A rejection from the H4 support could see price push back towards the **0.82500** level.
A breakout beyond this resistance could lead to further recovery towards **0.83500** or higher.
2. **Bearish Continuation**:
A break below the H4 support zone would confirm further downside momentum.
This could lead price towards the next key support around **0.80000**, with potential extension to the **0.78500** region.
Conclusion:
USD/CHF is currently at a decision point within a broader bearish structure. Traders should watch for a breakout from the current range to confirm the next directional move, with **0.82500** and **0.80000** acting as critical inflection zones.

EURCHF - NEW BREAKOUT !Hello Traders !
On Wednesday 9 April, The EURCHF reached a strong support level.
The price broke the resistance (0.94090 - 0.93900).
This key level becomes new support !
So, I expect a bullish move🚀
______________
TARGET: 0.94830🎯

NZDCHF - Important Breakout !Hello Traders !
The NZDCHF failed to create a new lower low !
The price broke the resistance level (0.48828 - 0.48553).
This key level becomes new support !
So, I expect a bullish move🚀
______________
TARGET: 0.49420🎯

USDCHF - NEW BREAKDOWN !Hello Traders !
After a huge bearish move, the USDCHF broke the support level (0.83326 - 0.84152).
This key level becomes new resistance !
So, I expect a new bearish move📉
_______________
TARGET: 0.79300🎯

EURCHF: Strong bearish waveEURCHF is bearish on its 1D technical outlook (RSI = 32.579, MACD = -0.004, ADX = 41.175) being on a strong bearish wave inside its Channel Down. We estimate to complete a symmetric -8.33% decline from the top, as the previous wave did (TP = 0.91100).
See how our prior idea has worked out:
## If you like our free content follow our profile to get more daily ideas. ##
## Comments and likes are greatly appreciated. ##

CHFJPY - Important Breakout !Hello Traders !
The CHFJPY failed to create a new lower low !
Currently, The higher high is broken (Break of structure).
So, I expect a bullish move📉
______________
TARGET: 174.100🎯

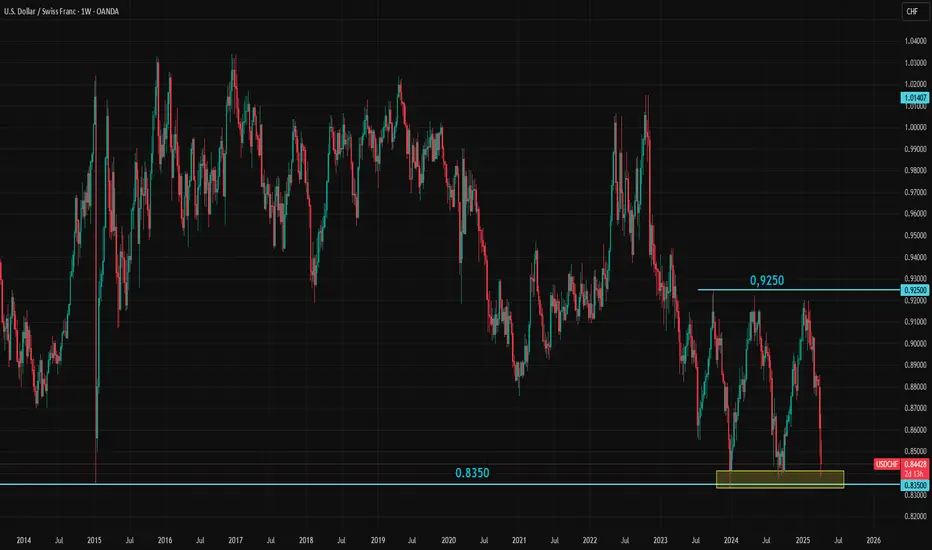
USDCHF Tests 0.8350: Break or Bounce?USDCHF is testing the critical 0.8350 support level amid rising safe haven demand. Yesterday’s chaos in the bond market highlighted how few places investors have to park their money. One of the most widely accepted safe haven assets is the Swiss franc, and current demand for CHF is clearly strong. But is it strong enough?
There hasn't been a weekly close below 0.8350 since 2011, and this level has held firm through several sharp market moves since then. Now, this major support is being tested once again.
Whether it breaks or holds, a significant swing trading opportunity could be on the horizon, especially given the heightened uncertainty surrounding the global trade environment.
Market Analysis: USD/CHF DivesMarket Analysis: USD/CHF Dives
USD/CHF declined and is now struggling below the 0.8615 resistance.
Important Takeaways for USD/CHF Analysis Today
- USD/CHF declined below the 0.8675 and 0.8615 support levels.
- There is a short-term bearish trend line forming with resistance near 0.8550 on the hourly chart at FXOpen.
USD/CHF Technical Analysis
On the hourly chart of USD/CHF at FXOpen, the pair started a fresh decline from well above the 0.8800 zone. The US Dollar dropped below the 0.8675 support to move into a negative zone against the Swiss Franc.
The bears pushed the pair below the 50-hour simple moving average and 0.8615. Finally, the bulls appeared near the 0.8420 level. A low was formed near 0.8421 and the pair is now consolidating losses.
On the upside, the pair could face resistance near the 0.8480 level. It is near the 23.6% Fib retracement level of the downward move from the 0.8674 swing high to the 0.8421 low. The next major resistance is near the 0.8550 level.
There is also a short-term bearish trend line forming with resistance near 0.8550. It coincides with the 50% Fib retracement level of the downward move from the 0.8674 swing high to the 0.8421 low, above which the pair could test the 0.8615 level.
If there is a clear break above the 0.8615 resistance zone, the pair could start another increase. In the stated case, it could even surpass 0.8675.
On the downside, immediate support on the USD/CHF chart is 0.8420. The first major support is near the 0.8400 level. The next major support is near 0.8350. Any more losses may possibly open the doors for a move toward the 0.8220 level in the coming days.
This article represents the opinion of the Companies operating under the FXOpen brand only. It is not to be construed as an offer, solicitation, or recommendation with respect to products and services provided by the Companies operating under the FXOpen brand, nor is it to be considered financial advice.

USD/CHF Market Analysis – Potential Bullish ReversalThe USD/CHF pair is currently in a downtrend, as indicated by the overall bearish price action. However, the chart suggests a potential reversal scenario.
Price is approaching a key H4 demand zone, which previously acted as strong support. If this level holds, a bullish move could be anticipated. The projected market structure indicates a possible pullback before a continuation upwards, aligning with the larger trend shift.
Traders should monitor price reaction within the demand zone, as a break below could indicate further downside continuation, while a strong rejection may confirm a bullish reversal.

USD/CHF Falls to Its Lowest Level in Nearly Five MonthsUSD/CHF Falls to Its Lowest Level in Nearly Five Months
Today, the exchange rate of one US dollar against the Swiss franc dropped below 0.87000 francs—its lowest level since early November 2024.
Since the start of 2025, the USD/CHF pair has declined by more than 4%.
Why Is USD/CHF Falling Today?
On one hand, the US dollar is weakening against other currencies due to Trump’s decision to implement the previously announced tariffs on international trade, as mentioned in our previous post.
On the other hand, the Swiss franc is gaining strength due to its appeal as a safe-haven asset. Furthermore, this morning’s release of the Consumer Price Index (CPI) showed that inflation in Switzerland remains at zero, increasing the franc’s value at a time when tariff conflicts pose risks to the global economy.
Technical Analysis of the USD/CHF Chart
Since the start of 2025, the USD/CHF pair has been following a downward trajectory, highlighted by a declining channel (marked in red), with the following key points:
→ The median line has shifted from support to resistance, as indicated by the arrows.
→ The price broke through the March support level around 0.8757, accelerating the decline.
→ The lower boundary of the channel provided support this morning, slowing bearish momentum.
It is possible that the 0.8757 level will act as resistance in April 2025. However, the future direction of USD/CHF will largely depend on news developments, particularly statements from global leaders regarding tariffs in international trade.
This article represents the opinion of the Companies operating under the FXOpen brand only. It is not to be construed as an offer, solicitation, or recommendation with respect to products and services provided by the Companies operating under the FXOpen brand, nor is it to be considered financial advice.

CHFJPY rebound on the 1D MA50 expected.The CHFJPY pair is trading within a long-term Descending Triangle and right now is pulling back to test the 1D MA50. This is almost halfway through the rebound that started on the February 28 2025 Support Zone test.
All previous rallies hit at least the 0.786 Fibonacci retracement level before reversing but since this time we are limited below the Lower Highs trend-line of the Descending Triangle, our Target is 172.500.
-------------------------------------------------------------------------------
** Please LIKE 👍, FOLLOW ✅, SHARE 🙌 and COMMENT ✍ if you enjoy this idea! Also share your ideas and charts in the comments section below! This is best way to keep it relevant, support us, keep the content here free and allow the idea to reach as many people as possible. **
-------------------------------------------------------------------------------
💸💸💸💸💸💸
👇 👇 👇 👇 👇 👇

USD/CHF: Bearish Continuation Towards Key SupportUSD/CHF has maintained a strong bearish trend, forming a series of lower highs and lower lows. The chart highlights a **Deep Crab** harmonic pattern, which previously triggered a corrective move before resuming its overall downtrend.
Currently, price action is trading near **0.8767**, approaching a key support zone at **0.8722** (HOP level). The recent rejection from the **H4 supply zone** around **0.8920** further confirms bearish momentum, suggesting sellers remain in control.
**Key Considerations:**
- A breakdown below **0.8722** could accelerate further downside, extending losses towards lower psychological levels.
- A potential pullback may occur if buyers step in at support, but the overall bearish structure remains intact unless a significant reversal signal appears.
**Conclusion:** USD/CHF remains under bearish pressure, with a high probability of further declines. Traders should monitor price action at support for potential continuation or reversal signals before committing to new positions.

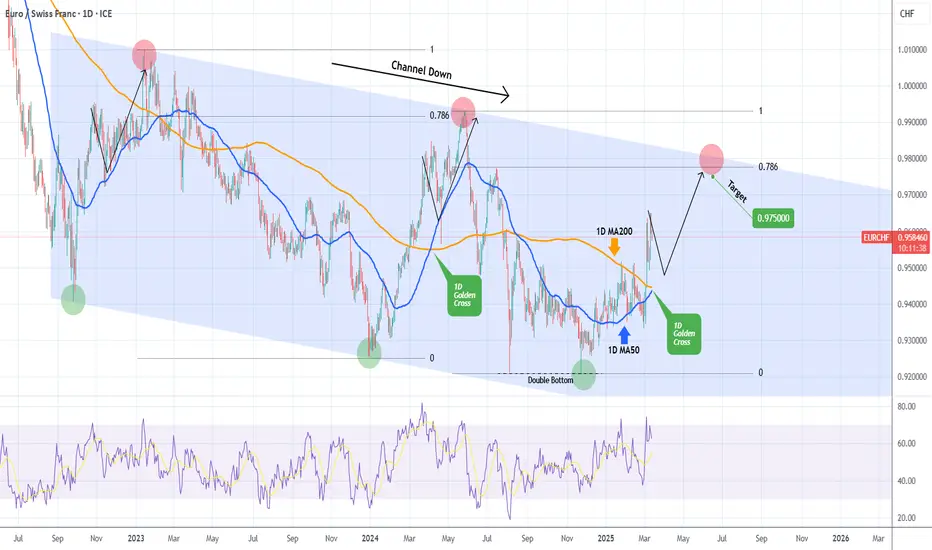
EURCHF 1D Golden Cross for one final push.The EURCHF pair has been trading within a 2.5-year Channel Down pattern and is currently on the latest Bullish Leg that is about to complete a 1D Golden Cross. The last Golden Cross was also during the previous Bullish Leg and caused an initial pull-back that was followed by the pricing of the Channel's Top on the 0.786 Fibonacci level.
As a result, be ready to buy on the next 1D MA50 (blue trend-line) contact and target 0.97500 (just below the 0.786 Fib).
-------------------------------------------------------------------------------
** Please LIKE 👍, FOLLOW ✅, SHARE 🙌 and COMMENT ✍ if you enjoy this idea! Also share your ideas and charts in the comments section below! This is best way to keep it relevant, support us, keep the content here free and allow the idea to reach as many people as possible. **
-------------------------------------------------------------------------------
💸💸💸💸💸💸
👇 👇 👇 👇 👇 👇
SHORT ON EUR/CHFEUR/CHF is currently at a major resistance level and his recently mitigated a FVG sitting in the same zone.
Price has been rising in what seems like forever on this pair, we finally have gotten our change of character (choc) to the downside with sweeps of liquidity and fvg's now balanced out.
I expect price to fall to the next demand level where plenty of liquidity sits.
I am selling EUR/CHF now looking to make over 200 pips to the downside.

USDCHF BUY NOW!!Nice wyckoff distribution, we can see price now heading higher, structure indicate buying pressure is coming in the market!!!
Nice risk to reward!!! see you later

USDCHF: Channel Down bottomed. Buy opportunity.USDCHF turned oversold on its 1D technical outlook (RSI = 30.423, MACD = -0.005, ADX = 28.684), hitting the LL bottom of the Channel Down. The 4H RSI has made a Double Bottom and this is technically an ideal level to start buying the pair again. We expect a +2.60% rise like the late January bullish wave that will test the 4H MA200. The trade is long, TP = 0.89900.
## If you like our free content follow our profile to get more daily ideas. ##
## Comments and likes are greatly appreciated. ##

USDCHF - NEW BREAKDOWNHello Traders !
On Friday 10 January, The USDCHF reached the resistance level (0.91469 - 0.92244).
The price broke the support (0.89137 - 0.89330).
This key level becomes a new resistance !
So, I expect a bearish move📉
_______________
TARGET: 0.87900🎯

USD/CHF Poised for a Bullish Reversal at Key SupportThe USD/CHF pair is currently trading near a significant support level around 0.8950, with bullish signals emerging. The harmonic Bat pattern suggests a potential reversal, aligning with historical price reactions at similar levels. Additionally, the presence of green buy markers and RSI indicators approaching oversold conditions indicate possible upward momentum.
If price sustains above the 0.8950 region, a bullish move towards 0.9000 and beyond could unfold, with further resistance around 0.9120. Confirmation of reversal signs, such as bullish candlestick formations and RSI divergence, will strengthen the case for a recovery.

CHFJPY - Continuation to the downside?Looking at the CHF/JPY currency pair, the price action shows a clear downward trend since late January 2025, with consistently lower highs and lower lows. The recent bounce from the 166.00 area appears to be a corrective move rather than a trend reversal, suggesting a higher probability of continued downside momentum.
However, traders should exercise caution as price approaches the marked blue box zone around 167.00-167.50. This area could act as a support level and potentially trigger a temporary bounce or consolidation. Still, given the overall bearish structure, any rebounds from this zone might present new opportunities for short positions, provided proper risk management is implemented.

SHORT ON GBP/CHFNice Market structure change from up to down on GBP/CHF
I am selling to the next level of support.

EURCHF Last bearish sequence of the Channel Down.The EURCHF pair has been trading within a +2 year Channel Down pattern since the September 26 2022 Low and has lately found its price action ranging within the 1D MA200 (orange trend-line) and 1D MA50 (blue trend-line).
We are currently on the pattern's 2nd Bearish Leg and based on the 1D RSI's Higher Highs, we are in symmetrical terms on a High like November 17 2023. That was the price's last Lower High before the Bearish Leg bottomed on the 1.236 Fibonacci extension.
As a result, we remain bearish on EURCHF, targeting 0.91000 (Fib 1.236 ext).
-------------------------------------------------------------------------------
** Please LIKE 👍, FOLLOW ✅, SHARE 🙌 and COMMENT ✍ if you enjoy this idea! Also share your ideas and charts in the comments section below! This is best way to keep it relevant, support us, keep the content here free and allow the idea to reach as many people as possible. **
-------------------------------------------------------------------------------
💸💸💸💸💸💸
👇 👇 👇 👇 👇 👇
