EURCHF - Symmetrical Triangle PatternHello Traders !
After a Huge Bearish Move,
The EURCHF Price Formed a Symmetrical Triangle Pattern.
The Resistance Line is Broken.
So, I Expect a Bullish Move📈.
-----------
TARGET: 0.94140🎯
Swissfranc

Swiss Franc to R23.70 in 2024? InsaneAs we know. The rich get richer.
The poor get poorer.
Well a rich and sustainable economy like Switzerland (one of the most expensive countries to live) is showing major strength for the Swiss Franc.
We are seeing a Cup and Handle form. The price broke above the brim level, came back down and jumped up.
This conservative entry is where all the demand and buying kicked in for the CHF.
So with the price above 200MA and with the upside momentum with CHF, we could see the target at R23.73

USDCHF - Price can try break resistance level and continue riseHi guys, this is my overview for USDCHF, feel free to check it and write your feedback in comments👊
A not long time ago price made strong downward impulse from resistance area, which coincided with $0.8550 level.
CHF declined even support level to support line, and at once bounced back, but soon repeated this movement again.
Then price finally broke $0.8420 level and rose to resistance level, after which it bounced and a short time later fell to support line.
Next, Swiss Franc bounced up from this line, made fake breakout of $0.8550 level, and then declined back.
At the moment, I think that CHF can reach resistance level again and try to break it, after which price can make a retest.
After this, Swiss Franc will bounce and continue to move up to $0.8600 level.
If this post is useful to you, you can support me with like/boost and advice in comments❤️

Top 7 inflation-induced trading opportunities this weekThis week, the focus of many traders will be on US inflation data, which will provide valuable insights into the Federal Reserve's monetary policy outlook.
The forecasts indicate a potential 0.2% increase in both headline inflation for December and the core rate. On an annual basis, the headline inflation rate is anticipated to rebound to 3.2% from November's five-month low of 3.1%. Meanwhile, the core rate is likely to ease to 3.9%, the lowest since May 2021. This crucial data will be released on Thursday.
In the midst of the US inflation focus, there are noteworthy inflation data releases from other countries, including Switzerland, Australia, Mexico, Brazil, China, India, and Russia. This diverse set of data presents many potential trading opportunities for USD pairs throughout the week:
Monday: Switzerland Inflation Rate
Tuesday: Australia Monthly CPI Indicator
Tuesday: Mexico Inflation Rate
Thursday: Brazil Inflation Rate (before US inflation data)
Thursday: China Inflation Rate (after US inflation data)
Friday: India Inflation Rate
Friday: Russia Inflation Rate

GBPCHF TO FORM NEW YEAR LOWSGBPCHF is projected to reach 1.06913 as we can spot a bearish continuation pattern, so we expect price to break that support zone, retest it and sell to 1.06913.

AUDCHF Triangle waiting for the break-out.The AUDCHF pair is trading within a Triangle pattern since August with the 1D MA200 (orange trend-line) acting as the Resistance, having consecutive near rejections in December. If that breaks, we expect an aggressive bullish run towards Resistance 2, despite the presence of Resistance (0.952625). In that case, we will buy the break-out and target 0.61500 (just below Resistance 2).
If however the Triangle breaks downwards first, we will wait until the price breaks below Support 1 (0.560685) and target 0.54000 (-9.09% from the recent high, which was a standard decline in 2023). This scenario is quite likely to take place as the 1D RSI has been trading within a Channel Down, showcasing a Bearish Divergence.
-------------------------------------------------------------------------------
** Please LIKE 👍, FOLLOW ✅, SHARE 🙌 and COMMENT ✍ if you enjoy this idea! Also share your ideas and charts in the comments section below! This is best way to keep it relevant, support us, keep the content here free and allow the idea to reach as many people as possible. **
-------------------------------------------------------------------------------
💸💸💸💸💸💸
👇 👇 👇 👇 👇 👇

Swiss Franc can break resistance level and then make retestHello traders, I want share with you my opinion about Swiss Franc. By observing the chart, we can see that the price a few days ago and started to trades in the range, where it first declined to the 0.8910 resistance level, which coincided with the seller zone and the bottom part of the range. After this, CHF rebounded from this level to top part of the range, but when it reached this area, the price rolled down back. Next, the price exited from the range and entered a downward channel, where it broke the 0.8910 level and a short time later declined to support line of the channel. Then Swiss Franc bounced from this line and rose to the resistance line, where it at once rebounded and continued to decline to 0.8500 current resistance level. After the price fell to this level, CHF broke it and declined to 0.8330 points, after which it started to rise to this level. At the moment, the price trades close to the resistance level and I think that the Swiss Franc can break this level, and at once make a retest. After this, CHF will continue to move up, so I set my target at the 0.8700 level. Please share this idea with your friends and click Boost 🚀

✅NZD_CHF WILL GO DOWN|SHORT🔥
✅NZD_CHF went down and
Up sharply and is now retesting
A horizontal resistance level
Of 0.535 from where I think
We will see a local move down
SHORT🔥
✅Like and subscribe to never miss a new idea!✅

CHFJPY - Double Bottom 📈Hello Traders !
On The Daily Time Frame, The CHFJPY Price Reached a Support Level (162.202 - 161.259)
The Price Formed a Double Bottom Pattern.
Currently,
The Neckline is Broken.
So, I Expect a Bullish Move📈.
Let's Wait for Retest...
---------
TARGET: 169.200🎯

USDCHF: Time For Pullback 🇺🇸🇨🇭
USDCHF is going lower.
Ahead, I see an important zone of confluence.
Analyzing a weekly time frame we see a horizontal support around 0.835 level
based on the 8 years low.
The underlined green structure matches perfectly with a completion point
of a harmonic abcd pattern.
I believe we're going to see a pullback soon.
Watch lower time frames and look for a confirmation.
❤️Please, support my work with like, thank you!❤️

HelenP. I Swiss Franc can rebound down from resistance zoneHi folks today I'm prepared for you Swiss Franc analytics. A not long time ago price rebounded from resistance 2, which coincided with the resistance zone and tried to rise, but CHF failed and in a short time declined back. After this, the price broke resistance 2 and continued to decline inside the downward channel, where it later fell to resistance 1, which coincided with one more resistance zone. Then the Swiss Franc bounced from this level and some time traded near, but a few moments ago it broke this level too and fell to the support line of the downward channel. Also recently, CHF rebounded from this line and rose to the resistance zone, where it continues to trades to this day. For my mind, the Swiss Franc can make one more movement up inside the resistance zone, and then the price will continue to move down to the support line of the downward channel. That's why I set my target at the 0.8500 level, which is near the support line. If you like my analytics you may support me with your like/comment ❤️

STRONG SUPPORTThere is an active position set at strike 1.145 for the second day in a row. The portfolio consists of naked puts, and the volume for the current contract is already significant. The synthetic formula enables the owner to take a long position with zero risk when the price reaches the specified strike.
!!!!!We consider this level a strong support level when reached. !!!!!!!
Currently, there are no grounds for opening short positions. Keep in mind, the portfolio's appearance at the strike does not guarantee that the price will move in its direction.

CHFJPY Breaking above the 1D MA50 and confirming the buy.The CHFJPY pair hit our 169.100 bullish target, after the 1D MA50 (blue trend-line) held, as presented on our November 06 call (see chart below):
The current Bullish Megaphone that it has been trading in, has been very consistent. The recent Higher Low was made on the 0.786 Fibonacci retracement level such as the October 03. That was the first buy signal but now that the price is breaking above the 1D MA50 (needs to also close the candle above), we have the confirmation. On top of that, the 1D MACD is about to form a Bullish Cross.
The previous Higher High was priced exactly on the -0.236 Fibonacci extension so as a result we will target the new -0.236 Fib at 172.500.
-------------------------------------------------------------------------------
** Please LIKE 👍, FOLLOW ✅, SHARE 🙌 and COMMENT ✍ if you enjoy this idea! Also share your ideas and charts in the comments section below! This is best way to keep it relevant, support us, keep the content here free and allow the idea to reach as many people as possible. **
-------------------------------------------------------------------------------
💸💸💸💸💸💸
👇 👇 👇 👇 👇 👇

Swiss Franc can leave pennant and continue to grow to 0.8760Hello traders, I want share with you my opinion about Swiss Franc. Looking at the chart, we can see how the price a few days ago rebounded from the seller zone, which coincided with the 0.8760 resistance level and declined until the support level. After this, the price rebounded and started to rise in an upward channel, where it rose to the resistance line, thereby breaking the 0.8760 level, but later it bounced from this line and fell to the support line. A few time later Swiss Franc tried to rise higher than the seller zone, but failed and declined to the support level, which coincided with the buyer zone and even fell lower than this zone. Also, the price exited from the channel and entered to the pennant, in which CHF rebounded from the support line and rose to the resistance line, breaking the 0.8670 level. At the moment price continued to trades near the resistance line and I think that price can fall to the support line and then rebound up higher than the resistance line, thereby exiting from the pennant. After this, the Swiss Franc can continue to move up to the 0.8760 resistance level, so I set my target at this level. Please share this idea with your friends and click Boost 🚀

EURCHF Technical Trends and SNB Policy DynamicsLooking ahead to the upcoming week, our strategic focus centers on EURCHF, as we actively evaluate a potential buying opportunity within the 0.94600 zone. The technical analysis reveals that EURCHF has been consistently advancing in an uptrend, showcasing a noteworthy upward trajectory. Currently, the currency pair is in the midst of a correction phase, steadily approaching the critical 0.94600 support and resistance area.
Adding a numerical dimension to our assessment, let's consider the recent policy decisions by the Swiss National Bank (SNB) from December 15, 2022, to the most recent update on September 21, 2023. The SNB initiated a significant shift by setting the interest rate at -0.25% on September 22, 2022, and has since made subsequent adjustments. The recent decision last Thursday, on September 21, 2023, reflects the SNB's choice to maintain interest rates unchanged, citing a backdrop of easing inflation.
This dovish stance by the SNB not only aligns with the technical analysis pointing towards a correction in EURCHF but also sets the stage for a potential continuation of CHF weakness. The confluence of technical indicators, recent policy decisions, and numerical data heightens our interest in monitoring EURCHF for a buying opportunity. As we progress through the upcoming week, our strategic approach is to navigate and capitalize on the evolving market dynamics, leveraging the identified buying potential within the specified numerical zone.

Double top at the resistanceAnother double top, looks like is going down. SL if a daily candle closes above the trendline. The GBP is struggling across the board.

Wants to go upPair is accumulating over and important support (blue line) and forming an inverse HS. I just opened a long position, If it pulls back I'll add. I wants to break out, is just a matter of time.

EURCHF Rebound expected.The EURCHF pair stayed within the long-term Channel Down, got rejected on its top after our November 02 sell call (see chart below) and effectively hit our 0.941850 target:
Despite having more downside to drop it below Support 2, we expect a medium-term rebound as the 1D MACD is very close to posting a Bullish Cross, which within this Channel Down has been a buy signal that always sends the price back to at least the 0.5 Fibonacci retracement level. As a result we have an immediate target at 0.9545.
We can't overlook the potential for a Rectangle pattern emerging, with the price targeting Resistance 1, if it breaks above the 1D MA200 (orange trend-line).
-------------------------------------------------------------------------------
** Please LIKE 👍, FOLLOW ✅, SHARE 🙌 and COMMENT ✍ if you enjoy this idea! Also share your ideas and charts in the comments section below! This is best way to keep it relevant, support us, keep the content here free and allow the idea to reach as many people as possible. **
-------------------------------------------------------------------------------
💸💸💸💸💸💸
👇 👇 👇 👇 👇 👇

GBPCHF: Bearish Rally Continues 🇬🇧🇨🇭
Update for GBPCHF.
We spotted a confirmed bearish breakout of a support of a horizontal range on a daily.
After a deep retest of a broken structure, we see a strong bearish reaction.
The fall will most likely continue, at least to 1.094
❤️Please, support my work with like, thank you!❤️

✅CAD_CHF BEARISH BIAS|SHORT🔥
✅CAD_CHF is going up to retest a horizontal resistance of 0.650
Which makes me locally bearish biased
And I think that we will see a pullback
And a move down from the level
Towards the target below at 0.645
SHORT🔥
✅Like and subscribe to never miss a new idea!✅

USDCHF: Turned bullish again.USDCHF is technically bearish on the 1D outlook (RSI = 38.319, MACD = -0.005, ADX = 47.617) and the long term pattern remains a Channel Down but the 1D MACD has formed a Bullish Cross. Since August 2022, 3 out of 4 such formations under 0.000 have initiated strong rises. Consequently, at least on the medium term, we regard this formation more dominant than the Channel Down.
We can see a Channel Up emerging but in order for that to be sustainable, the Channel Down's top needs to break. Thus, we are only going to target its top (TP = 0.8950). This trade gets invalidated if the price crosses under the bottom of the Channel Up (short then TP = 0.8555).
See how our prior idea has worked:
## If you like our free content follow our profile to get more daily ideas. ##
## Comments and likes are greatly appreciated. ##

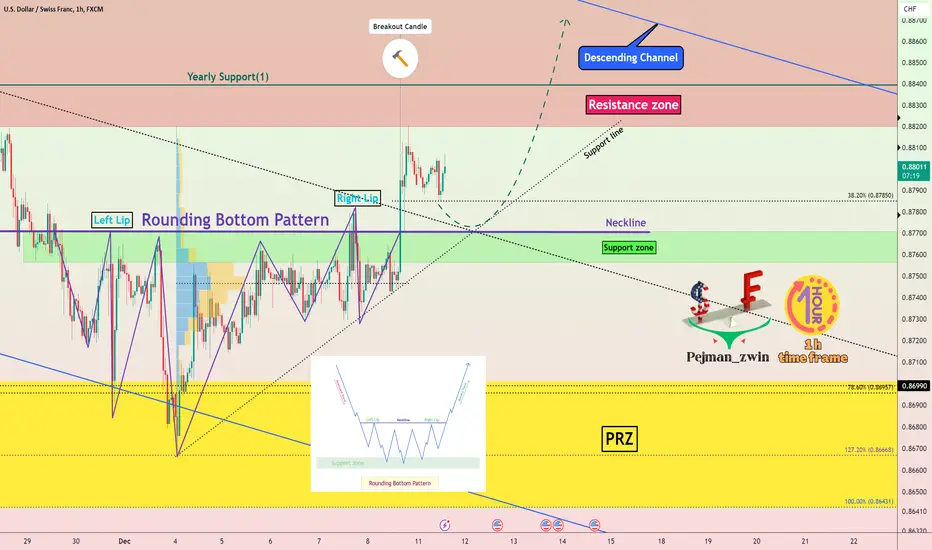
USDCHF is ready to Jump by Rounding Bottom Pattern🚀🏃♂️ USDCHF has been moving in the Descending channel for a long time, but USDCHF started to increase by hitting the 🟡 Price Reversal Zone(PRZ) 🟡and managed to form a Rounding Bottom Pattern .
🔔I expect USDCHF to move at least to the upper line of the descending channel and possibly break the descending channel as well.
U.S.Dollar/Swiss Franc ( USDCHF ) 1-hour time frame⏰.
Do not forget to put Stop loss for your positions (For every position you want to open).
Please follow your strategy; this is just my idea, and I will gladly see your ideas in this post.
Please do not forget the ✅' like '✅ button 🙏😊 & Share it with your friends; thanks, and Trade safe.
CAD-CHF Strong Resistance Ahead! Sell!
Hello,Traders!
CAD-CHF made nice bullish
Move up but a strong
Horizontal resistance is ahead
At 0.6494 from where I think
We will see a bearish reaction
Sell!
Like, comment and subscribe to help us grow!
Check out other forecasts below too!
