sxp usdtsxp usdt forming ascending triangle. breaout point is 3.588 and the 1st tp will be 3.95. if it break down the patrren then its invalid
SXP

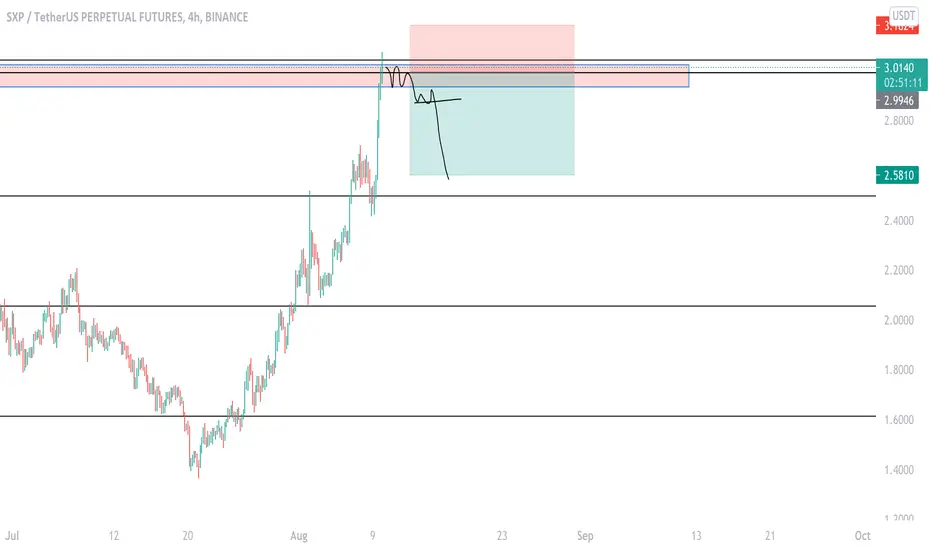
$SXPSXP has gained massively lately and see where it has landed. Right into the monthly, weekly and daily resistance area. I don't rule it out squeezing higher but the risk-reward is good enough for me to enter a trade. Ofcourse the problem with buying wicks is that you don't get a confirmation on a breakdown but it's more suited to my risk profile. Therefore if you wanna play it safe wait for a break below and retest of the red resistance area and then short. Inversely a break above this red area would be a long into the green box.
$SXP, trying to break range-highs...$SXP
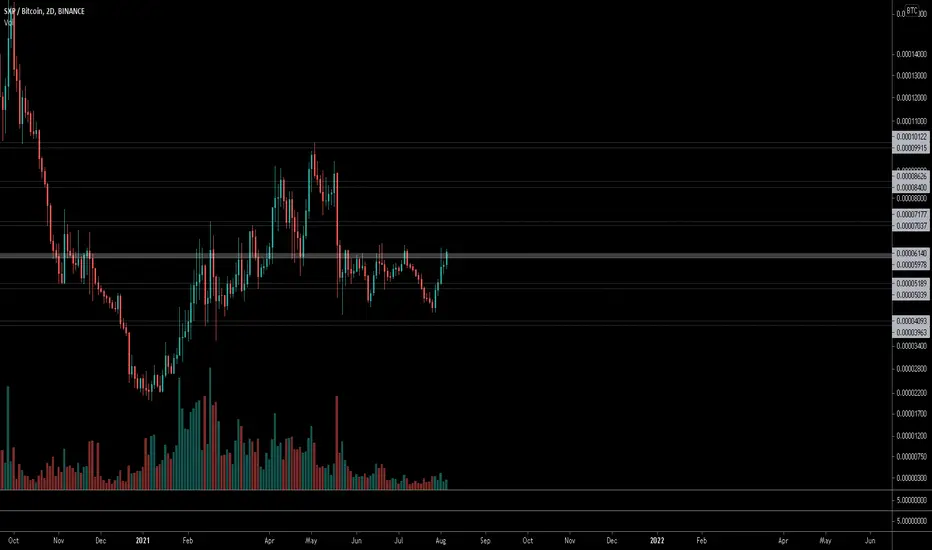
Similar to BTC, trying to break range-highs where it has been bouncing since May..
UCTS indicator turning bullish across multiple timeframes 1D/2D (and lower)
From here, looking for a breakout/volume above ~6200 sats as signal of continuation
#SXP
SXP/USDT moved toward our prediction and target. what's Next?Hi every one
SXP / TETHERUS
(UPDATE)
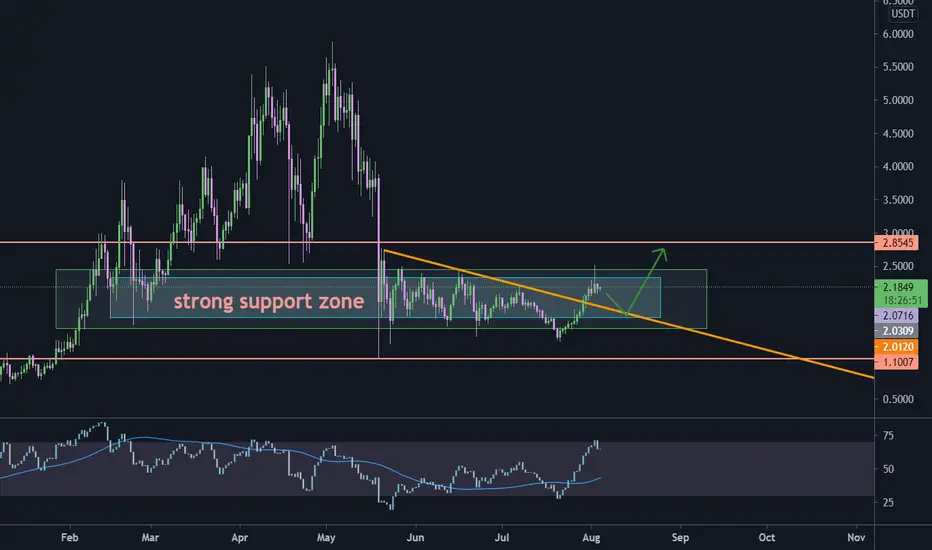
this is an update on the recent analysis of SXP/USDT which now you can see that the price has moved in the direction we predicted! the price has 3 bearish signs right now:
1-the price has touched the top of the broadening wedge pattern and Decreased from that point!
2- a shark pattern is pretty visible on the chart which has just been completed and now it's time for correction.the correction can be up to 0.618 or 0.78 line of Fibonacci retracement (strong support zone)
3- there is a regular bearish Divergence on MACD as well (-RD)
so these signs makes us think that the price must start to decrease from this point. the correction can be up to 1.6 or even the bottom of the broadening wedge. there is a slight chance that SXP would break the broadening wedge if it happens the price can increase to 3$ which is a Pretty strong resistance as well.
summery:
-SXP/USDT has moved in the direction of our prediction and touched our target!
-Multiple bearish pattern and signs!
strong support at 1.60$
-slight bullish chance to 3$
Previous Analysis:
💎Traders, if you liked this idea or have your opinion on it, write in the comments, We will be glad.
Thank you for seeing idea .
Have a nice day and Good luck

SXP with strong bullish trend on 4h“The trend is your friend” is one of the best known sayings, although it’s message is incomplete. The full version should be, “The trend is your friend, until the end when it bends.”
SXP is moving bullish above trendline, my first target is $3.4 and after that $4.48. SL if it falls under trendline.

SXP Possible move's in midtermSXP breaks a long downtrend and if the price stabilizes can move upwards towards the targets.
Currently, due to the increase in the bitcoin range and its movements, all altcoins will be affected by it. The analysis is just a series of probabilities.
I hope you find this analysis useful🌹
Follow for more...
#DYOR

SXP is heading for another bull rally hiii crypto lovers i was going through my check list and realised sxp has broke the resistance and now its a free bird flying towards 3.5$ if breaks next target 5.14 for long term i am seeing it hitting 12-16$ by next year feb. Best possible entry could be 1.99 if it dropped but i dont think it will before hitting 3.55 so its right time for long entry is what i believe. GOOD LUCK

SXP try to break the upper line of sideway zone#SXPUSDT
$SXP is still inside a sideway zone and rejected from upper line of this zone.
#SXP can go down to confirm the broken resistance as support, then start a strong rally to break out this zone.
SXPUSDT🌟in lower time frames this alt shown a great bullish state which is abnormal in the current situation which means this alt is ready to jump high numbers of value in a short time so heads up swingers and profit hunters
👉This idea has the confirmation of "advanced price action" 👍
👉For more information don't be shy and get in private chat of trading view 👍
👉Hit share and spread the information in public chats or your twitter for everybody to get profit 👍


a future call for sxp dont use your full portofoli in this trade . trade with tight stoploss thats why i didnt given stoploss .use 5X or less.

SXP - BTCOk, $SXP. Promising as ever, strong fundamentals but still not pumped like many others after the May bear dip. For first time its now consolidating above the last fib level (fib retrace from last low 23rd May to last high 3rd May) and not falling through it again. This is a good sign iyam. Long term def good entry point, short term as well but more conf if it breaks and holds that resistance around 5909. Touched 5 times in last months.

SXP/USDTTARGETS:
Short Term: 1.97 - 2.02 - 2.18
Mid Term: 2.35 - 2.50 - 2.70 - 2.95 - 3.22
If you liked my idea, follow me for more.

#SXP Ascending Triangle - waiting for a breakout#SXP/BTC
Ascending Triangle on SXP. Waiting mode for a breakout.

$SXPUSDT UPDATE!!!!!Hi Traders,
$SXP has seen some lovely gains recently but is now seeing a major pullback. Its currently rejection an order block as support so we are likely to see it rise into the above order block where it will test as resistance. If the order block above acts as enough liquidity to push prices lower again then we can expect prices to move towards the very bottom order block.
Thanks
MS
⬇️⬇️⬇️⬇️⬇️⬇️⬇️⬇️⬇️⬇️⬇️⬇️⬇️⬇️⬇️⬇️⬇️⬇️⬇️⬇️⬇️⬇️⬇️⬇️⬇️⬇️⬇️⬇️⬇️⬇️⬇️⬇️⬇️⬇️⬇️⬇️⬇️⬇️⬇️⬇️⬇️⬇️⬇️⬇️⬇️⬇️⬇️⬇️⬇️⬇️⬇️⬇️⬇️⬇️⬇️⬇️⬇️⬇️⬇️⬇️⬇️⬇️⬇️⬇️⬇️⬇️⬇️⬇️


SXP to $2.50 short term$SXP now $1.97
Targets
2.02, 2.07, 2.13, 2.22, 2.34, 2.45
NOT FINANCIAL ADVICE

SXP Possible move's in short termCurrently, due to the increase in the bitcoin range and its movements, all altcoins will be affected by it. The analysis is just a series of probabilities

Falling wedge idea Entry: $2.203
Stop loss: $1.335
Take profit: $5.225
2 day MACD bullish signal cross.

