SXP about to go Pumpina!!!Sxp has reformed 0.3185 support, tested the Psi High and about to test 0.38
Leverage 20x
SXP

Neutral Market Sentiment with Potential for Bullish BreakoutThe SXP coin is currently trading at 0.3456. Taking into account various indicators and Fibonacci levels within a 4-hour timeframe, we can assess the market sentiment.
The Relative Strength Index (RSI) is at 60, indicating a neutral territory. This suggests that the coin is not currently overbought or oversold, providing a balanced market sentiment.
Examining the moving averages, the EMA 50 is at 0.3360, indicating a short-term bullish sentiment as the current price is above this level. On the other hand, the EMA 100 stands at 0.3563, suggesting a long-term bearish sentiment as the price is below this moving average.
The Moving Average Convergence Divergence (MACD) has a value of 0.0052. Although it indicates a relatively weak bullish momentum, positive MACD values overall suggest an inclination towards a bullish sentiment.
Considering Fibonacci retracement levels, we can identify potential support and resistance levels. The 0 Fibonacci level at 0.3028 could act as a significant support level, followed by the 0.5 Fibonacci level at 0.3243. Conversely, the 1 Fibonacci level at 0.3458 may serve as a crucial resistance level.
Combining these indicators and levels, we can discuss possible scenarios:
Bullish Scenario:
If the price breaks above the resistance level at 0.3458 and confirms the breakout, it could signal a bullish scenario. In this case, the price might continue to rise, potentially targeting higher resistance levels.
Bearish Scenario:
Should the price fail to surpass the resistance level at 0.3458 and begins to decline, a bearish scenario might emerge. The price could find support at the Fibonacci levels, particularly at 0.3243 and 0.3028.
It is essential to note that cryptocurrency markets are highly volatile and influenced by various external factors. Conducting thorough research, considering additional indicators, and analyzing market trends are crucial before making any trading decisions.

SXP/USDT Bulls Take Charge..?!!👀 sxp today analysis💎Currently, SXP is trading within a wedge pattern, following a strong trendline and the exponential moving average of 200.
💎Due to market uncertainty in recent days, SXP has experienced significant price fluctuations. At present, SXP is in a high-demand zone.
💎 If it breaks the tight wedge pattern and maintains price momentum at EMA 200, it is ready for a substantial bullish move.
💎if the price fails to hold a strong support area, it might result in another lower low in the downward direction.
💎In the ever-changing crypto universe, staying updated and adaptable is essential. Stay tuned for more updates and enjoy your trading journey!

Sxp Looks ready For Massive bullish wave Seems Like ready for another Bullish impulse Falling wedge breakout has already confirmed expecting 70 to 80% Bullish wave

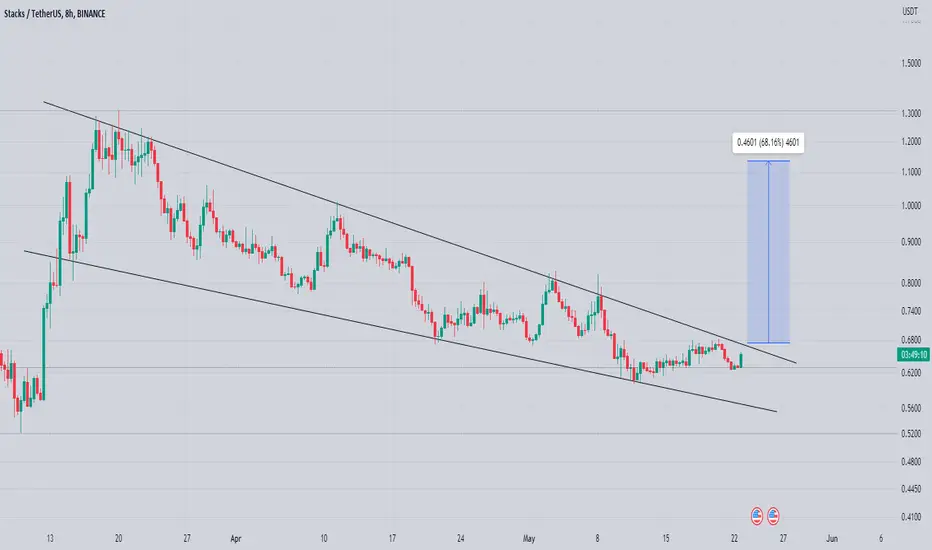
Stx Getting Ready For Massive Bullish impulse Seems Like getting Ready For Upside Continuation formed Falling Wedge In h8 Timeframe Incase Of Breakout expecting 65 to 70% bullish Wave

SXPthis is intended to be checked on 1m chart or even better on 1s, the main idea still remains
if lower than 0.5468
T: 0.4639

SXP LongSXP is about to break out from the wedge. We also can see Bullish Divergence.
You can place your stop-loss under 0.52.
All target are on the graph.

Sxp Looks Ready For Another Bullish impulse seems Like Sxp Looks ready For another Bullish Impulse Bullish Pennant In h4 Timeframe Has Already Confirmed Expecting Move towards 1$

SXP coin formed a bullish BAT for upto 17.50% moveHi dear friends, hope you are well and welcome to the new trade setup of SXP coin with US Dollar pair.
Previously we caught almost 88% pump of SXP as below:
Now on a 2-hr time frame, SXP has almost completed a bullish BAT move for next price reversal.
Note: Above idea is for educational purpose only. It is advised to diversify and strictly follow the stop loss, and don't get stuck with trade

SXP can make such correctionHi, dear traders. how are you ? Today we have a viewpoint to sell/buy the sxp symbol.
Pay attention to the support and resistances drawn
For risk management, please don't forget stop loss and capital management
When we reach the first target, save some profit and then change the stop to entry
Comment if you have any questions
Thank You

Sxp getting ready for Another Bullish impulse Seems Like Sxp Getting Ready For Further Continuation Forming Falling Wedge Incase Of Breakout expecting Another 50 to 55% bullish Move


SXP, accumulation have started. Upside on queue.SXP, has seen buyers accumulating at the current levels -- touching a strong order block support again at .55
Expect reversal to the upside from this price point.
SEEDED L at 0.570
TAYOR.

SXP H1 Analysis | Possible Bullish Move IncomingSXP is currently moving in a descending channel within a triangle pattern. If it holds the 0.5950 level, a bullish move to the upside is expected.
Manage your risk and do your research before trading.


🔥 SXP Uptrend Confirmed After Major Sell-OffIn my latest SXP analysis I talked about my expectations of a reversal after seeing some bearish price action. My initial support area was not as strong as I thought initially. However, after reaching the 0.50 area there were ample investors waiting to step back in.
On the chart you can clearly see a pattern of higher-highs and higher-lows. I think that there's still more gains to be had in this move.
Targets in blue.

SXP : TREND VIEWSXP shows increase trend patterns.
We will follow the coin to see if its able to confirm the coming time.

SXPUSDT SUPPORT BOUNCE LONGAs we can see here, we saw a two possible for confirmation of support. knowing that in mind, we can long here and place sl at lower highs and tp in the previous 0.5 fib

SXP, a re-attempt of top (reversal) on queue.SXP will re-attempt to visit the recent peak from here on after touching the initial demand area levels at 0.67
Expect some significant bounce.
TAYOR.

SXP coin formed a bullish Shark for upto 39% pumpHi dear friends, hope you are well and welcome to the new trade setup of SXP coin with US Dollar pair.
Previously we caught more than 88% pump of SXP as below:
Now on a 4-hr time frame, SXP has formed a bullish Shark move for another price reversal.
Note: Above idea is for educational purpose only. It is advised to diversify and strictly follow the stop loss, and don't get stuck with trade

SXP one more try 30%+SXP one more try
I think it needs to trade 0.68 - 0.72 for a few days and then we will see another up move

🔥 SXP: Scouting Oversold BounceSXP has been one of the major winners of the last few weeks, where it gained well over 270% in a very short amount of time.
However, it appears that SXP has topped for now.
I'm waiting for the first hourly oversold reading to occur before scouting an entry. Ideally, we will get in the yellow area of resistance before reversing.
Targets in blue.
