SXPBTC

SXP break out soon ?? 📢 Hello Traders. Hope you are having a brilliant day.
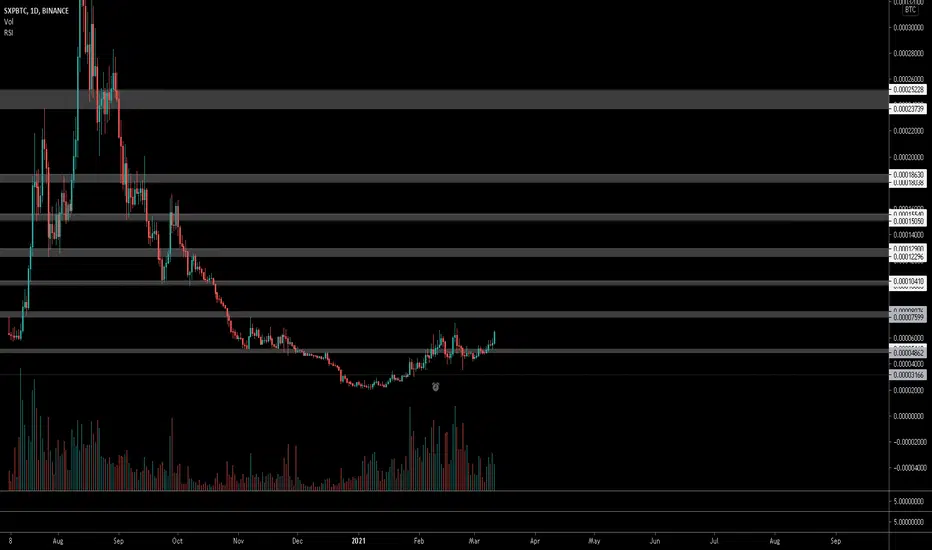
Well, I want to talk about SXP on 4H chart. As you can see, price lately broke the yellow resistance line with a nice green candle. What now?
I think price is going to make a compression under the purple resistance which is ATH and then breaks out.
Best buy positions are :
1) Pullback to the yellow line ( around 4.5$) 2) When it breaks the purple resistance and consolidates above or pullbacks to it.
🚩 Always remember to put stop loss for your orders in order to reduce the risk of your trades.
🚩 Always keep an eye on BTC chart as well because it can affect the movement of altcoins as you all know my dear traders.
If you want to check out my other analysis , I have linked them below and also don`t forget to follow me for further updates and new analysis.
Thank you guys for reading my idea on SXP and don`t forget to comment what you think. ✌


$SXP, Flashing a 1D UCTS Buy signal...$SXP
Flashing a 1D UCTS Buy signal as volume is trying to get momentum once again..
Its starts pushing up from here, looking at ~7500 sats as 1st important resistance on the way up (20%)
Upside is massive as you can see on the weekly chart
Let see how it goes!
#SXP


Cup and handle about to have SXP sent to new all time highs. Get ready. Break of resistance and clear cup and handle on SXP is about to SEND it above to a new all-time high.

SXP/USDExpecting April to be a massive month for SXP. The launch of Swipeswap had minimal effect on the price due to bad timing in relation to BTC, but I see no reason why we cant break the ATH set in July last year (in the bear market).
Prior to the extracted fractal we also saw a period of consolidation similar to the period we have had for months before this recent move - expected swipe to break the current upwards chop and spike upwards by the end of April.

SXP could fly if the channel is respectedSXPBTC could potentially fly, we've had a fake out once and it looks like we're about to retest again. If we can break above the red square, there's nothing but air and could double and almost triple.
risk/reward looks very appealing and the trend is already upwards.

SXP bouncing to 40%+SXP bouncing. As i looked at the chart, everytime SXP touched the trendline, bounced back 30-40-50%. This all depends about BTC trend, if we see BTC crashing into 48k, we might see a crash here too.

SXP/BTC LongSXP/BTC looks like it is going to make a nice move
within the coming weeks:
MA30 has bullishly crossed above the EMA100
for the first time ever and is now acting as
support.
A lovely inverse Head and Shoulders has been
printed and we can expect, once price has
confirmed the S/R flip of the neckline around
.00006791, that price will continue upward
toward the iH&S target of
.00011629
Ichimoku is bullish:
-Kumo cloud is green
-Tenkan is above the Kijun while both above the cloud
-Laggin span is above cloud and price
-Kijun temporarily acting as resistance, however
price is being squeezed between the Kijun and MA30
and with the rest of the chart looking bullish, it
seems likely Kijun resistance gives before MA30
support does

SXP/BTCThis looks like accumulation cylinder on SXP , look at the massive volumes.
currently sitting on support , as long as it holds i expect a bounce & pump hard

SXP USD - Next Support at 2.56BTC's retest of the broken trendline failed. Unfortunately for the bulls this is bearish imo.
We are into support but expecting further downside on SXP
B, HF


BTC PAIR LOOKS EQUALLY BULLISHif USDT pair looks bullish, in BTC looks even more bullish, having reclaim that key support, plenty of distance from the highs that will push the usd value even higher imo. I see no resistance till 16k sats area, just more confluence for my USDT pair position.

SXP takeoff?Looks strong on btc pair
can see that usd pair has flipped the HTF levels, flipped the resistance
hold above here should give a decent run

[SXP] is on track to track the FIB - it was on trackis on track to track the FIB - it was on track - supported by the standard handle cup model

sxp analizimdirgereksiz süslemelere gerek yok teknik ve temel analize baktım herkesin anlayabilecegi dilde sadeleştirdim SXP yön yukarı

SXPUSDT (SWIPE) - POTENTIAL BREAKOUT ANALYSIS 🔎
- SXPUSDT is printing an ascending triangle pattern.
- This is a bullish build up pattern.
- There's a breakout potential.
BUY ENTRY ⬆️
- Breakout above the ascending triangle's horizontal resistance.
TARGETS 🎯
- Fibonacci extension levels.
SETUP INVALIDATION ❌
- Breakdown below the ascending triangle's inclined support.

SXPUSDT can make cup and handle ???SXP USDT just look at the chart, just sharing my opinion with target 1 is projection of handle and target 2 is projection of cup.
do with your own risk!!

