Swipe should turn up - SXP chartI see this structure for Swipe SXP and I believe it was still correcting and completing the 4th larger wave. The RSI bullish divergence is very convincing. If thats the case we will turn up more bullish from here with a more impulsive 5th wave. This is in line with a missing smaller 5th wave for BTC as well, and that the market will turn now again bullish. The previous ath fits perfectly to the 0.618 of the w3 extension.
SXPUSDT


$ftm sxp and kava looks really good waiting for a confirmationThe Ftm sxp and kava coin compression is getting over slowly. It is breaking out in the usdt pair as well. I have marked the target. Let's see how it goes.
thank you
Crypto by Ksquare


SXPUSDTMy idea about SXP. I'm new and I could be wrong, so DON'T TRUST ME. I hope it goes up :) Have a nice day.
Yatıım tavsiyesi değildir.

BTC PAIR LOOKS EQUALLY BULLISHif USDT pair looks bullish, in BTC looks even more bullish, having reclaim that key support, plenty of distance from the highs that will push the usd value even higher imo. I see no resistance till 16k sats area, just more confluence for my USDT pair position.

SXP takeoff?Looks strong on btc pair
can see that usd pair has flipped the HTF levels, flipped the resistance
hold above here should give a decent run

SXP - BUY - SXPUSDT Long 1HAlert :
Disclaimer
Trading currencies (or any other financial market) involves substantial risk, and there is always the potential for loss. Your trading results may vary. No representation is being made that any associated advice or training will guarantee profits, or not result in losses from trading.
BARAKAT BARAYE HAME

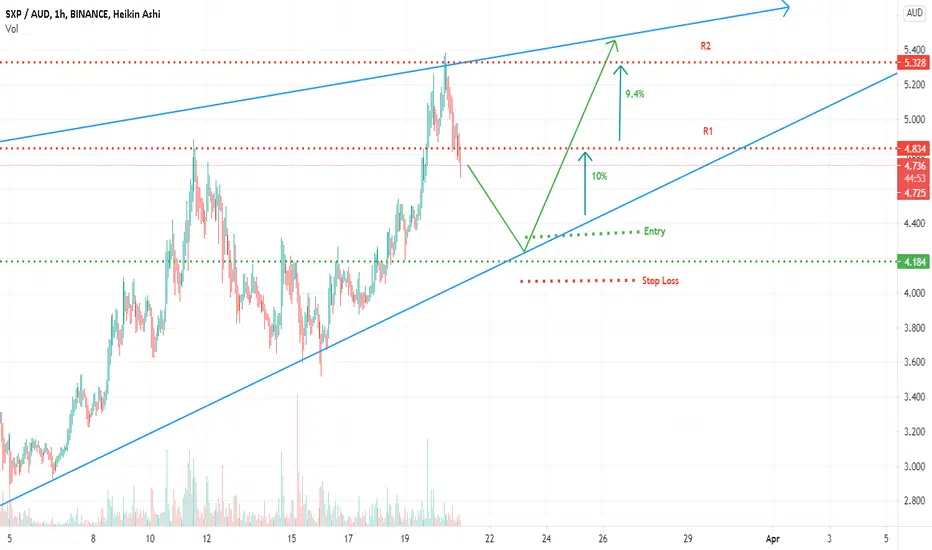
SXP AUD heading towards its Support lineOn an hourly chart, SXP shows an upward trend. It has already touched its Resistance point at 5.3 and now moving down. Mostly it will come down to its usual support level close to 4.18. If it does, then my entry will be close to 4.3 with stop loss at 4.083.
At its first Resistance level look for a profit of 10% and if breaks R1, then get ready to bank additional 9.4%. Overall potential profit range is 10 - 19%. Expecting it to come closer to its support line in 1-2 days.
Note: These are my personal notes and in no way financial advice. Do your own research before trading

Target 5.13Following 4h chart.
There is a clear cup & handle formation for new ATH.
TP1 4.15
TP2 5.13
SL 2.71
Please comment if you join the trade.

[SXP] is on track to track the FIB - it was on trackis on track to track the FIB - it was on track - supported by the standard handle cup model

sxp analizimdirgereksiz süslemelere gerek yok teknik ve temel analize baktım herkesin anlayabilecegi dilde sadeleştirdim SXP yön yukarı

SXP/USDT Update: Fully reached our >200% Target. SXP did very well the last month and gave us >200% gains.
Hope you enjoyed the ride.
After such a rally and looking at the bearish divergence (price action against volume) it looks like we get a drawback before we aim for 5$.
Possible entry zone is shown with the box.
Basic rules:
- Never buy the top/ATH
- Take profit as long as you can
- Use Stop/loss for leveraged positions
- If you are not experienced, don't leverage in the first place
Enjoy the ride and don't be too greedy.
If you like the content, please like, comment and give this channel a follow.
Always do your own research and keep in mind that my charts and comments cannot be considered financial advice.
Cheers
ps.
Chart explanation:
Main lines:
- Green lines are tested support lines.
- Orange lines are resistance lines or, if we are above, possible support lines which were not tested yet.
- Cyan line is for volume trendline.
Helplines:
- Purple lines are trendlines we take a look at.
- Yellow lines are for visual help only.
Boxes:
- Either entry zone or support zone. Check the description.

SXP/USDT is about to increase again?Hi every one
SXP / TETHERUS
there is an ascending triangle on the SXP/USDT chart which the price has broken out of it but we must see what will happen to this day's candle will it be in the triangle or not? anyway there is also regular bearish divergence(-RD) on both RSI and MACD in the 12H time frame so we can be certain that there will be a bearish movement to the upper line of the triangle at least and than the trend would continue!
if the daily candle can make the upward break out we can expect that the price would increase as much as the measured price movement.(AB=CD)
Traders, if you liked this idea or have your opinion on it, write in the comments, We will be glad.
Things can change...
The markets are always changing and even with all these signals, the market changes tend to be strong and fast!!
Thank you for seeing idea .
Have a nice day and Good luck

SXP Buy tradeSxp trying to reach previous high point. once it reaches, it wont stop there. cup and handle pattern shows the mid term target.
First target: 3.6
Second target: 4.15
Third target: 4.75
Final short term target: 5.499

SXP/USDT 1hr - Confirmed Cup/Handle - Breakout IdeaSXP has broken out of the confirmed Cup and Handle idea - looking to enter at retest, always the safest entry. SXP has had a lot of news lately and more coming at end of the month.
Set your alerts and DYOR.
Cheers


SXP - Looking very good! 5$ nextHere's a quick look at SXP 4 hr chart. This is one of the few coins that only has done 550% this bull market. SXP will be launching some new stuff such as main-net which will be a big improvement for the project. SXP Is one of those coins that still hasn't taken off yet in this bull market. I see this as one of the few coins that still got 20 to 50x left in this bull market. Its a great project for sure!
It will reach 5$ easy in its next big wave.
The idea is: Buy the breakout from the level shown in the chart and sell at the target areas shown in the chart.
Targets:
1. 5$
Follow me for daily trading setups
BTC dictates the market. If BTC goes down, then the alts will take a hit. Trade safe!

SXPUSDT (SWIPE) - POTENTIAL BREAKOUT ANALYSIS 🔎
- SXPUSDT is printing an ascending triangle pattern.
- This is a bullish build up pattern.
- There's a breakout potential.
BUY ENTRY ⬆️
- Breakout above the ascending triangle's horizontal resistance.
TARGETS 🎯
- Fibonacci extension levels.
SETUP INVALIDATION ❌
- Breakdown below the ascending triangle's inclined support.

