SXPUSDT can make cup and handle ???SXP USDT just look at the chart, just sharing my opinion with target 1 is projection of handle and target 2 is projection of cup.
do with your own risk!!
SXPUSDT


SXPUSDT Cups and Handles Pattern in act It will reach to 3.77 and after that it will take off to its previous peak which is 5+ .


SXPUSD 4HR ChartPlaying with Elliott Wave and saw a potential for a nice trade setup with MA and FIB rejection coinciding with a nice impulse wave bounce opportunity for wave 4/5.
*Not financial advice


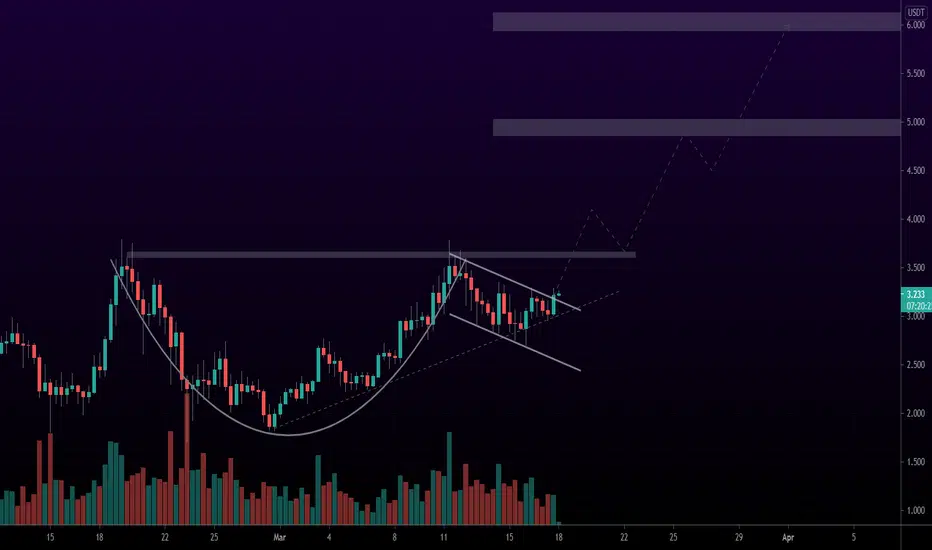
SXP getting ready to flySwipe price is now fighting against strong resistance zone. If we break this level, we can see a major pump here. In the last days we have retested strong support zone (100 EMA, support zone and bottom trendline) and gained pretty good momentum. The best entry will be after breaking and retesting the resistance - I'll be looking for an entry here. Depending on when you want to take the profits, most reasonable stop loss levels are below the current resistance or below the trendline.
(Not a financial advice)


SXP to ATH?Supply is low, weekly momentum is high.
As long as Bitcoin remains bullish, it is possible for SXP to see ATH

SXPUSDTSXP / USDT 12H
Three possibilities for "SXP" include:
1- Climbing and breaking the price ceiling 3.8
2- Suffering between the price of 2.8 to 3.8
3- Falling and breaking the support zone and taking action to reach below 2.4
The first two possibilities have a better chance
For the following reasons:
1- Support zone consisting of Ichimoku cloud, moving average, Fibonacci
2. Forming a cup and handle pattern
3- Pressure not to break the uptrend line
That passing through these is a surprising event.
what is your opinion?

SXP ( new ATH possible ?)SXP / USDT
one of coins that show strong volatility
In weekly chart we can see only growth and keep flipping strong weekly resistances into supports
If it can hold the current weekly support between
( 2.7$-2.5$ ) So we can expect another growth toward ATH or higher
If not then will test the lower support again which is less likey to happen here but also not excluded so dont let your guard down
Now i keep looking at weekly candles closure

SXP - chart does speak for itselfCup and the handle in the making right now.
Breakout should be explosive soon!


$SXP Primed to Challenge All Time HighThere is a lot going on with this chart, and it all looks bullish. First, had a perfect retrace to the .618 fib after the crazy run to start the year. $SXP bounced well from that area and challenged the local high of the $3.80 range. We have retraced and bounced off of support in the $2.75 range. It appears that we are forming a nice cup and handle pattern here.
On top of all the above, there is a bullish divergence on the RSI along with a breakout. The 4h MACD is also turning bullish. This is all pointing to a serious price increase. If we break out from this handle, we should see the $3.75-$3.80 price again. The two diagonal lines at the top of the chart are resistance from previous all time high (Wick and close). If we can close above that, I fully anticipate a $5.00 $SXP.

SXP Cup and HandleThere's been a lot of bullish news recently regarding SXP and their liquiidty pool launch. BTC chart looks great for upside as well.
Trade the breakout of the cup and handle formation.
:)

SXP/USDT Potential for Growthits not a FINANCIAL ADVISE
its just a personal IDEA
potential for growth in MA100 and MA200
Cup model has been identified
with some Price Correction , will be prepared for Break out

SXP - 5$ in the next big wave?Here's a quick look at SXP 4 hr. chart. The price action has been forming a bigger cup & handle, and in time of writing this post, the price is breaking out from the handle. Our first big obstacle will be to get through 3.8$. Keep an eye on this one.
One thing to note here is that the price has been falling as well as the volume - thats a bullish sign.
Follow me for daily trading setups
BTC dictates the market. If BTC goes down, then the alts will take a hit. Trade safe!

SXP 1H BUYAlso set some Buy orders near the Trendline
Remember no more than 5% of the deposit in one trade
SL: next sell signal

Swipe cup & handleTook a position in Swipe which shows a typical cup & handle pattern. There are currently many bullish setups in cryptoland, but rather than chasing the ones that pump, go for the ones that are about to. This is one of them.
