|Symmetrical Triangle| Squeeze in Crude OilCrude oil is currently forming a symmetrical triangle pattern, a classic squeeze formation with price compressed into a tight range. Symmetrical triangles typically act as continuation patterns, favoring the prevailing trend, and in this case, on the daily chart, the trend is well established: a bullish trend with high volume. As the dominant trend is clearly bullish, and volume has remained relatively high throughout the consolidation, it supports furthermore the potential for continuation to the upside.
On the Bollinger band the squeeze is more visible, and suggests diminishing volatility, which is often followed by expansion. Unlike earlier price action before consolidation, recent sessions are exhibiting larger candlestick bodies accompanied by pronounced wicks on both ends. Meaning adding confluence to our potential breakout. These conditions create a buildup of potential momentum in the market, exactly what fuels explosive breakouts when key levels are breached.
Though such pattern can also serve as a reversal signal when broader macro conditions shift.
But, and this is a big but, beyond the chart, the geopolitical context is intensifying. The Israel-Iran conflict continues to escalate, and with the most recent reports of direct US involvement, that is the strikes on Iranian nuclear infrastructure, the risk on crude oil is rising. The possibility of Iranian retaliation, introduces serious potential for supply disruption, as any military response or blockade would likely trigger a sharp spike in the price.
This confluence of technical breakout potential and geopolitical instability makes this setup particularly potent. If we get a confirmed breakout above the triangle and a clean close above the 77–79 zone, combined with global uncertainty and potential supply shocks, could put the $84-85 target well within reach in the near term. Beyond that, should geopolitical tension escalate, oil could accelerate toward $90 or even $100.
In short, this is a high-stakes moment. If price does break out, it won’t just be a technical move, it will ride a wave of volume, volatility, and geopolitical narrative.
With all this in mind, one should be watching closely for volume confirmation, breakout structure, and any major headlines from the Middle East as the situation develops.
Symmetrical-triangle

AUDUSD - Technical Analysis [Long Setup]🔹 AUDUSD Analysis on 1HR chart
- The current Trend is BULLISH
- there is no divergences
- Symmetrical triangle is form
🔹 Trade Plan
- Entry Level = 0.67295
- Stop Loss = 0.67058
- TP1 = 0.67546
- TP2 = 0.67791
🔹 Risk Management
- First TP is 1:1
- Second TP is 1:2
🔹 How to Take Trade?
- Only risk 2% of your portfolio
- Take 1% risk entry with 1:1 RR
- Take 1% risk entry with 1:2 RR
Like and subscribe to never miss a new idea! ✌🏼

How to Trade Symmetrical TrianglesHow to trade symmetrical triangle patterns with entries and stop levels.

Bitcoin at Symmetrical Pattern#Bitcoin 15 min. #TA at #Binance
As per #Symmetrical Pattern, and daily candlestick numerical analysis of 412111 last 10 days, today is now breaking point for Bitcoin within next 6-8 hrs.
Either it will be break towards $29k or it will be goes to $26k-27k.. Lets see, what happens today..

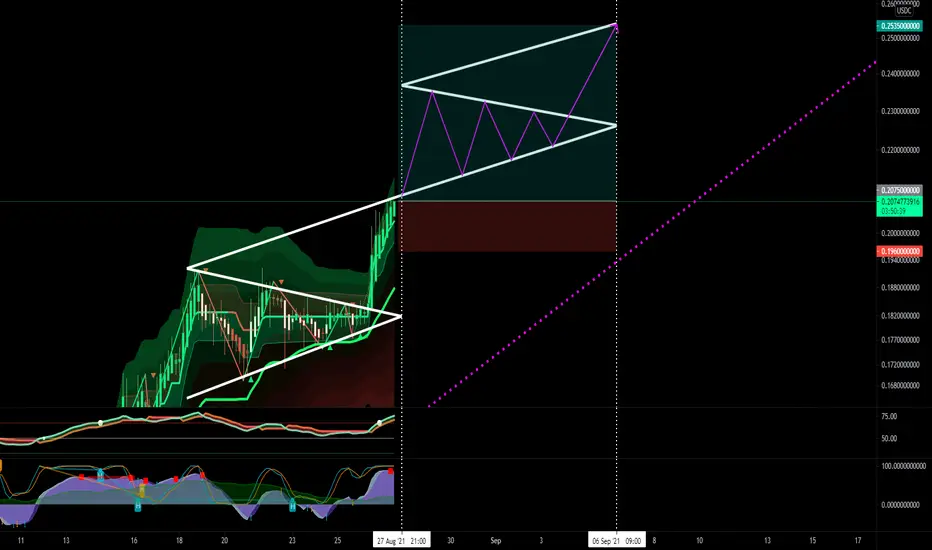
Bullish on LTOUSDT 127%Bullish on LTOUSDT on Binance
as its breaking out of a symmetrical triangle
Entry at 0.1017
Stop Loss at 0.098
TP @ 0.1054
TP @ 0.1140
TP @ 0.1247
TP @ 0.1560
TP @ 0.2074
TP @ 0.2583
TP @ 0.2903
This is not a financial advice, please do your own research!
Best of luck!

XAUDUSD SYMMETRY TRIANGLE PATTERNTriangles patterns are valid only when price closes above breakout or below breakdown levels

AES Symmetrical Triangle BuyAES has formed and broken out of a beautiful symmetrical triangle
It is still early in the break out, price could lead much higher, as suggested by the comparison to BKR
Strong Buy for AES

Gold Technical AnalysisHello, I'm a new trader and I found a symmetrical triangle in 15M time frame and I'm looking for the long position once pullback is happened. Please let me know what do you think. Thank you.

Hex 4h Repeated TriangleA possible fractal pattern that I have in mind. Will be interested to see if this one plays out.

AAPL- Triangle Breakout, Bullish- Have been watching AAPl for quite some time now (see the previous chart).
Finally approaching the end of this triangle, has bounced off the bottom trendline multiple times in addition to holding & bouncing off its 200day EMA.
- On top of approaching the end of this triangle, AAPL is squeezing on its daily chart between the AVWAP of the previous high and low with its Bollinger bands squeezing as well.
- MAs are curling while price action reclaims them (not pictured) with a huge symmetrical-triangle on its weekly chart
The bigger the base, the bigger the breakout
PT1 - $129.5
PT2 - $130.5-$131
Long Term PT $135 + Breakout.
Previous chart-

Symmetrical TriangleIf BTC fall it will fall, if BTC won't fall it should
NOTE: Tread at your own risk // just sharing my ideas

SAND at breakout level ???Will SAND breakout from here???
When we look at the SAND-USDT chart we can see that SAND sits in a symmetrical triangle which most of the time breaks out to the top.
My fist target is the 4h 200 Moving average @ 0.42 and hopefully find support on the .328 fib.
My targets for the long run:
°0.384 (.382 fib)
° 0.449 (.5 fib)
° 0.515 (.618)
° 0.608 (.786)
° 0.664 (.886)
° 0.727 (1)
Don't forget to get profit or set alerts when we hit the next fib levels.
You can always buy it back when it is tracing back to a lower support level. It will not go in one straight line up.
Also keep a close eye on BTC . If BTC starts to pump it is better to move some of your profits into BTC .
Your end goal should always be to increase your BTC amount.
Cheers and have fun.
° Be Patient – Don’t panic – Trade Emotionless.
° Never lose a winning trade. You can always get back in later.

Symmetrical Triangle - Watching closelyTechnical Analysis - Will be watching PYPL closely for it to break out of this Symmetrical-triangle. Bullish bat harmonic pattern within the triangle and a double-bottom off of the uptrend line. Some key levels to watch, personally am bullish
**Not Financial Advice**

A Short trade!in the 2H time, Ichimoku will currently suffer inside the green cloud. it can return to the trend line. it will be low risk as long as it is supported by trend line. it will probably fall from the green cloud!

A symmetrical triangle!in the 2H time, Ichimoku will currently suffer inside the red cloud. it can return to the trend line and exit the cloud. it will be low risk as long as it is supported by cloud and trend line!

A symmetrical triangle between 2 trend lines!it will be low risk as long as it is supported by trend line. by leaving the triangle, can achieve goal!

A symmetrical triangle!in the 2H time, Ichimoku will currently suffer inside the red cloud. It can return to the trend line and exit the cloud. it will be low risk as long as it is supported by cloud and trend line!

A big symmetrical triangle!in the 1H time frame, Ichimoku will currently suffer inside the green cloud. It can return to the trend line and exit the thin layer of the cloud. It will be low risk as long as it has cloud and trend line support!

A symmetrical triangle!it will soon collide with the Ichimoku Green Cloud in a H4 time frame. we are waiting for a new growth!

A bullish symmetrical triangle!After supporting and resting on the trend line, we are ready to leave the symmetrical triangle!

ICXBUSD Breakout trend 4HICXBUSD Breakout trend 4H
ICXBUSD in a very symmetrical triangle around 2 BUSD.
I am hoping for an upwards breakout, but signal tells that it can go either way.
Latest price action does seem bullish.
Two major events coming up:
- 30 Apr 2021 Launch mainnet for Balanced on the ICX Network
- 31 May 2021 (or earlier) ICX Token swap service
Opinions?

TRONUSD major move imminentTron/USD pair TRXUSD is primed for an advancement in the next leg of its movement.
It has had a major move downwards where it bounced if it's 50 DMA. Since then then, it has moved upwards and it now trading in a symmetrical triangle. This shows buyers and sellers taking profit and entering positions. Furthermore, just like a textbook symmetrical triangle, the trading volume since the triangle formation started has been decreasing. Yet another signal that a major move is imminent.
Additionally, the RSI has reached and stabilised at 45, the same level it reached before it went on a consistent move upwards in yet another indication that a move upwards is imminent.
It's likely the next move will be a breakout as the bounce upwards from the 50 DMA can be taken as the start of a upwards flag. However, cautionary note is that a symmetrical triangle by nature shows indecision in the market, and due to the major move downwards there is a change that the next imminent move is a breakdown.
However, the chart pattern sets up an opportunity for scalping for those with the risk appetite. One option would be to enter at approx 0.044 USD when the price reached the lower boundary of the symmetrical pattern to exit at the top boundary (0.046) with a stop loss at 0.043 for a risk:reward ratio 1:2.
Alternatively, a more risk:reward opportunity would be in case the price breaksdown to the 50 DMA again and to enter at 0.040 and exit at 0.043 - the lower part of the symmetrical triangle - with a stop loss at 0.039 for a ratio of 1:3.
