Triangle Accumulations: The Key to Bitcoin's BullRun?📈 Hey Crypto Enthusiasts,
As we explore the fascinating history of the crypto market, we can't help but notice the recurring patterns that have paved the way for significant bull runs. In 2012, 2013, 2016, and 2019, we observed massive triangle accumulations just before explosive price surges. The question on everyone's mind is whether we'll see a similar pattern before the next bull run. 📊🚀
A History of Accumulation:
In the years mentioned, the crypto market exhibited intriguing behavior. Price action formed substantial triangle accumulation patterns. These consolidations often hinted at a market preparing for a major upward move. 📈🌕
Patterns of the Past:
The symmetry and persistence of these triangular formations, each preceding a significant bull run, have caught the attention of seasoned traders and crypto enthusiasts. 🧐
Will History Repeat Itself?
While history doesn't always replicate, these patterns serve as compelling indicators for what might lie ahead. The crypto market remains unpredictable, but past patterns can offer valuable insights. 🌐🔍
Trading Strategy:
Pattern Recognition: Keep an eye out for similar accumulation patterns in the crypto market. While not foolproof, they can provide hints about future price movements.
Fundamental Analysis: Stay informed about developments, adoption, and news in the crypto space, as these can influence market sentiment.
Patience and Caution: Be patient and cautious with your trading decisions. Utilize risk management techniques like stop-loss orders to protect your investments.
Conclusion:
The crypto market is an ever-evolving landscape, and historical patterns can serve as guides but not guarantees. While the past indicates the potential for triangle accumulations before significant bull runs, it's essential to approach the market with a balanced perspective and a well-informed strategy.
The next bull run may or may not follow the same script, but being prepared and vigilant is your best strategy in the world of cryptocurrencies.
❗️Get my 3 crypto trading indicators for FREE❗️ Link below🔑
Symmetrical Triangle

EMUDHRA SWING TRADE 15% 🚀oct 18
swing trade perfect symmetrical triangle long term opportunity for upside take trade after breakout from the trendline according to own risk this is not call just a analysis.
when nifty turns bullish take trade

AUCTIONUSDTAUCTIONUSDT is trading in symmetrical triangle pattern. The price is reacting well the support and resistance of triangle.
Currently the price has given the breakout of triangle and now retesting the broken level where it is also forming a local support zone and seems like the price may go for another leg higher.
If the breakout sustain to upside the optimum target could be 5.9 followed by 6
What you guys think of this idea?

GOLD → Consolidation phase and key boundary OANDA:XAUUSD continues to form consolidation in the range between 1928.8 - 1914.2. In the near future resistance may be tested, the price reaction to this level will determine the future direction of the price
Since the price is in the key range of 1928 - 1914, there is a probability of price bounce from the resistance. Further growth may continue after the price goes beyond 1928 - the signal for this will be further consolidation of the price above the level.
In periods of geopolitical uncertainty investors rush to safe assets. Gold is a rare bright spot in such turbulent periods.Geopolitical fluctuations are a good reason for investors to look for a safe haven in gold. Despite zero yields, the yellow metal is a preferred asset for money managers who want to wait out scary periods in world affairs. The moving averages are supporting the trend and on the Daily timeframe, price is testing global downside resistance, breaking through which price will get the 2000 mark as a further target
Support levels: 1914.2, 1909
Resistance levels: 1928.8
In the long term I expect a retest of the resistance. If the price breaks through and consolidates above the level, gold will head higher. With the formation of a false breakout and price consolidation below the level, the market will give us a correction to support
COMEX_MINI:MGC1! COMEX:GC1! OANDA:XAGUSD COMEX:SI1! TVC:DXY CAPITALCOM:US500
Regards R. Linda!

SFPUSDT → Pre-break consolidation could send the price upward BINANCE:SFPUSDT after months of forming a sideways range on the background of the global honey trend finally forms a pre-breakdown consolidation against resistance, which may initiate a trend change
We are interested in the global pattern "symmetrical triangle" - in fact, it is a range within which the price is gaining liquidity. Above the range, after the first breakout of resistance, the second level - 0.6420 is formed and relative to this level an ascending triangle is formed, which can be interpreted as an attack of dynamic buyers on the limit resistance area. On the background of possible BINANCE:BTCUSD strengthening, SFP can get a good bullish potential when the resistance of the ascending triangle is broken. The moving averages act as trend support.
Resistance levels: 0.6420
Support levels: previously broken range resistance
In the long term, I expect a breakout of 0.6420 followed by price consolidation above the level, which will form a bullish potential.
Regards R. Linda!

LPTUSDTLPTUSDT is trading in symmetrical triangle pattern. The price is reacting well the support and resistance of triangle.
Currently the price is at the support of triangle where it is also forming a local support zone and seems like the price may break through the triangle.
If the breakout sustain to upside the optimum target could be 6 followed by 8
What you guys think of this idea?

💱USDCAD - symmetrical triangle on a bullish trend USDCAD is in consolidation. A symmetrical triangle with a correction phase to the support area is being formed. The trend is upward, the currency pair follows the dollar index
TA on the high timeframe:
1) The dollar index is going to rise, and so is the USDCAD currency pair.
2) A rebound from the support area with further breakout of the triangle resistance is possible.
TA on the low timeframe:
1) the price is heading towards the triangle support. This is acceptable as long as the dollar indes stands still
2) A bullish bounce may follow from the support on the backdrop of the uptrend
3) I will wait for a breakout of the pattern resistance to open a trade
Key resistance📈: 1.36559
Key support📉: 1.36190

The Triangles. With Real-Life Examples.Today, let's back to fairly good known triangle shapes: Symmetrical, Ascending, Descending and Broadening Triangles.
Triangle chart patterns provide valuable insights into market dynamics, representing a battle between buyers and sellers within a narrowing price range. These patterns are often categorized as continuation or neutral patterns indicating that the price is likely to continue its existing trend after the pattern completes.
1. Symmetrical Triangle:
A symmetrical triangle occurs when the slope of the price's highs and lows converge, forming a triangular shape. This pattern signifies a period of consolidation, with lower highs and higher lows indicating a balance between buyers and sellers. As the slopes converge, a breakout becomes imminent, although the direction of the breakout is uncertain.
To take advantage of a symmetrical triangle, we can place entry orders above the slope of the lower highs and below the slope of the higher lows, prepared to ride the price in the direction of the breakout.
2. Descending Triangle:
In contrast to the ascending triangle, a descending triangle consists of lower highs forming the upper line, with a strong support level acting as the lower line. Sellers gain ground against buyers, and in most cases, the support line eventually breaks, leading to a continued downward move.
To trade a descending triangle, we can set entry orders above the upper line (lower highs) and below the support line, prepared for a potential breakout. However, it's important to note that in some instances, the support line may hold, resulting in a strong upward move.
3. Ascending Triangle:
An ascending triangle features a resistance level and a slope of higher lows. Buyers gradually push the price up, testing the resistance level. This pattern often signals a breakout to the upside, as buyers gain strength and attempt to break through the resistance.
To trade an ascending triangle, we can set entry orders above the resistance line and below the slope of the higher lows, ready for a potential upward breakout. However, it's important to remain open to movement in either direction, as sometimes the resistance level may prove too strong.
4. Broadening Triangle:
Now, let's dive into the intriguing Broadening Triangle, also known as a Megaphone Pattern. This pattern stands out due to its expanding price range, creating a unique visual pattern on the chart.
The Megaphone Pattern consists of a series of higher highs and lower lows, causing the price range to widen over time. This pattern reflects increasing volatility and uncertainty in the market, with both buyers and sellers actively participating.
To approach Triangle patterns effectively:
1️⃣ Pay attention to the pattern's boundaries: Identify the upper trendline connecting the highs and the lower trendline connecting the lows. These trendlines define the range of price movement within the pattern.
2️⃣ Watch for breakouts and reversals: Triangles often precedes significant price movements. We can look for breakouts above the upper trendline or breakdowns below the lower trendline as potential trading opportunities.
3️⃣ Confirm with additional indicators: Combine your analysis with other technical indicators or tools to validate your trading decisions. Consider using indicators like moving averages, oscillators, or volume analysis to confirm the pattern's potential direction.
Remember, trading the Triangles requires careful analysis and risk management. It's important to consider the overall market context, fundamental factors, and other technical signals to make informed trading decisions.
Wishing you successful trading journeys guided by these fascinating patterns! 🚀📈✨

EURCAD → A symmetrical triangle can be broken through FX:EURCAD is in consolidation of the "symmetrical triangle" format. When one or another line (resistance or support) is broken, an impulse may be formed
This pattern, indicated on the chart, does not have a clear further direction, as it is a consolidation and the price breakout of one of the borders of the figure will determine for us the further direction in the short term.
Earlier the resistance of the descending channel was broken, most likely, the imbalance, which the market maker seeks to eliminate, is above the zone 1.4663, but before further growth the market should form a consolidation. Support at 1.4369 or 1.424 may be tested before rising. If the price breaks the resistance at 1.446 soon, further movement will become obvious. Moving averages are pointing to a near-term burst of activity.
Support levels: 1.4369
Resistance levels: 1.446
In the long term, I expect growth. But, before the growth there may be a local fall and support retest. A breakthrough of 1.446 will be a buy signal. A breakout of 1.4369 will be a sell signal.
Regards R. Linda!

Symmetrical Triangle on EUR/GBP @ D1EUR/GBP has entered a symmetrical triangle pattern on its daily chart. It can be used for a trend continuation breakout setup. My potential entry is marked by the cyan line, which is located at 10% of the triangle's base width above the upper border. My take-profit will be at the green line, which is located at 100% of the triangle's base width above the upper border. I will set my stop-loss to the triangle's lower angle (0.86141). I will ignore bearish breakouts from this formation.

💱GBPUSD - The market is preparing for a resistance breakout GBPUSD is forming a breakout of local resistance and a retest of the key resistance. A technical pullback may be formed, but the market is ready for growth. We expect a breakout of 1.2269 and growth to the far frontier
TA on the high timeframe:
1) On D1, the market is overcoming the resistance at 1.22246, thus breaking through the base of the reversal set-up and forming pattern realization.
2) On H4 another resistance retest is formed a few days later. High chance of a breakout
TA on the low timeframe:
1) A triangular consolidation is formed within the local ascending channel
2) Price breaks the consolidation resistance
3) The level may be broken on retest of the key resistance. There will be a potential for growth
Key resistance📈: 1.2269
Key support📉: 1.2215

TCI EXPRESS SWING TRADE 60% RETURN🔥🚀oct 8
swing trade perfect symmetrical triangle long term opportunity for upside take trade after breakout from the trendline according to own risk this is not call just a analysis.
when nifty turns bullish take trade

YGGUSDTYGGUSDT is trading in symmetrical triangle pattern. The price is reacting well the support and resistance of triangle.
Currently the price is at the support of triangle where it is also forming a local support zone and seems like the price may break through the triangle.
If the breakout sustain to upside the optimum target could be 0.25 followed by 0.2670
What you guys think of this idea?

XRP Soars as Court Rejects SEC Appeal The Legal Victory: Ripple's Milestone
The court's decision to reject the SEC's appeal is a significant milestone in Ripple's legal battle.
It affirms that XRP is not a security and can continue to operate without the regulatory cloud that has hung over it.
A Bullish Signal: Market Response
XRP's price has responded with a bullish surge following the court's announcement.
This development underscores the market's confidence in Ripple's long-term prospects.
The Technical Setup: Bullish Triangle Formation
Coincidentally, this legal victory aligns with the formation of a bullish triangle pattern on XRP's chart.
A breakout from this pattern could signify a strong upward move.
Trading Strategy: Navigating XRP's Potential
Traders are closely monitoring XRP for a potential breakout.
Long-term holders see this legal victory as a positive signal for XRP's future.
Conclusion: XRP's Bright Future
Ripple's legal victory against the SEC has provided much-needed clarity and relief for XRP investors. The market's enthusiastic response and the technical setup of a bullish triangle make this an exciting time for XRP.
As the cryptocurrency landscape evolves, staying informed and adapting to new developments remains essential. XRP's recent success story highlights the resilience and potential within the crypto market. 🌐📈🚀
❗See related ideas below❗
Like, share, and leave your thoughts in the comments. 💚🚀💚

GOLD → There's no place to shop. Bear Market ↘︎OANDA:XAUUSD shocked a lot of people in the last week, but we were ready for it and I have been setting medium term targets like 1875, 1850 and even 1800 for quite some time. On Friday the market closes below 1850 and within the candlestick analysis there are preconditions for further fall.
In the coming week there will be important news that will help to determine the medium-term outlook. Pay attention to such data as.
-ISM Manufacturin, FED Chair Powell Speaks
- NonFarm E.C., SP Global Services, Non-Manufacturing
-Initial Jobless Claims
-NonFarm, Unemployment Rate
Fundamental factors are a significant part of the leverage that drives the market. The TVC:DXY is currently under the influence of a positive fundamental background, which is quite negative for gold
From the point of view of technical analysis we see a strong distributive movement. The probable target of this movement may be the following zones: 1827, 1809, 1773, the targets are shown on the chart above. These are important liquidity zones in the medium term.
At the moment gold is in an empty range (no volume density zones).
The price can reach the lower boundary of the main flat - 1809 - quite quickly. But, on Monday, from the opening session the price may form a small pullback to form consolidation. The correction may be directed to 1860, or even to 1875, but there are no signals to start a strong growth now. We expect a fall to 1800
OANDA:XAUUSD OANDA:XAGUSD COMEX:GC1! COMEX:SI1! TVC:DXY
Regards R. Linda!

Triangle Pattern Breakout in ONGC Elliott Wave Analysis.:-
View 1:-
Triangle pattern
In connecting wave triangle pattern seems to be given a breakout and a retracement was taken place. we can accumulate with 1938 as stop loss. .
there are some alternative views. will share in next chart.

NZDUSD → Waiting for the bearish scenario to materialize FX:NZDUSD forms a breakout of the descending channel resistance and forms a symmetrical triangle. Breaking the resistance of the pattern could give a strong impulse, but amid the strengthening of the TVC:DXY there is little chance for that.
The dollar continues to strengthen towards 107.5, as I mentioned earlier in my ideas. Against this background, the NZDUSD currency pair could realize the bearish side of the "symmetrical triangle" set-up. In this case, the price may break the support of the pattern (0.5902 level) in the near future and head towards the areas marked below. Globally we have a downtrend and lack of growth attempts. In technical analysis there is a "flag" setup - a figure that portends the continuation of the trend. This is exactly what I am expecting when the support area is broken. It is most likely, based on fundamental and technical factors, that the currency pair will continue its decline.
Support levels: 0.5924, 0.5902
Resistance levels: upper boundary of the figure, 0.5990.
In the long term, I expect a break of support with a subsequent fall in the trend towards 0.5750.
Regards R. Linda!

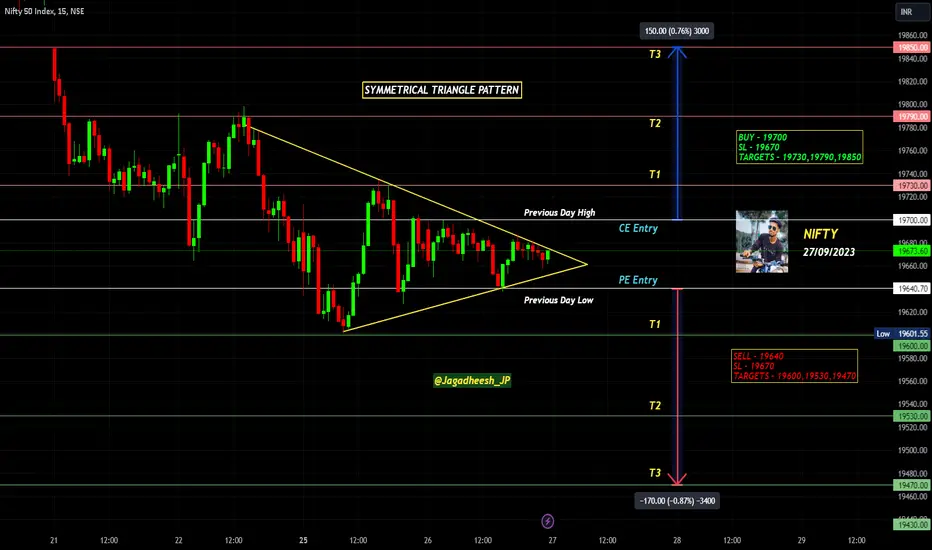
NIFTY INTRADAY LEVELS FOR 27/09/2023SYMMETRICAL TRIANGLE PATTERN
BUY ABOVE - 19700
SL - 19670
TARGETS - 19730,19790,19850
SELL BELOW - 19640
SL - 19670
TARGETS - 19600,19530,19470
NO TRADE ZONE - 19640 to 19700
Previous Day High - 19700
Previous Day Low - 19640
I am sharing NIFTY levels this levels acts as important support & resistance for intraday. if you want to trade with this levels wait for 15 min Candle closing above that levels. You can trade with breakout and reversal both.
In this channel, I share my expertise in trading strategies, technical analysis, and market trends to help you make informed decisions in your trading ventures.
Stay tuned for daily updates, in-depth market analyses, and real-time trading scenarios to witness firsthand how we transform from Zero to Hero in the trading world. My Only aim is to empower you with the knowledge and skills necessary to navigate the complexities of the financial markets successfully.
Based on price action major support & resistance's are here, the red lines acts as resistances, the green lines acts as supports. If the price breaks the support/resistance, it will move to the next support/resistance line. White lines indicates previous day high & low, high acts as a resistance & low acts as a support for next day.
Please NOTE: this levels are for intraday trading only.
Disclaimer - All information on this page is for educational purposes only,
we are not SEBI Registered, Please consult a SEBI registered financial advisor for your financial matters before investing And taking any decision. We are not responsible for any profit/loss you made.
Request your support and engagement by liking and commenting & follow to provide encouragement
HAPPY TRADING 👍
💱USDCAD - Consolidation before further growth is formed USDCAD does not tend to fall after breaking the support at 1.3497. On the background of high timeframe the price retests the key level 1.33724 and forms a correction. Patterns for further growth appear within the correction
TA on the high timeframe:
1) Price returns to 1.3502
2) A pre-breakout consolidation is forming near the level.
3) There is an important liquidity area ahead, above 1.35200, an impulse will be formed if this zone is broken through.
TA on the low timeframe:
1) A consolidation within a symmetrical triangle is formed near the level of 1.3497
2) A retest of the pattern resistance and a retest of 1.3497 is formed
3) Chance is higher that the resistance will be broken, in this case a break of 1.3497 will form an impulse to 1.35668.
Key support📉: 1.34500
Key resistance📈: 1.3497

TRBUSDTTRBUSDT is trading in fine bullish trend and maintaining well the bullish trendline.
Whenever the price retest the bullish trendline buyers are attacking aggressively, which can be seen from pointed arrows on the chart.
Currently the price is retracing to the inclining trendline and again it is being expected that the bulls are ready to attack.
if bulls take the charge this time too the next target could be 44.

GOLD → Bearish Pin-Bar on Negative Fundamental Background OANDA:XAUUSD is testing the upper boundary of the global descending resistance again at the end of last week. The retest occurs at the moment of strong news, but the key candlestick pattern is formed exactly at the moment of FED & FOMC speech, as a result of which the market determines the further prospect of strengthening the dollar and hence - the fall in the price of gold.
In the coming week the market is expecting a lot of important news and I recommend to pay attention to Thursday and Friday. Lots of data that can determine the medium term pespectives for us.
For example:
GDP (QoQ) (Q2)
Initial Jobless Claims
Fed Chair Powell Speaks
Core PCE Price Index (YoY) & (MoM)
Based on the FOMC position from last week we have some views on the market at the moment, but confirmation is also needed.
As for the market situation. I recommend to pay attention to the dollar. During the publication of the data the index only fixed above the level I mentioned earlier and after that it starts to form an impulse. The price opens a corridor to the side of 106 and 107.99, in this case this growth of the TVC:DXY will give a huge potential for a fall in the price of gold. The nearest target support in the medium term is the level of 1902.8.
On the chart above, I have indicated several important levels to pay attention to as the price approaches them. From a global perspective, gold is in a consolidation phase, as evidenced by the monthly chart on the main screen. A strong accumulation zone is forming relative to the resistance area.
In the coming week, I expect a fall towards the 1915 side or even 1900. As we see a sideways range forming and a deep false breakout of resistance with huge liquidity below 1910, this clearly defines the future prospects for the market maker.
Most likely the medium term outlook at the moment is that the market is ready to lose ground further, how long this will hold is unclear, but it all depends on the world view (especially the US) on inflation
OANDA:XAUUSD COMEX:GC1! COMEX_MINI:MGC1! OANDA:XAGUSD COMEX:SI1! TVC:DXY
Regards R. Linda!

CONFIPET for long term investment entry strategyCONFIPET making triangular pattern still in consolidation channel
best entry point is point D range for long term investment .
As fundamentals of stock is weak the scrip cant be a multi bagger but can promise good returns when invested with TA.

FETUSDTFETUSDT is trading in fine bullish trend and maintaining well the bullish trendline.
Whenever the price retest the bullish trendline buyers are attacking aggressively, which can be seen from pointed arrows on the chart.
Currently the price is retracing to the inclining trendline and again it is being expected that the bulls are ready to attack.
if bulls take the charge this time too the next target could be 0.2400.
