AUDCHF - NEW BREAKOUT !HELLO TRADERS !
On The Daily Time Frame The AUDCHF Price Reached a Support Level !
Currently, The Support Level is Broken and becomes a New Resistance Level 🔥
The Price Formed a Descending Triangle Pattern !
so, I Expect a Bearish Move 📉
i'm waiting for a retest...
-----------
TARGET: 0.58800🎯
___________
if you agreed with this IDEA, please leave a LIKE, SUBSCRIBE or COMMENT!
Symmetrical Triangle

symmetrical triangle?Looks like there is a symmetrical triangle for NASDAQ:TSLA , taking us to over the FWB:250 level, enjoy the ride

XAU Gold after result more than 300pipshello traders i have posted gold signal before London open today we have cached massive pips with members .gold was bullish but still we can trade both ways don't be one directional .make sure to follow for more so you can catch crazy moves like this it is not difficult guys you just need the right information

FETUSDT Symmetric Triangle!FETUSDT Technical analysis update
Buy zone : Below $0.40
Stop loss : $0.37
Resistance 1 : $0.425
Resistance 2 : $0.48
Resistance 3 : $0.59
Thanks
Hexa

GOLD ..4H bearish view.-Gold breaks a nice upward triangle.
-TTGD starts from that level.
-Overall the gold is in uptrend and now it is in pullback phase .
-For short trade with good R/R ratio after confirmation using smaller time frame.

$BNB - Bulls are BoilingHello TrdaerZ,
CRYPTOCAP:BNB - looking to smash through the SYMMETRICAL TRIANGLE on DTF.
Soon #ALTSEASON

TKOUSDT Triangle Breakout!TKOUSDT Technical analysis update
Buy zone : Below $0.393
Stop loss : $0.369
Resistance 1 : $0.414
Resistance 2 : $0.457
Resistance 3 : $0.5111
Resistance 4 : $0.590
Spot trade.
Thanks
Hexa

W pattern with symmetrical triangleSymmetrical triangle breakouts and retested. Now making a W double bottom pattern first target is 0.435 , If this 0.435 resistance breaks then next target will be 0.50+ , If price breaks down the Red line then there are chances that price will not pump soon.

$CFX-Imp Support Zone RetestLSE:CFX again broke out from previous resistance and now came back for a retest of resistance turned support zone at around 0.3900-0.3800. I have set fib levels using fib tools and have placed my Limit orders between 0.3950-0.3900.
If tested successfully we might again see a rally up to 0.4850 where there's another resistance.

Symmetrical Triangle on XAU/USD @ D1Gold (XAU/USD) is currently consolidating inside a symmetrical triangle pattern on its daily chart. I will try to use it as a trend continuation breakout setup. My potential entry is marked by the cyan line, which is located at 10% of the triangle's base width above the upper border. My take-profit will be at the green line, which is located at 100% of the triangle's base width above the upper border. I will set my stop-loss to the triangle's lower angle (the red line at 1934.12). I will ignore bearish breakouts from this formation.

USDCHF - NEW BREAKOUT !HELLO TRADERS !
On The Daily Time Frame The USDCHF Price Reached a Support Level !
Currently, The Support Level is Broken and becomes a New Resistance Level 🔥
The Price Formed a Descending Triangle Pattern !
so, I Expect a Bearish Move 📉
i'm waiting for a retest...
-----------
TARGET: 0.88650🎯
___________
if you agreed with this IDEA, please leave a LIKE, SUBSCRIBE or COMMENT!

STOCK NAME { METROBAND } SWING TRADEswing trade take trade when nifty turns bullish swing trade perfect symmetrical triangle short term opportunity for upside take trade after breakout from the trendline according to own risk this is not call just a analysis.

btc ---> breaks uphello guys...
as you can see BTC has broken the last symmetrical triangle pattern...
it would be clear to all of you that the first target of this pattern touched, however, you should consider the main move in this specific coin is bullish and it is not out of mind if it is going to touch the second target as well,
the risk to reward for this position is valuable so I recommend you enter to position with a reasonable risk in case of touching the stop-loss,
_____________________________________
always do your research.
If you have any questions, you can write them in the comments below, and I will answer them.
And please don't forget to support this idea with your likes and comment

STOCK NAME { IGL } SWING TRADEswing trade take trade when nifty turns bullish swing trade perfect symmetrical triangle short term opportunity for upside take trade after breakout from the trendline according to own risk this is not call just a analysis.

STOCK NAME { PRIME SECURI } SWING TRADEswing trade take trade when nifty turns bullish swing trade perfect symmetrical triangle short term opportunity for upside take trade after breakout from the trendline according to own risk this is not call just a analysis.

Mindacorp symmetric triangle breakoutCMP 247.75
- Strong Momentum: Price above short, medium and long term moving averages
- Showing price strength
- Bullish momentum
- May hit 270-280 in short term
*Not recommendation. Do your due diligence

Symmetrical TriangleBINANCE:CFXUSDT has formed a broad and visible chart pattern, we wait for a breakout of the triangle and possible retest, fundamental focus on BINANCE:BTCUSDT . @De_Dommex @tradingview_


ID/USDT TRADE SETUP! READY FOR 50% PUMP!!Hello everyone, if you like the idea, do not forget to support it with a like and follow.
Welcome to this ID/USDT trade setup.
ID looks good here. Breaks out from the symmetrical triangle and also retest is done. Expecting a 40-50% pump from here. Long some here with low leverage.
Target1:- $0.52
Target2:- $0.58
Target3:- $0.64
Target4:- $0.72
SL:- $0.45
Use low leverage (5x-6x)
If you like this idea then do support it with like and follow.
Also, share your views in the comment section.
Thank You!

Xrp still inside a slightly larger symmetrical log triangleWe had a glorious breakout yesterday and today have seen that candle retrace more than 50 % of its length liquidating all sorts of top buyers no doubt. This happened after price manages a wick above the monthly 50m (in orange) but ultimately was rejected from that zone. It wasn’t just the monthly 50ma that put up the resistance however…there is in fact one last top trendline of a slightly bigger triangle on the xrp log chart shown here in red. Price action got close enough to this line to experience a rejection through the combined resistance of it and the monthly 50ma…the red triangle’s apex isn’t until the end of June…hopefully price will break above it in the current zone though when patterns usually have their breakouts on average (about 5-15% away from the apex). If it takes as long as it did to break up from our pink triangle however it could consolidate inside the triangle here until late June. That would shake a lot of frustrated weak hands no doubt. However I’m still confident we have broken up from the pink triangle and should still reach its full $4.90 target, might just take many months to get us there. The first step will be flipping the top red trendline to solid support and an even more important next step will be flipping the monthly 50ma to solid support. Those are the 2 trendlines to watch. *not financial advice*

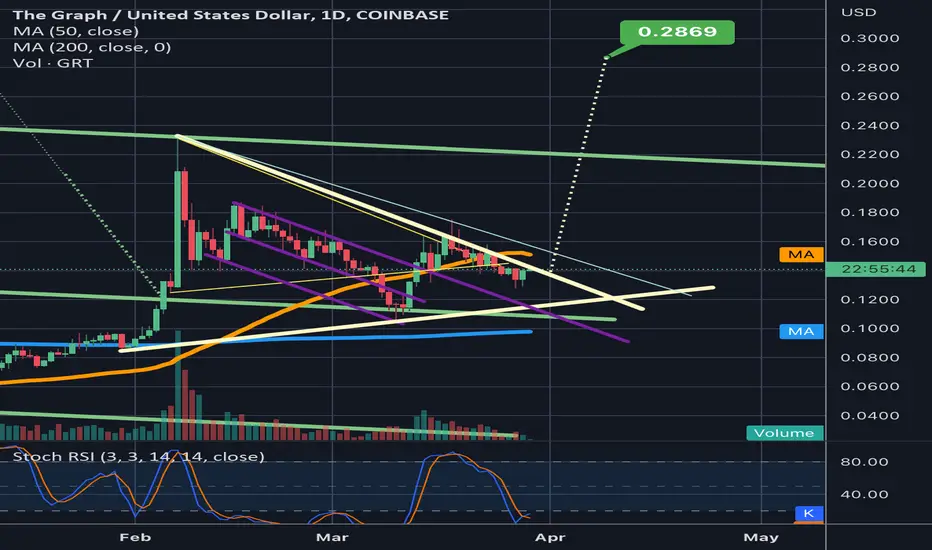
GRT Triangle bigger than originally thought.After several candle close outside of the original yellow triangle, it is clear that the more valid triangle is now this bigger tan triangle. We can see the top trendline of the tan triangles trajectory angle also matches the angle of the purple descending channels as well for added confluence. While that means we haven’t yet actually broken up out of the triangle just yet, the good news is when we do the breakout target will be higher than original expected. I arbitrarily placed the breakout measured move target line here for a rough estimate. opefully it breaks out of the triangle somewhere close to this region. *not financial advice*
NASDAQ 100 Futures short term goal The market is forming a triangle.
--> Wait for the nearest prior high or low to be taken off. And do a 100% symmetry projection to find the initial trade target.
If the price down breaks the triangle, the 1.0 projection will be taken from A to B, projected from E.
If the price up breaks the triangle, the 1.0 projection will be taken from B to C, projected from D.
And do notice the nearest prior low or high may not be D or E if the triangle continues.
**Not Financial Advice**
The information contained in this article is not intended as, and should not be understood as financial advice. You should take independent financial advice from a professional who is aware of the facts and circumstances of your individual situation.

Symmetrical TriangleMASKUSDT is forming a symmetrical triangle clearly on my H4 TF, so we await a break out with respect to fundamental news regarding bitcoin
