STOCK NAME { PSP PROJECTS } SWING TRADEperfect symmetrical triangle short term opportunity for upside take trade after breakout from the trendline according to own risk this is not call just a analysis..
Symmetrical Triangle

symmetrical triangle short term opportunity for upside trainglesymmetrical triangle short term opportunity for upside take trade after breakout from the trendline according to own risk this is not call just a analysis..

j.Hejazi | SPX500 Triangle BreakoutThe SPX500 failed to reach a new high when it hit resistance at 4160.0, forming a triangle pattern. The price has broken the ascending trend line and the 4-hour 50 moving average, and a break to the downside of the pattern at 4080.5 would confirm a new downtrend, signaling a sell with a target of 4006.0.
On the other hand, if the price breaks the pattern to the upside, we must wait for it to clear the 4186.0 level before considering buying opportunities.
-------------------------------------------------------------------------
Let me know your thoughts in the comments, and show your support by liking the idea.
Please follow if you're interested in more ideas like this.
Your support is greatly appreciated!

BANK NIFTY ANALYSIS - 10/02/2023SYMMETRICAL TRIANGLE PATTERN
Buy Above - 41630
SL - 41580
Targets - 41720,41800,41920,42080
Sell Below - 41300
SL - 41380
Targets - 41220,41100,40940,40860
Trade Safe & Happy Trading Guys

couple days of downside for ust then mega pumpthis coincidences with btc going to 21k or so then pump to 25k

Tron TRX is breaking out! Explosive pump is likely.
As you can see, TRX is currently breaking out of the descending triangle on the daily/weekly timeframe, and an explosive pump is now likely!
The take-profit is at the top of the triangle, which is 0.18 USDT. I think it's possible to go higher, but we don't want to risk anything, because we could be in wave 5 from the Elliott Wave perspective. Triangles are typically formed as a 4th corrective wave.
This bull market that started in January is absolutely amazing, and I hope it will continue as long as it possibly can! We want to take as much profit as possible from this bull run.
Sending USDT via the TRX network (TRC20) is very popular among crypto people. Furthermore, Tron's value held up very well during the 2022 bear market. It's definitely a positive sign.
Now is the best time to buy TRX if you don't want to miss out on the upcoming pump! It will be huge!
This analysis is not a trade setup; there is no stop-loss, entry point, profit target, expected duration of the trade, risk-to-reward ratio, or timing. I post trade setups privately.
If we take a look at the previous price action from 2020 to 2021, there are no gaps that need to be filled. In other words, it's possible that we will never go back to these levels.
I'm not sure how you feel about it, but I'm already long in the futures market. 171% is a good profit, so be greedy!
Thank you, and for more ideas, hit "Like" and "Follow"!

symmetrical triangle short term opportunity for upside traingle#HINDUJA GLOBAL symmetrical triangle short term opportunity for upside traingle with small SL

Symmetrical triangle pattern on Gold.Gold has formed a triangle, as we all know triangle is a trend continuation pattern. Therefore there is a high probability it will break to the downside.

Symmetrical Triangle on EUR/CHF @ D1EUR/CHF is currently showing a symmetrical triangle pattern following a long-term uptrend on the daily chart. It can now be used as a continuation trigger for a bullish breakout trading opportunity. My potential entry will be placed at the cyan line, which is located at 10% of the triangle's base width above the upper border. My take-profit will be at the green line, which is located at 100% of the triangle's base width above the upper border. I will set my stop-loss to the triangle's lower apex (0.98739).

swing trade
Ascending triangle short term opportunity for upside take trade after breakout from the trendline according to own risk this is not call just a analysis..

symmetrical triangle short term opportunity for upsidesymmetrical triangle short term opportunity for upside take trade after breakout from the trendline according to own risk this is not call just a analysis..

ATOMETH 'D' - Rebounding off Symmetrical Triangle Lower EdgeThis could be a really nice 20% long trade on Atom over the next month or two.
We've got a nice Buy signal coming in from Crypto Tipster v2, the price is deflecting off the lower edge of an almost perfect symmetrical triangle and off of 2 areas of recent support AND there's not much in the way of resistance until the top edge of the aforementioned triangle. Wow that's a long sentence ;)
What are your thoughts?

symmetrical triangle short term opportunity for upsidesymmetrical triangle short term opportunity for upside take trade after breakout from the trendline according to own risk this is not call just a analysis..

symmetrical triangle short term opportunity for upsidesymmetrical triangle short term opportunity for upside take according to ur own analysis

symmetrical triangle short term opportunity for upsidesymmetrical triangle short term opportunity for upside

TTB | Wave Analysis | Triangle 4-wave Trading SetupPrice action and chart pattern trading
> An overall global leading diagonal pattern with a possible A -wave uptrend with minor triangle 4-wave
> Target minor 5-wave of local A wave at 0.5 - 0.618 retracement global 4 wave +8-10%
> Stoploss @ lower triangle support - 3 - 4%
> RRR: 2.5:1
Always trade with affordable risk and respect your stoploss, nothing is 100%!

j.Hejazi | EURCAD waiting for breakoutThe EURCAD currency pair has formed a triangle pattern with a divergence on the MACD indicator. This pattern also appears to show triple tops with another divergence. These patterns are located at a strong resistance area, as the price is touching the 200-week moving average and testing the key level of 1.46350. To consider a sell signal, the price must break the neckline of the triple tops and triangle.
However, if the price moves up and breaks the moving average, it must also break the 2 yearly resistance trend lines at 1.47313 to be considered a buy signal.
----------------------
Let me know your thoughts in the comments, and show your support by liking the idea.
Please follow if you're interested in more ideas like this.
Your support is greatly appreciated!

XRP LONG SETUP! READY FOR A 15% PUMP!!Hello everyone, if you like the idea, do not forget to support it with a like and follow.
Welcome to this XRP/USDT trade setup.
XRP looks good here. Breaks out from the symmetrical triangle in a 4hr time frame and a retest is also done. Long some here and add more in the dip.
Entry range:- $0.406-$0.413
TP1:- $0.426
TP2:- $0.444
TP3:- $0.472
SL:- $0.3964
Lev:- 10x
If you like this idea then do support it with like and follow.
Also, share your views in the comment section.
Thank You!

symmetrical triangle short term opportunity for upside trainglesymmetrical triangle short term opportunity for upside can go long after it breakout from the trendline with good movementum candle

Bitcoin - Secret pattern, no one talks about!
Bitcoin will definitely reach 30,000 - 32,000 USDT this month, but after that the bears will try to shutdown Bitcoin, because of a massive resistance on the daily chart, so keep reading!
Why is the 30k-32k level so strong? We have 4 confluence points here, and different people will sell Bitcoin at the different levels, but they are very close to each other, so it can end up with a significant crash.
You can see the confluence on the chart, the levels are absolutely extremely strong, and it's really hard not to see any reaction here at all.
This analysis is not a trade setup; there is no stop-loss, entry point, profit target, expected duration of the trade, risk-to-reward ratio, or timing. I post trade setups privately.
We have seen a very positive reaction to the FOMC meeting on Wednesday, which is also important from a fundamental perspective.
My plan is simple, I don't want to short Bitcoin until we reach my specified levels. It's better to ride the uptrend with longs than get rekt with shorts. I recommend you do the same.
Look at my previous idea about "25% CRASH from this level! Be prepared." in the related section down below, very important!
From the Elliott Wave perspective, we have started a whole new bull market, and I expect this bull market to end in September 2025. How much could Bitcoin reach? 160,000 USDT or 360,000 USDT? You know my price target from my previous ideas for the long term.
Thank you, and for more ideas, hit "Like" and "Follow"!

GBPUSD ASCENDING TRIANGLE GBPUSD has formed a symmetrical ascending triangle on its hourly chart.
the Price is trading below the Breakout: 1.24286.
Stops below the low previous to the breakout or below the Lower apex.
Targets1:
62%: 1.25598
79%: 1.25919
Target2:
127%: 1.26806
162%: 1.27438

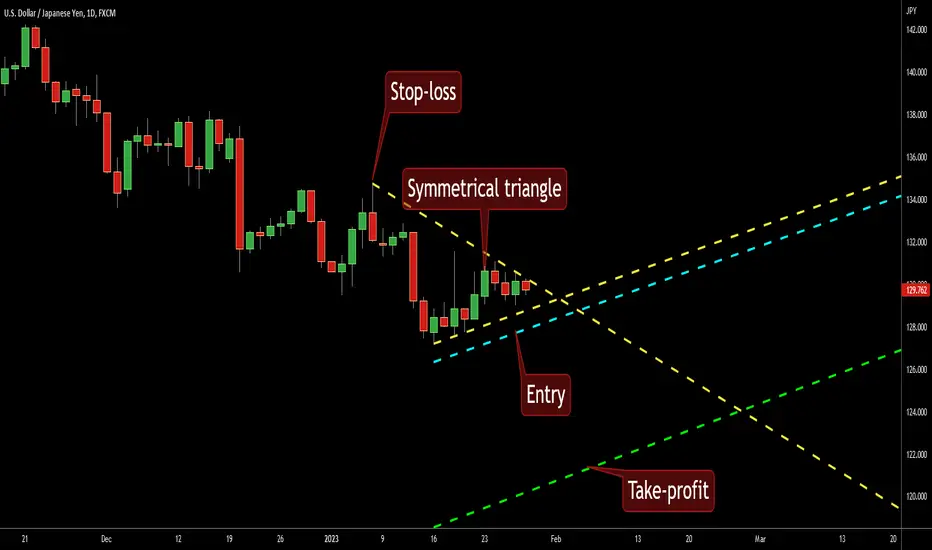
Symmetrical Triangle on USD/JPY @ D1The long-term downtrend prevailing on this currency pair has consolidated in the form of a symmetrical triangle. It can now be used as a continuation pattern for a bearish breakout trading opportunity. My potential entry will be placed at the cyan line, which is located at 10% of the triangle's base width below the lower border. My take-profit will be at the green line, which is located at 100% of the triangle's base width below the lower border. I will set my stop-loss to the triangle's upper apex (134.767).
Shiba Inu - 191% extreme profit! (unbelievable)
It's absolutely unbelievable for Shiba Inu coin because the technical analysis shows an extreme pump is likely in the immediate short term!
If you like Shiba Inu, you must hit the like button right now to support the future of this coin!
There is no doubt that Shiba Inu knows how to pump drastically, and what can happen to you is that you wake up in the morning and you will see a huge green dildo, so I think you want to fill your bags before it happens!
From the technical perspective, we can see a descending parallel channel on the daily chart that is very close to a bullish breakout. Also inside this descending channel, we can see an ABC ZigZag corrective pattern. With this confluence, we are pretty confident about an explosion to the upside.
This analysis is not a trade setup; there is no stop-loss, entry point, profit target, expected duration of the trade, risk-to-reward ratio, or timing. I post trade setups privately.
We have had a 92% correction from the all-time high. There was a massive bear market from 2021 to 2022. The bear market has been completed as an ABC zigzag pattern from the Elliott Wave perspective.
What is the next strong resistance on the way up? 0.00002514 and 0.00003384 without a doubt. They are both strong resistances, where we can definitely experience some selling pressure.
I am telling you that this is going to be massive, so make sure your bags are full with the Shiba Inu coin. You can buy on the spot or go long on futures with leverage.
Thank you, and for more ideas, hit "Like" and "Follow"!
