swing trade swing trade kpitech take trade as per your own analysis good breakout can go long according to your own risk
Symmetrical Triangle

swing trade take position as per risk reward do ur own analysis before taking any trade stock name eclerx service

BANDHAN BANK SWING TRADE SETUPThis right here is a symmetrical triangle which i believe could break to the upside. But regardless we shall see what happens cause the price even break towards the bottom which could result in massive fall due to the presence of a major yearly trendline, but at the end of the day this setup is just out here for the record ( and for fun;) ).
Happy Trading !!!

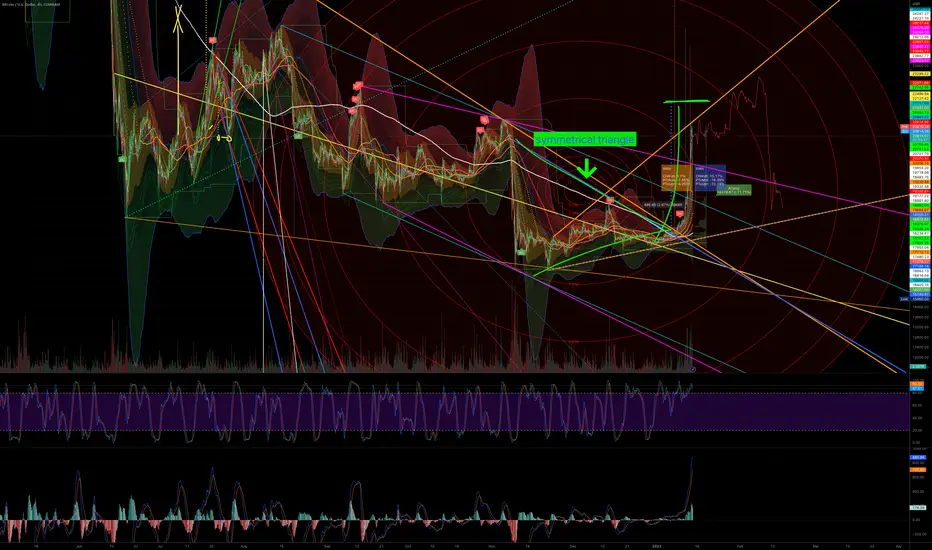
EOSETH - Could Go 10% in Either Direction from Here!Eos is fast approaching the end of a large descending triangle, historically it appears price tends to break on the upside of these triangles, but not always..
We do have a Buy signal from Crypto Tipster v2 which is always very handy in making strong predictions so we'd suggest a rise of 10% is incoming up to the next level of resistance, but we're not 100% on this one! We wouldn't be suprised if we saw the price drop 10%. 📈📉
If you enjoyed or agree with this idea - drop us a comment, like & follow! :)

$SOL - Up or Down ?Hello my Fellow TraderZ,
$SOL is looking for both the Long / Short scenarios.
A beautiful Symmetrical Triangle on 4 HTF.
Bullish : if we break the upper TL & can visit the resitence of $30.
Bearish : if we lose lower TL, we can see $14 for sure before further upward continuation. I'm more inclined towards downward path as Bearish Divergence could play out.
However, bearish bias can be flipped only we break above.
CHEERS!!!

Eth has a similar bullish confluence pattern to btcJust like the bear flag and wedge on btc, Eth also has a weekly bearflag pattern inside a monthly wedge. Eth’s flag is more of a bear pennant however since its flag is a symmetrical triangle..where as the flag on btc is a descending channel. Definitely gonna have to overcome the weekly 50 MA and maintain it as support to sustain a bullish breakout here. *not financial advice*

$MATIC - coming to LifeHello my Fellow TraderZ,
It seems #POLYGON ($MATIC) is breaking of the SYMMETRICAL TRIANGLE and looking forward to test its immediate resistance area ~ $1.25.
Most of the coins have pumped but $MATIC is lagging among them. Follow #BTC also if it pullbacks, $MATIC is no exception and will se the support below.
Happy Trading Fam. CHEERS!!!

Symmetrical triangles confirmed!The truth is that we are starting a bull market and cautious analysts prefer not to say anything, but they are wasting their time waiting, now we see 2 confirmed symmetrical triangles and a third is missing, this is the same thing that happened a few days ago in Bitcoin, taking it to the level it is at now. Targets 53% from here to the first triangle end

XAUUSD ASCENDING TRIANGLEXAUUSD is trading an Ascending Triangle on its hourly chart.
The price is trading the ceiling of the Ascending triangle @1823.84 and 50% of its width where ideals breakouts occur in between the 50% and the 75%.
Target 1
62%: 1855.78
79%: 1864.09
Target 2
127%: 1889.09
162%: 1906.49

Link breaking above last potential top trendline of triangleIt’s still unclear whether or not link’s macro pattern is more valid as a falling wedge or a symmetrical triangle, however it seems now that we are finally closing daily candles above the last potential top trendline for that pattern. That trendline is most valid on the weekly chart so we still need to close the current weekly candle above the white trendline..after that we should see the follow up weekly candle confirm the white trendline as support on a retest ….if the follow up weekly candle closes above the white trendline odds are very good at that point the breakout will be validated…it may wait until the 3rd weekly candle to start the bullish impulse…or it could come as early as the current weekly candle…will have to see how the next few weekly candles play out. I chose to show this chart on the daily time frame instead of the weekly to illustrate how price action is also now back above both the 1 day 50 and 200 moving averages. If it can hold the daily 200ma as support during the next few weekly closes then the breakout will be confirmed. *not financial advice*

XMRUSD - Rejected by Upper Edge of Symmetrical TriangleMonero looks to be trapped inside this symmetrical triangle which has formed after another rejection when trying to break through the upper bounds. There's a nice parallel channel formed for the price to fall back into but it may need a little wiggle romm first based on historical S/R levels.
We can see the price reaching the lower edge of the aforementioned triangle but it may take a few days or even weeks, somewhere between 15-20% profit could be expected from this Sell signal from Crypto Tipster v2.

Nifty 1hrTOMORROW ANALYSIS🔰
Nifty formed an triangle three times touched that upper resistance looking good for tomorrow nifty will give good moment either up or down formed nice pattern good green candle formed in 1 day TF may be tomorrow break that resistance.
Hope you have a profitable day
Thank you😊

CARDANO ADA symmetric triangle Cardano made a nice push up and Now on the hour a trapped in a symmetrical triangle. 50/50 breakout chance and pay attention to the MA50 on this timeframe we are dancing around it now. Should we really get below it with a clear rejection then that could bring the price further down. Both the price target of the symmetrical triangle and the MA200 meet with it.
Yet we also see a downtrend in the MACD and it is desirable that it would remain above the midline to remain bullish. for both scenarios it is desirable to see a re-test but is not a must.
Keep calm, do your own research, trade safe and manage your risk.
(Disclaimer: This is not financial advice)

NAS100 bullish scenarioHello pepps! Nas has formed symmetrical triangle there is high probability it will break to the upside which goes in line with yesterday trade idea on the pair. Looking to attack from the bottom as the structure has turned bullish for the moment. You are welcome to discuss this idea in the comment section. Enjoy!🚀

ONE/USDT Long AnalysisSymmertrical Formation broke up
If it closes the week trading around 0.017-0.0165, it could hold here and start an uptrend.


there was a symmetrical triangleJust a few was waiting for the breakout, a symmetrical triangle created this moment, means reversal of a trend, consolidation, we should see how the bitcoin price has started a bull trend and maybe an inverted head and shoulders pattern for the rest of the year.
FXSUSDT Triangle Pattern!FXSUSDT Technical analysis update
FXS Fromed triangle pattern in the daily chart, we can expect a good up move once the price breakout.
Buy zone: Below $6.70
Stop loss: $5.30
Take Profit 1: $7.64
Take Profit 2: $9.25
Take Profit 3: $10.65
Spot trade.
Always keep stop loss
Thanks
Hexa

GOLD- multi year bull runDollar is weakening, inflation's at all time highs.
Seek safety to park funds.
In tough times, world always falls back to safe havens, let it be gold or digital gold ( bitcoin )

OPUSDT Symmetric triangle!OPUSDT Technical analysis update
Buy zone: Below 1.10
Stop loss: $0.983
Take Profit 1 : $1.18
Take Profit 2 : $1.30
Take Profit 3 : $1.41
Take Profit 4: $1.50
Always keep stop loss

LEVER/USDT BINANCE SPOT LONG Hi everyone as you can see in the chart that there is a symmetrical triangle pattern has been formed, my target 0.001965
Please please do like this post and follow me , thanks

Power finance corporation Pfc all set for a good upside momentum
Chart saying upside momentum is yet to initiate
One can add at current levels for ath
Sl accordin to risk appetite
Ask your financial advisor before buying
Only for educational purposes
Show some love
Will drop more charts like this

Forget about chart patterns! Hello, my dear friends and happy New Year!
I wish you to be healthy and reach all your goals in trading and not only! Never give up on this difficult way which we are going to overcome together!
Today we have a very important topic. How to use Elliott waves instead of classical chart patterns. This is the natural exposure why the chart patterns are garbage. I remember my third year at university when we have the trading lessons. Our teacher gave us a lot of useless knowledges about support, resistance and chart patterns. I have not understood why it should working and it was not soo intereting subject for me. That’s why I returned back to trading much later using self-education. Now I have the clear understanding why Elliott waves is the best tool and why it’s working. Most of traders even don’t understand that chart patterns is just the special case of Elliott waves. That’s why today I decided to explain you how you can change the first one to the second one. Let’s go!
Double Top(Bottom)
On the chart above I drew the different types of double tops. Generally we have 3 types of this pattern
Double top with the second top higher than the first one. In this case we can interpret it in two ways. It could be the classical waves 3, 4, 5 and the corrective wave A at the ending stage. In this case we can anticipate waves B and C. Also it could be the irregular correcton ABC inside wave 4 (rarely in wave 2). In this case we should wait for the wave 5 after that. Traders usually execute short position on the neckline breakdown and suffer when the wave 5 smashed their stop-loss. They are wondering why double top does not working.
Double top with the equal highs has the same possible outcomes. The only one difference that correction called flat instead of irregular.
Double top with the second top lower than the first one. Here is the most common variant is the end of the ABC correction. In this case we have the low potential for shorting the market becuase the new impulsive wave to the upside can hit all stop losses.
Head & Shoulders
This is the easiest pattern for analysis. The right sholder usually is the wave 4, the head, obviously is the wave 5 and the right shoulder is the wave B. On the neckline breakdown we have the shorting potential only in the rest part of the wave C. You could correctly count waves and short that the bearish reversal bar of the wave 5 or, as a last resort, at wave B potential top. Shorting at the neckline has sence only if you are sure that the wave B was the the wave 1 of the impulsive wave to the downside if higher degree and now the market is in wave 3. We have to learn how to count waves in a correct way. I would recommend you to read the Trading Chaos book by Bill Williams because it has the best explanation how do waves work.
Triangles and Wedges
This part is common for all types of triangles (ascending, descending, symmetrical) and wedges (falling and rising). This patterns have the similar structure. If we faced with one of these patterns we have 4 possible scenarios.
Triangle in the downtrend after the wave 3. In this case triangle is the wave 4, which is represented as the triangle correction. This correction type consists of 5 waves A, B, C, D and E. When the wave E is finished market will continue it’s move in the direction of a trend, printing the wave 5.
The same, but in the uptrend.
When the market showed us the 5 waves cycle to the upside and the correction is in progress. Triangle can appears in the wave B. In this case the price will continue the corrective move in the wave C after it’s finished.
The same with the downtrend.
Guys, of course there are much more types of chart patterns. For example, tripple tops and bottoms and so on. The purpose of this article is giving you another view of the market structure and to motivate you studying the Elliott waves theory. Believe me, it has much more potential than it seems on the first glimplse.
Best regards, Ivan
________________________________________________________________________________________________
If you like my educational ideas, please smash the boost button to stimulate me make more quality articles!
