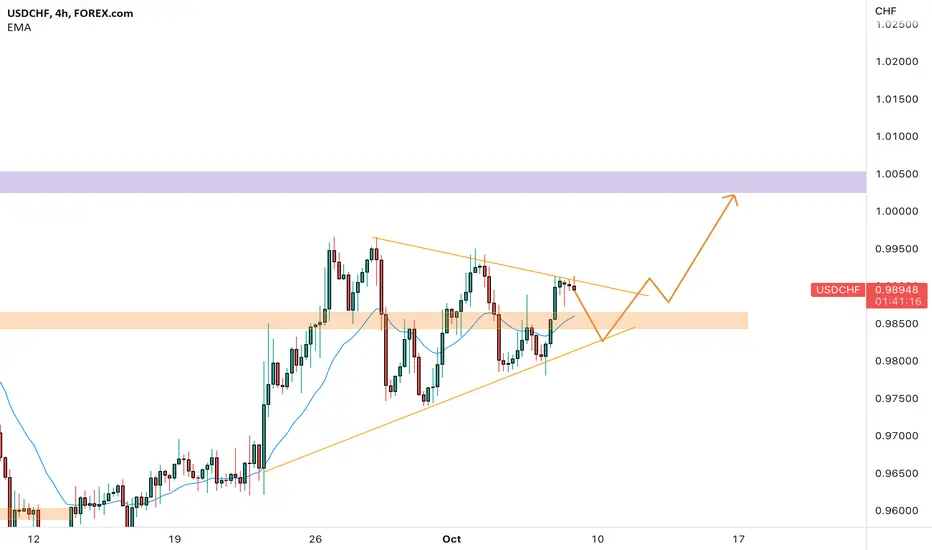
USDCHF on a symmetrical triangle 🦐USDCHF on the 4h chart is moving between 2 converging trendlines.
The price after the last test of the upper trendline is retracing lower and possibly today after the NFP we can see a break above.
How can i approach this scenario?
I will wait for a potential break of the dynamic resistance and when that will happen i will look for a nice long order according to the PLancton's strategy rules.
--––
Follow the Shrimp 🦐
Keep in mind.
🟣 Purple structure -> Monthly structure.
🔴 Red structure -> Weekly structure.
🔵 Blue structure -> Daily structure.
🟡 Yellow structure -> 4h structure.
⚫️ Black structure -> <4h structure.
Here is the Plancton0618 technical analysis , please comment below if you have any question.
The ENTRY in the market will be taken only if the condition of the Plancton0618 strategy will trigger.
Symmetrical Triangle
Symmetrical triangle on Matic/Polygon On Matic has there been a symmetrical pattern formed which shows a 50/50 of the price breaking to the upside of the downside. This said does the price trend show that the price is more likely to break to the downside as the market trend is bearish.
Entry price: In the apex at 0.65.
Stop loss: At 0.67, which is inside the triangle so when the triangle breaks to the downside but after the break to the downside starts trending upwards and is stopped by the stop loss.
Target price: Is extrapolated from the triangle height/the upper trend line and this target price set at 0.349.
This is also 45% gain if the prediction is successful.

XRP - 80% decline, be prepared!
An 80% drop is not sci-fi. But at the end of the day, you can buy cheap XRP at 0.1 USDT and hold it to 589 USDT, as the Simpsons predicted.
I am very bearish on XRP because the bears are in full control and I will tell you why in this analysis.
The price is trending in a massive descending parallel channel (very bad) and the first thing we want to see is a break of the channel to think about buying XRP.
XRP has been in a bear market since 2017. It has been 5 years and we didn't even hit a new all-time high during the 2020–2021 bull market.
As you can see on this chart, we have broken down out of the symmetrical triangle, which is an extremely bearish signal. You don't want to see triangles at the top of the uptrend as a bull.
As per my Elliott Wave analysis, this whole structure is totally incomplete and I am missing an impulse wave dawnward.
We have strong support at 0.1013 USDT, where the market should take stop losses below this swing low before continuing higher to new all-time highs.
It's very dangerous to buy XRP at this moment because this mini uptrend might already be complete.
But after all, I think XRP will experience a massive bull market, maybe in 2023-2025, to new all-time highs because it looks very solid on the monthly scale.
For more analysis, hit "Like" and "Follow"!

7203:TASIRespecting Trendline Support
Bullish Trend with series of HH and HL
Possible Breakout of Symmetrical Triangle
Enjoy the ride with trailing stop loss

$ETHEREUM - "Queen in Danger"Hello my fellow TraderZ,
Today we are here to discuss about the QUEEN of #Cryptocurrency - $ETH #ETHEREUM.
Can see the price is again following the SYMMETRICAL TRIANGLE Pattern and once again coming to the edge of the Pattern.
Last time on the CPI day, we had a sharp Fakeout to grab the Liquidity existing below the level of $1260.
PA is not looking so strong at the moment for $ETH. If the Triangle breaks this time confirms any 4H candle, do not hesitate to SHORT till the levels marked.
Happy Trading Fam. CHEERS!!!

QNTUSD could validate the symmetrical triangle breakout here. Nice sized candle currently above the yellow symmetrical triangle..it has grown a mild bull wick since testing the thickerwhite line above the triangle which is the neckline to a bigger inverse head and shoulders pattern. It could come back down to retest the top trendline of the yellow symmetrical triangle…the most important thing is where the current daily candle closes and how the follow up candle behaves afterwards. As long as we close above the yellow trendline on the current candle probability favors the breakout…however breaking above the white neckline by the follow up candle and flipping it to support will really seal the deal. If we do validate the breakout I would not be shocked if price action came back down to retest the white neckline as support after reaching the triangles full breakout target at $166. If it can hold the white neckline as support after that its a good sign that the inverse head and shoulders pattern will be validating as well taking us even higher. Of course it doesnt have to retest the neckline to validate the inv h&s so wise to anticipate that outcome as well. One last thing to add is there is also a current smaller inv h&s we are breaking up from at the same time as the symmetrical. I forgot to put that patterns target on the chart but the smaller inv h&s target is $137. There’s always a possibility price action corrects after reaching 137 too. *not financial advice*

Trust Wallet TWT - Very durable altcoin, when pump?
TWT is an extremely durable altcoin. During the bear market in 2021-2022 this coin held its value very well.
The platform was acquired by Binance in July 2018. So there is a huge expectation for the Trust Wallet platform.
The full Trust Wallet team is not public, but it is known to comprise over 20 individuals — many of which have overlapping roles at Binance.
This altcoin can basically pump anytime soon, but we can also go sideways for another few months. I believe the value of this coin will increase.
The price is making higher lows. The structure is very bullish on the weekly chart. We have an ascending parallel channel with a symmetrical triangle inside.
The local uptrend started with a beautiful impulse wave, which is an amazing sign for the bulls. But, we don't know yet when the correction ends.
From my perspective, this altcoin provides a very low risk and pretty good reward, so it's worth it.
I expect tremendous gains for selected altcoins. You can find them in the related section down below.
For more analysis, hit "Like" and "Follow"!

CNO: Breakout?CNO FINANCIAL GROUP
Intraday - We look to Buy a break of 19.37 (stop at 18.43)
Daily signals are mildly bullish. Price action has continued to range within a triangle formation. The bias is to break to the upside. A break of resistance at 19.35 should lead to a more aggressive move higher towards 21.00.
Our profit targets will be 21.51 and 23.00
Resistance: 21.50 / 24.15 / 27.00
Support: 18.70 / 16.60 / 10.00
Please be advised that the information presented on TradingView is provided to Vantage (‘Vantage Global Limited’, ‘we’) by a third-party provider (‘Signal Centre’). Please be reminded that you are solely responsible for the trading decisions on your account. There is a very high degree of risk involved in trading. Any information and/or content is intended entirely for research, educational and informational purposes only and does not constitute investment or consultation advice or investment strategy. The information is not tailored to the investment needs of any specific person and therefore does not involve a consideration of any of the investment objectives, financial situation or needs of any viewer that may receive it. Kindly also note that past performance is not a reliable indicator of future results. Actual results may differ materially from those anticipated in forward-looking or past performance statements. We assume no liability as to the accuracy or completeness of any of the information and/or content provided herein and the Company cannot be held responsible for any omission, mistake nor for any loss or damage including without limitation to any loss of profit which may arise from reliance on any information supplied by Signal Centre.

LUNA symmetrical triangle#LUNA/USDT
$LUNA is trading inside a symmetrical triangle and holds the lower line as support.
now price touched the resistance zone.
🐮 break out from the current resistance zone will continue upward move toward reistance zone around $4 and maybe upper line of triangle.
🐻 rejection from the current resistance will drop price to lower line of triangle and by breaking down from lower line, price can fall toward support zones.
#women_life_freedom

$KSM - getting ready to FLYHello my Fellow TraderZ,
Lets catch the #KUSAMA $KSM before it fly.
$KSM is ranging inside the SYMMETRICAL TRIANGLE Pattern and trying to break it.
Buy only after the candle closing above $44.
Orange lines are TP Points.
CHEERS!!!

MCHP: Retest of breakout zone?!Microchip Technolog y
Short Term - We look to Buy at 65.63 (stop at 62.70)
Broken out of the triangle formation to the upside. A lower correction is expected. Reverse trend line support comes in at 64.00. Support could prove difficult to breakdown. Dip buying offers good risk/reward.
Our profit targets will be 73.30 and 78.00
Resistance: 74.00 / 90.00 / 120.00
Support: 64.00 / 54.50 / 45.00
Please be advised that the information presented on TradingView is provided to Vantage (‘Vantage Global Limited’, ‘we’) by a third-party provider (‘Signal Centre’). Please be reminded that you are solely responsible for the trading decisions on your account. There is a very high degree of risk involved in trading. Any information and/or content is intended entirely for research, educational and informational purposes only and does not constitute investment or consultation advice or investment strategy. The information is not tailored to the investment needs of any specific person and therefore does not involve a consideration of any of the investment objectives, financial situation or needs of any viewer that may receive it. Kindly also note that past performance is not a reliable indicator of future results. Actual results may differ materially from those anticipated in forward-looking or past performance statements. We assume no liability as to the accuracy or completeness of any of the information and/or content provided herein and the Company cannot be held responsible for any omission, mistake nor for any loss or damage including without limitation to any loss of profit which may arise from reliance on any information supplied by Signal Centre.

SOLUSDTStoploss MUST
HOPE YOU LIKE MY SIGNALS SHARE WITH FRIENDS WITH STOPLOSS
PAIR SOLUSDT
lets shares

4170: TASI (TOURISM ENTERPRISE CO.) Short move within EquivalenShort move within Equivalent Triangle
(Rising Support to Falling Resistance top)
Trade with proper stop loss
Watch for breakout of Symmetrical Triangle Pattern
Ride the trend with trailing stop loss and TP @idnetified fib levels

Ethereum has bottomed out! 10 000 USD next target!
There is a great chance that Ethereum has bottomed out! But first we need to break the downward sloping trendline to confirm this bias.
I am sure aggressive traders are already buying the ABC correction and the 0.618 FIB retracement, which is definitely worth the lower stop loss they have for this trade.
After the merge, the price of ETH rapidly went down, maybe just to shake out the long-term hodlers. It was a sell the news event, but maybe just in the short term.
As per my Elliott Wave analysis, the ABC correction has been completed successfully as a ZigZag (wave 2) and we are prepared for a tremendous impulse wave 3 to the upside.
However, this ABC correction can transform into an impulse wave, which will be extremely bearish and 500 USD per ETH will be very possible. But you shall not pass!
The next target is 10,000 USD for the long-term trade, but you can take profit at the next strong resistance (3580 USD) if you don't want to wait or want to allocate your money somewhere else.
The chart is printing a symmetrical pattern, but it is not the best looking one, so I drew it on canvas maybe for entertainment purposes.
You don't want to miss my previous analysis of Bitcoin! Check out the related section down below.
I expect tremendous gains for selected altcoins (QNT, BEL).
For more analysis, hit "Like" and "Follow"!

ETH IS READY TO GO ABOVE $1500 IN THE NEXT FEW DAYS!!Hello everyone, if you like the idea, do not forget to support with a like and follow.
Welcome to this quick ETH update.
ETH looks bullish here. Breaks out from the symmetrical triangle in 4hr time frame and retest is also done. Now it looks ready for a nice pump. Expecting target is $1500-$1600 in the next few days.
Invalidation:- Any 4hr candle close below $1300
If you like this idea then do support it with like and follow.
Also, share your views in the comment section.
Thank You!

Bitcoin - The bottom is in! Next target 300,000 USD!
Warning: This analysis may completely transform you into a super bull!
Interest rates are rising, which is bad for the stock market, but is it also bad for Bitcoin? Maybe not at all. On the other side, inflation is pretty high and the money printer is running, which is good for Bitcoin.
We have a huge falling wedge pattern on the weekly chart that is very close to a massive breakout! The upper sloping trendline is very important and can indicate the end of this bear market.
As you can see, the price is currently below the 200 weekly moving average. This particular MA is considered a strong support/resistance by huge institutions and hedge funds, but they do not see it as a level, but rather as a zone. So even if we are a little bit below the MA, it's still holding. We need to break below the previous swing low to confirm the breakout of the MA. What's more, if you take a look at the TOTAL crypto market cap chart, 200MA is above the current price, which can be a more reliable indicator.
If we take a look at the oscillators, the RSI indicator is printing a bullish divergence, which is a strong reversal signal, especially on the weekly chart. Also, the MACD indicator has a bullish tick on the histogram + bullish divergence between the swing lows as well.
We have history's highest volume, so a lot of bitcoin changes owners, which can be interpreted as a bullish signal. It's really a record volume on the Binance exchange, which is currently the biggest crypto exchange.
As per my Elliott Wave analysis, an ABC correction has been completed successfully and we can definitely start a new impulse wave to new all-time highs in the immediate short term!
On Tradeview, I post potential scenarios. Today I can post a bullish analysis and tomorrow a bearish analysis. It's up to you how you decide to trade. Usually, I do not publish trading setups publicly, only privately. I can only give you all the reasons to buy or sell a specific asset here on TradingView.
I expect tremendous gains for selected altcoins (QNT, BEL, STPT). You can find them in the related section down below.
For more analysis, hit "Like" and "Follow"!

Could BTC's Trendline End Not with a Bang But a Whimper?Primary Chart: Fibonacci Channel and Symmetrical Triangle
Title alludes to a well-known excerpt from T.S. Elliot's poem called "The Hollow Men":
This is the way the world ends
This is the way the world ends
This is the way the world ends
Not with a bang but a whimper.
Setting Aside Bias Temporarily to Allow Greater Flexibility in Analysis
Many of my recent posts on cryptocurrencies have been presented with a bearish bias. A bearish view has been warranted, after all, because the technicals have left almost no room for a bullish short-term or intermediate-term view. Some of my recent posts have been neutral, however, to evaluate and explore more fully all possibilities within the context of support and resistance levels, price action and other technical factors.
Unfortunately, BTC's price chart has not yet turned bullish given the price structure. And positive / bullish divergences mentioned by some long-term crypto investors cannot count until they are confirmed by a reversal in trend structure.
This post attempts to set aside bias temporarily to present a variety of technical evidence as objectively as possible. The goal is to remain relatively neutral to allow a more complete examination of the price charts and technicals without the influence of a particular predetermined goal or conclusion. This might allow for greater flexibility to follow the unexpected turns that prices often take.
BTC's Relative Strength in Recent Weeks
In a recent bearish post, after listing several arguments for the bears, I discussed one argument for the bulls—BTC's relative strength. On October 2, 2022, my post stated: "One argument for the bulls is that BTC's sideways chop action has resulted in its relative strength becoming quite impressive. Equity indices have been plummeting sharply since mid-August 2022 with little reprieve. But BTC during this time has largely chopped sideways after losing a few key levels in late August and early September 2022."
This relative strength can be examined more closely by looking at a spread chart that divides one instrument's price by the price of an index or some other price reference for comparison. The chart below shows a spread (or ratio) chart of BTC / SPX, showing BTC's relative strength compared to a leading equity index, the S&P 500 ( SP:SPX ).
Supplementary Chart A: Spread Chart Showing BTC's Relative Strength vs. SPX
www.tradingview.com
Note how this spread chart has broken above a nearly 11-month downward trendline. Some may draw the conclusion too quickly that this suggests a trend reversal, such as from a downtrend to an uptrend. But a break above a down trendline by itself merely suggests a shift from that particular downtrend to either a less steep downtrend or a more neutral trend, which could then lead to a period of sideways chop for some time or it could lead to a trend reversal as well. But a reversal to an uptrend requires a change in trend structure, which is a process that takes time to form and has not occurred yet.
Another aspect of BTC's relative strength exists. It has not broken its June 2022 lows as many equities and equity indices have done. Until that changes—it could break those lows at any time—this technical evidence is an alternative way of viewing BTC's relative strength.
BTC's relative strength has improved even though BTC has largely churned and chopped sideways for the past weeks and months. This is because many asset classes have been steadily declining, some even plummeting, since mid-August 2022 peaks. Any asset or instrument will have relative strength when it moves sideways while equity indices continue to decline. The sideways consolidation will be discussed in greater detail in the next section.
BTC's Recent Consolidation and Volatility Compression
BTC's price has chopped steadily around a key Fibonacci level of $19,246 for the past several weeks since mid-September 2022, and even for a number of days in late August 2022 as well. This consolidation has been noteworthy given that equity indices have plummeted during this time. When an asset moves sideways while equity indices steadily decline results in relative strength (outperformance) of that asset as discussed in the previous section.
Supplementary Chart B: Recent Consolidation Range Containing Price
And during this lengthy consolidation, the compression in volatility has been quite significant. The next chart compares the levels of volatility by using a famous volatility indicator called the Bollinger Bands (set at 2 standard deviations from the mean) on a daily chart. Parallel channels have been drawn over various sections of the Bollinger Bands to give a visual comparison of the volatility levels and volatility compression levels over the past several months. Note how wide the Bollinger Bands expanded as a result of the high volatility associated with steep selloffs. And the periods of volatility compression (squeezes) often preceded those periods of high volatility and large directional moves downward.
Supplementary Chart C: Bollinger Bands (2 Standard Devations) with Channels for Visual Aid in Comparing Volatility Levels
Most importantly, note how the tightly compressed the current volatility in price has become, i.e., note how narrow, the Bollinger Bands are now. They are more narrow perhaps than at any other time during this bear market. If history is any guide, such a period of compressed volatility (a squeeze) implies that a sizeable increase in volatility associated with a large directional move will soon follow. Because the trend has been down, the odds would seem to favor a downward flush. But BTC's relative strength causes one to wonder whether a massive bear rally may be imminent.
So traders should be prepared for any scenario where price could move dramatically. This is why my stance became more neutral for purposes of a thorough evaluation of price action. Because BTC is at a make-or break juncture in the short-to-intermediate term, it helps to stay open to all possibilities rather than staying rigidly fixated on the obvious bearish view. Being flexible and nimble can help traders remain more keenly aware and prepared for shifts that can occur at any time.
VWAPs and Linear Regression Channel
Even if the charts may be shifting in subtle ways, some of the technical evidence still firmly supports the existence of a downtrend. Shorter-term VWAPs \ show that the current price remains under the volume-weighted average price for a variety of different lookback periods. This means that the average buyer is losing money and the average seller remains in control for each of these VWAP periods.
Supplementary Chart D: Various VWAPs from All-Time High, March 2022 High, June 2022 / YTD Low, and August 2022 High
Further, longer-term VWAPs remain in favor of the bears as shown in a separate post from September 24, 2022 (linked as Supplementary Chart E below). The linear regression channel from the all-time high to the present, which was drawn a few days ago (also linked as Supplementary Chart E), suggests that the downtrend remains very much in effect, and that evidence should not be dismissed.
Supplementary Chart E: Linear Regression Channel and Long-Term VWAPs
Price at Apex of Various Consolidation Triangles
The consolidation in price may be viewed from another helpful perspective—the various triangles that have formed. Triangles generally develop as a narrowing trading range (consolidation) as upper and lower trendlines converge under compressing volatility conditions. The Primary Chart shows a symmetrical triangle, which by definition does not imply a direction to the breakout. Price has reached the very apex of this triangle.
Price has also reached the apex of two other right-angled triangles shown below. Right-angled triangles (also called descending or ascending triangles) do imply a directional bias via the sloping trendline that intersects with the horizontal trendline. In this case, the two alternative right-angled triangles (shown in Supplementary Chart F below) imply a downward directional breakout. But right-angled triangles, like other technical patterns and indicators, do not work perfectly to guarantee that the breakout will occur in the implied direction. Some right-angled triangle breakouts occur in a direction opposite from what is expected, which can make the breakout even more sharp because it catches market participants off guard.
Supplementary Chart F: Multi-Month Right-Angled Triangle
Supplementary Chart G: Second Right-Angled Triangle
BTC's Price at Critical Juncture
In conclusion, BTC's price now trades at a critical juncture. A breakout in price from the very apex of several different triangles could occur within a day or two. The compression in volatility has been quite substantial, implying a larger than normal directional breakout move. Combine this compression in volatility with the fact that BTC has not made a new low, has shown relative strength vs. blue-chip indices, and it would seem that traders should be prepared to react to whatever might happen.
Price has also reached the 11-month downtrend line shown on the Primary Chart as the zero line of the Fibonacci Channel. Price could continue chopping sideways right through that down trendline without much ado. That would perhaps be one of the most frustrating outcomes for bulls and bears alike, which is why the title to this article was chosen.
And at this point, it would appear that just about anything can happen—an eye-popping bear rally, a few major whipsaws up and down over the next several weeks, a major continuation move in the downtrend. Or price could just drift sideways through the 11-month downtrend line, ending it not with a bang, but a whimper. While predicting may feel satisfying, the better approach in this case may be to wait and allow price to tell us which way it wants to go.
________________________________________
Author's Comments:
(1) Thank you for reviewing this post and considering its charts and analysis. The author welcomes comments, discussion and debate in the comment section. Shared charts are especially helpful to support any opposing or alternative view.
(2) This technical-analysis view does not constitute a trade recommendation or trade setup. Instead, it attempts to offer technical commentary that describes and analyzes price levels, trends, price action, or the broader technical environment as of the publication date. Technical-analysis commentary does not equate to trade setups or recommendations. Within a given price environment, traders bear responsibility for their own trading strategy, risk tolerance, and time frame, and for any due diligence associated with such trades.
(3) This technical-analysis viewpoint could change at a moment's notice, e.g., when price violates a key level of invalidation for a particular view. Further, proper risk-management techniques are vital to trading success.
(4) To the extent countertrend price moves are discussed, consider that countertrend or mean-reversion trading, e.g., trading a rally in a bear market, remains higher risk and lower probability even for the most experienced traders and investors.
DISCLAIMER: This post contains commentary published solely for educational and informational purposes. This post's content (and any content available through links in this post) and its views do not constitute financial advice or an investment or trading recommendation, and they do not account for readers' personal financial circumstances, or their investing or trading objectives, time frame, and risk tolerance. Readers should perform their own due diligence, and consult a qualified / licensed financial adviser or other financial or investment professional before entering any trade, investment or other transaction.

BTC: A BIG 20% MOVE COMING SOON BUT IN WHICH DIRECTION??Hello everyone, if you like the idea, do not forget to support with a like and follow.
Welcome to this quick BTC update. BTC is tucked at the same price level for the last 24-48 hours.
It is trading inside a symmetrical triangle in a 6hr time frame and soon we see a break of this structure.
Here are two scenarios I'm looking for:-
Scenario1:- If BTC breaks out of this triangle and gives a close above the $20k level then we see a pump up to the $23k level.
Scenario2:- If BTC breaks down this triangle and gives a close below the $18k level then we see a dump up to the $15k level.
For knowing the answer to which scenario is playing here, we have to wait for a clear move first. As of now, the bull and bear fight goes on. Let's see who wins.
Waiting patiently for a clear move to take any trade here. If you are holding some longs or shorts then keep your SLs tight.
Hope this idea will help you to take better trade decisions.
If you like this idea then do support it with like and follow.
Also, share your views in the comment section.
Thank You!

BTC - Symmetric TriangleBTS is actually into a symmetric triangle composed of a series of lower highs and higher lows, which will be pivotal in defining future price direction.
At the moment of this writing, 1H candle price action doesn't look great or seem suggesting that a move upwards is due. I would stay very cautious before entering a trade on BTC

ADA symmetrical triangle#ADA/USDT
$ADA shaped a triangle pattern and try to break down from lower line of this pattern.
🐻 breaking down from lower line will drop price to support zones and even can reach $0.4.
🐮 holding the lower line as support, or holding the support zone around $0.425 and break out from resistance zone around $0.44 will increase price to $0.46

[09/30] Beast Trading _ Today's Bitcoin Analysis Beast Trading _ Today's Bitcoin Analysis
In a slightly larger view, Bitcoin is continuing to move sideways.
It's moving a lot, mostly within 18.6 to 19.6k, and it continues to show the shape of a trigonometrium.
Usually, if you continue to walk sideways and then leave to one side, it usually bounces a lot, but you should think about this and be careful when you leave to one side.
It's not as neat convergence as before, it's not a neat box pattern, and the trend lines are messy.
The response is relatively difficult compared to before, so I think it will be very important.
First is the supporting section (if broken, the probability of further drop increases)
1. Green rising trend line (connection of short-term lows)
2. Orange Convergence Bottom Line
3. Low point 18.1k (There is a high probability of breaking it if you come here, and if you break it, there is a high probability of a significant drop.)
The following are the resistance intervals: (If broken, the probability of further rise is increased)
1. Orange convergence top line
2. The highest point, 20.4k
3. Declining trend line from 69k (very important, if you break through and close above the trend line, respond with a long position if you fall)
Good luck :)

Symmetrical Triangle on EUR/NZD @ H4This short-term symmetrical triangle has formed on the 4-hour chart of the EUR/NZD currency pair following a significant bullish trend. It can now be used a trend continuation trading opportunity in case of an upside breakout. My potential entry is at the cyan line, which is located at 10% of the triangle's base width above the upper border. My take-profit will be at the green line, which is located at 100% of the triangle's base width above the upper border. I will set my stop-loss to the triangle's lowermost corner (1.67483).

BTC: SHORT TERM UPDATE! $17K OR $21K??Hello everyone, if you like the idea, do not forget to support with a like and follow.
Welcome to this quick BTC update. I'm keeping it very short and simple here.
BTC is trading inside a symmetrical triangle in 4hr time frame where breakout or breakdown will decide the next move. IMO this consolidation will be over in the next 2-3days.
The plan is straightforward here. If BTC breaks and closes above the triangle, we see a rally up to $21k. If BTC breaks down this triangle then we see a downside movement up to the $17k level.
My bias is on the upside. I'm expecting a rally up to the $21k-$22k level in the month of October. What do you think? Share your views in the comment section.
If you like this idea then do support it with like and follow.
Thank You!
