Triangle Formation on EtheriumA distribution zone (triangle formation) appeared on Ethereum. It has a higher chance break down.
Important Fibonacci Levels:
-1000
-1220
-1400
-1520
-1640
-1780
Symmetrical Triangle

Descending Broadening Wedge on Bitcoin (BTCUSD)This is a downward facing megaphone-like pattern.
According to Thomas N. Bulkowski, the breakout direction is upward 72% of the time.
However, it should be noted that the partial decline works 79% of the time.
Also, there is a symmetrical mini triangle, on top of the 0.786 retracement from the August 2015 bottom to the November 2021 top.
At this point I prefer to bet on the high than on the low, but I outlined both scenarios.
Bullish Scenario:
- Considering the triangle, if it breaks up the next target would be $20,943
- Considering the wedge, if it breaks up the next target would be $20,530
Bearish Scenario:
- Considering the triangle, if it breaks down the next target would be $17,076
- Considering the wedge, if retesting the diagonal line the next target would be $16,191.
- Should the wedge break down in an even worse scenario, the next target would be $14,682.

Symmetrical Triangle on GBP/JPY @ H4This short-term GBP/JPY symmetrical triangle can serve as a continuation pattern for a breakout trading opportunity. My potential entry is placed at the cyan line, which is located at 10% of the triangle's base width above the upper border. My take-profit will be at the green line, which is located at 100% of the triangle's base width above the upper border. I will set my stop-loss to the bottom of the triangle (163.382).

Ethereum - Relief uptrend, the bulls are stepping in!
The bulls are ready to step in. They are waiting very patiently to enter the market for an upcoming uptrend!
I think this huge downtrend on the 4h chart is over and we need to go up now, because nothing moves in a straight line like Luna.
I see a lot of indicators on the stock market and also on other altcoins that the bulls are gaining strength temporarily.
But I think this will be just a relief rally before a continuation to the downside in the direction of the major bear market.
On the 4h chart we can spot a nice descending channel and the price is currently breaking out! I expect 0.618 FIB and the previous breakout level to be strong resistances where the bears will appear again.
According to my Elliott Wave analysis, we have finished the strong impulse wave to the downside and we are now looking for an ABC retracement.
Also, the price is consolidating in a symmetrical triangle and we are very close to a breakout, so place your orders if you trade Ethereum.
For more analysis, hit "Like" and "Follow"!

ETH: POSSIBLE SCENARIO! BOTTOM MIGHT BE $500-$600 BY THE EOY!!Hello everyone, if you like the idea, do not forget to support with a like and follow.
Welcome to this ETH update.
ETH is trading inside a symmetrical triangle in a 2days time frame. Currently, hovering near the lower trendline of the triangle and also holding important support at around the $1250 level. As long as ETH holds this support we can expect a good bounce up to $1600-$1700 in the month of October.
After, reaching at $1600-$1650 zone we can expect a rejection which will lead to the breaking down of this triangle in mid-November. After breaking down this triangle, the bottom, target for ETH is $500-$600 and we will reach this target by the end of this year.
Invalidation level:- If any 2D candle will close above $1700 then this chart becomes invalidated.
What do you think about this?
Do you also think that we see ETH at $500-$600 by the EOY or do you think that we already reached the bottom?
Share your views in the comment section.
If you like this idea then do support it with like and follow.
Thank You!

RSR/USDT READY FOR A 200% MOVE TO THE UPSIDE!!Hello everyone, if you like the idea, do not forget to support with a like and follow.
Welcome to this RSR/USDT trade setup.
RSR looks very good here. Breaks out from the symmetrical triangle in the daily time frame and currently retesting the triangle. After this successful retest, we can expect a good 200% move to the upside. Buy some on spot and hold it.
Entry range:- $0.0066-$0.0072
Target:- 200%
SL:- $0.0058
Buy some now and add more to the dip.
If you like this idea then do support it with like and follow.
Also, share your views in the comment section.
Thank You!

Ripple XRP - Bull trap! Don't fall for this pump, important!
This pump on XRP is a bull trap to wipe out short traders before we continue lower to 0.1-0.2 USDT. Of course, you can trade XRP on the 1h chart and profit from this pump, but this analysis is on the 3D chart.
There is still room to go to the upside, so for short-term traders it's definitely an opportunity, but it's very dangerous in my opinion because this correction might already be complete.
The Bears have a fantastic opportunity to enter a short position at the top of the parallel channel + the POC of the previous symmetrical triangle. It is a common thing to re-test the symmetrical triangle at the apex point.
The trend is still very bearish on the higher timeframes, so this is just a temporary uptrend, which I would never long, because the trend is your friend. I don't know, maybe it is.
XRP has been in a bear market since 2017. It has been 5 years and we didn't even hit a new all-time high during the 2020–2021 bull market.
We have strong support at 0.1 USDT, where we can also take stop losses below this swing low before continuing higher.
As per my Elliott Wave analysis, this whole structure is totally incomplete and I am missing an impulse wave dawnward.
But after all, I think XRP will experience a massive bull market, maybe in 2023-2025, to new all-time highs because it looks very solid on the monthly scale.
For more analysis, hit "Like" and "Follow"!

XRP continuing to hit bullish breakout targets!We can see the price action has hit the measured move breakout target of the blue symmetrical triangle…it is also now pumping above the 1 day 200ma on its way to hit the next target of the green channel it has also broken out of…once we hit that target we may see a retrace or slight correction or sideways consolidation before it continues upward because as you can see there is on this chart an even bigger triangle pattern with yellow trendlines that we have also broken above…I will save the target of that larger pattern for another idea. XRP continues to look very bullish. *not financial advice*

XRPUSD above the symmetrical triangle on 1day chartShould it manage to flip the top trendline of the triangle to solidified resistance we could see it head to the breakout target of 48 cents in the not so distant future. *not financial advice*

SILVER on a symmetrical triangle? 🦐XAGUSD on the 4h chart is trading between 2 converging trandline.
The Symmetrical triangle pattern in a continuation figure and if the price will break above we can expect more bullish pressure to the upside.
Today is a news day so be safe and trade wisely
-----
Follow the Shrimp 🦐
Keep in mind.
🟣 Purple structure -> Monthly structure.
🔴 Red structure -> Weekly structure.
🔵 Blue structure -> Daily structure.
🟡 Yellow structure -> 4h structure.
⚫️ Black structure -> <4h structure.
Here is the Plancton0618 technical analysis , please comment below if you have any questions.
The ENTRY in the market will be taken only if the condition of the Plancton0618 strategy will trigger

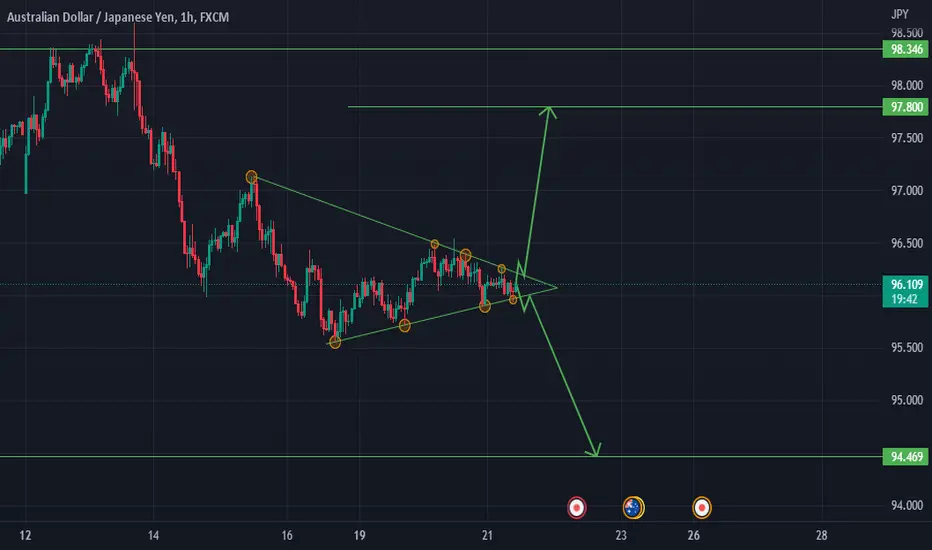
AUDJPY SYMMETRICAL PATTERN...A symmetrical triangle pattern has been formed on the AUDJPY...
breakout will give a good move on it...
ETHEREUM IS GETTING READY FOR A BULLISH MOVE...A triangle pattern has been formed on ETHUSDT...
breakout can give a good movement in it...
according to my view it will be good if it gives a upside breakout...
if it gives a downside breakout then I will leave it...

SPX Breaks Symmetrical Triangle Consolidation PatternPrimary Chart: SPX Symmetrical Triangle and Anchored VWAPs
The S&P 500 broke out of a symmetrical triangle pattern this week. On September 13, 2022, SPX's price closed below the lower trendline of the triangle, which is an upward trendline from the June 17, 2022, low. These multi-month patterns do not resolve easily every time. A backtest of the trendline that was violated commonly occurs, though it's not a certainty. A backtest in this case could mean price moves up to test the SPX 3930 to 3941 zone in the next several days, if it occurs at all.
Two anchored VWAPs are shown on the Primary Chart above. First, the anchored VWAP from the all-time high on January 4, 2022. Price moved above this level in mid-August 2022 at the end of the summer rally. But price quickly failed back below this anchored VWAP not long after the breakout. This constitutes a failed breakout, which has bearish implications for the near term outlook.
The Primary Chart also shows a VWAP anchored to the June 2022 lows. SPX's price broke above this VWAP at least three times on the daily chart, but each breakout has failed. This also has bearish implications in the near term.
The levels that matter the most right now are the symmetrical triangle's two trendlines. As long as price stays below the lower trendline of the triangle (an upward trendline from June's low), the technicals favor a continued bearish outlook. But there are some other levels that are important to watch as well. For next week, all the key SPX price levels to watch are identified below. Key resistance levels for next week include the following levels:
3980 = two key Fibonacci levels coincide here (a .50 retracement of the two-month summer 2022 rally and the .618 retracement of the early September rally)
3978 = anchored VWAP from June 17, 2022, low
3959-3961 = highs from last week's two-day consolidation, September 14-15, 2022
3927-3944 = upward trendline from June 2022 lows that is now resistance (previously support)
3899/3900 = major resistance from June and July as well as the .618 retracement of the summer rally
3886-3888 = important lows from the first half of September 2022
Key support levels for next week include the following:
3858 = anchored VWAP from March 2020 pandemic lows
3837 = low from OPEX / quad witching on September 16, 2022
3812 = 1.272 extension of the retracements of the early September 2022 rally
3783 = .786 retracement of the two-month summer 2022 rally
3721 = 1.618 extension of the two-month summer 2022 rally
3636 = the YTD SPX low
Lastly, the next major levels for the bears to conquer should be the VWAP anchored to the pandemic-crash low in March 2020. Look where SPX's price closed on Friday, September 16, 2022, just above this VWAP after a brief break below it:
Supplementary Chart A: Anchored VWAP from March 2020 low
Supplementary Chart B: Fibonacci Levels from June to August Rally and Early September Rally

ADA Getting Squeezed. ADA is in an accumulation zone(triangle formation) it will pump soon. Based on the momentum, it will go down, but the market is bearish, so we are going to see.
Important Fibonacci Levels:
-0,400
-0,600
-0,720
-0,820
-0,920
-1,050
-1,230


Terra Classic LUNC - Last wave before a dump! | Elliott Wave
LUNC is now a very hot altcoin, but it looks like the uptrend will end very soon.
If you want to buy LUNC, then wait for a pullback, at least to the start of wave 4.
As per my Elliott Wave analysis, this huge impulse wave is pretty much done because we are in the last fifth sub-wave.
As you can see on the chart, wave 2 was a triangle. You may say that wave 2 cannot be a triangle because it's on the public internet as a rule. But this information is incorrect. Wave 2 can be a triangle, wave 3 can be an impulsive diagonal, and sometimes wave 3 can be the shortest wave, believe it or not.
I think LUNC will go much higher, but first we should have a correction that can last a few weeks or months.
Elliott Wave theory is a very powerful technique when volatility is high. On the other side, when the market is going sideways, it's losing its power.
For more analysis, please hit "Like" and "Follow"!

TKN | Wave Analysis | Possible Upcoming Impulse 3-Wave ForecastPrice action and chart pattern trading setup
> Wave pattern: 2-Wave Triangle ABCDE - possible upcoming wave E before rising impulse 3 wave.
> Entry: Support level SMMA50 and SMMA20 @ 0.618 and 0.786 retracement zone
> Target: 3 -wave triangle breakout plus distance of the triangle channel 1.272 extension zone of main 1-wave +15-20%
> Stoploss: Lower triangle support zone -7-8%
> Risk reward ratio: 3:1
Always trade with affordable risk and respect your stoploss

the best example of how to identify a trend changeThis is the reason because the market is not going down, a symmetrical triangle marks the bottom of a trend.

SOLANA PERSONAL ANALYSIS IN THE LONG TERM (EVENTUAL REJECTION!)The total evaluation for the Solana asset is bearish. Please be mindful that such price movements are subject towards closely to the US Indexes as well as any other major fundamentals in the economy. The SP500 and the NASDAQ are very close to their monthly resistances trendline and have a huge potential to breakdown even further. We can only push as far as 45$ in this degree with BTC having a maximum push towards 24,200$ -- no more than that I'm afraid. If for example we did have prices above 24,200 -- this is supported with low volume and bearish divergences which cannot be maintained overtime.
My suggestion and recommendation is to long for the short term only to consider short ultimately at a respectable end. I see a macro-consolidation for Solana with continuous lower highs and higher lows, risk management is crucial.
----------------
You like the chart? If so, boost it, comment on it, share it with your friends, bookmark it, its completely yours for freee! :D

SILVER more downtrend anticipated SHORTXAUUSD- had a big down move on the London Session ; it is now in a triangle with trend lines drawn on the 15 minute chart.
The upper resistance trendline has held from far more touches than the support trendline below.
I conclude it is more or most likely, that XAUUSD will breakout from this triangle on a relatively lower time frame
with bearish continuation trending down and following the equities markets.

Cardano ADA - The worst altcoin! When next crash?
You cannot make money on ADA at this moment, because the downtrend is extremely strong and it's going to be even worse later this year!
Don't get me wrong, I think ADA is a great altcoin, but if you bought the top, you are too late for the party.
The market structure is insanely bearish and we have a descending triangle on the daily chart that will break down with a high probability.
ADA is going sideways from May 2022, and the buyers are simply not here at this moment. The price is making lower highs and now the price is being compressed in this triangle formation.
Also, we have a massive broadening wedge, so you might want to wait for a breakout before enetering a long position, or you can catch the falling knife exactly at my support level, as you can see on the chart.
My Elliott Wave analysis suggests we have an incomplete ABC structure and we should expect 2 more impulsive waves downward, so another 63% crash is definitely possible!
The bears are in power and I would not play with them at all cost.
For more analysis, hit "Like" and "Follow"!

symmetrical triangle on lunc price is moving in symmetrical triangle and breakout of it will trigger the market to ward bulls or bear
there is a day Support level which hold the price and if bears break then bears control the market .
