✅Bitcoin - You haven't seen this before! New triangle + wedge
Everyone is extremely bullish right now and is saying the bottom is in. But I am still very sceptical. We are having a relief uptrend as predicted in my last analysis.
The downtrend is really strong and there is absolutely no sign of a trend reversal at this moment!
As you can see on the weekly chart, we have an incomplete falling wedge pattern and clearly there is still a lot of price action missing.
It looks like we are creating a trading range on the daily chart. Something like a symmetrical or descending triangle.
Regarding my Elliott Wave analysis, I think we can create some kind of triangular formation before continuing lower.
The question is, how much lower can we go? We have a gap at 12 500 USDT, which is a reasonable target and the one and only one support on this particular chart. We can use a fibonacci extension from wave 3 to wave 4, but it's still too early because we don't know if wave 4 was completed or not.
If the trading range is confirmed, then altcoins can moon during this phase and Bitcoin's dominance should continue in the downtrend.
For more analysis, hit "Like" and "Follow"!
Symmetrical Triangle

Directional Traders Beware of SPX Chop AheadPrimary Chart: SPX Symmetrical Triangle Suggests More Chop Lies Ahead
Larger-Degree Symmetrical Triangle Suggests More Chop Looms Ahead in September 2022
SPX has formed a larger-degree symmetrical triangle on the daily time frame. This is shown on the Primary Chart above. The triangle is valid because it is composed of a series of at least two or more rallies and declines lower. The two major rallies that touched the higher trendline ended on March 29, 2022 and August 16, 2022. The higher trendline connects as well with the January 4, 2022, high at 4818.62 SPX.
The higher trendline of the triangle is essentially the downtrend line for this entire bear market that started at SPX's all-time high on January 4, 2022. And the lower trendline has been touched five times, starting at the June 17, 2022, low.
A triangle is essentially a consolidation pattern. This is why chop may be in store for SPX in the weeks ahead as the apex of the triangle nears the price. Note how price founds support this week at the triangle's lower trendline (an upward trendline) after a vicious selloff that started at the August 16, 2022 peak.
Symmetrical triangles are also called coils because price and volume contract as the price range narrows as the pattern progresses. Price has clearly contracted because price has been contained within the triangle's converging trendlines. Volume has also contracted somewhat since the lower trendline of the triangle began to form at the June 17, 2022 lows. (Volume is not shown on the primary chart above.)
If the lower trendline is broken, price will likely begin a substantial directional move. A measuring objective for a symmetrical triangle takes the maximum distance of the triangle at the June 17 low and projects that from the breakout point. But note that a backtest often occurs to wipe out any traders who jumped into positions on the breakout.
VWAP and Gap Area Could Draw Price Back into Triangle Next Two Weeks
The YTD anchored VWAP lies at 4217 SPX. This VWAP currently sits right in the center of a major gap from August 19-20, 2022. Price could be drawn into the triangle again for an attempt at this gap file and retest of the VWAP. This is not necessarily a high-probability target given that daily trends have turned down, but it is a plausible target with a rational explanation, especially since price stopped falling right at the lower trendline of the triangle last week.
SPX Resistance and Support Levels to Watch This Week
Key levels of resistance and support are shown on the supplementary chart below. For tomorrow, SPX will need to move above 3941 and eventually 3980 and 4000 for a move back to the center of the triangle to be sustained. The center of the triangle lies right near the head and shoulders neckline (see linked post on SPX H&S pattern where SPX broke down on August 26, 2022. This head-and-shoulders neckline at 4125-4130 also represents an area of resistance and a plausible target for SPX to rally to before resuming any decline.
If the upward trendline that is the lower edge of the triangle breaks, then the outlook becomes more immediately bearish, though a whipsaw move may be expected in this very tricky market.
The lower edge of the triangle lies at 3915-3925 over the next several days. This is a major level to continue to watch. Coinciding with this upward trendline (lower edge of triangle) are key Fibonacci levels at 3870, 3899, and 3941.
Supplementary Chart A: Key Levels of Resistance and Support for the Next Two Weeks
Short-Term Targets to the Upside and Longer-Term Targets to the Downside
Ichimoku Cloud support also aligns with these support levels identified. Because of such strong support coming in around 3870-3925, from Fibonacci, up trendline at the lower edge of a larger triangle, and Ichimoku cloud, my forecast is that price likely bounces into mid-September 2022. Conservative upside targets = 3997-4003 and 4023 and 4062. Each target will become more likely if the lower target just beneath it can be met and held first.
Supplementary Chart B: Key Ichimoku Cloud Support at 3921
Supplementary Chart C: Key Ichimoku Resistance at Kijun Line (Blue) at 4003
While this post leans cautiously long in the very short term, in the longer-term, this post suggests that the bear market will likely continue given the macroeconomic environment and the Federal Reserves continued policy of tightening financial conditions . The lower trendline of the triangle may break to the downside later this year in October or November 2021. Or perhaps a breakout to the upside occurs to fake out market participants before another major move lower—this type of price action can occur with symmetrical-triangle consolidations. SPX 3870 and 3721 (July 14 low) both are likely targets for SPX price in the coming months, though no prediction about when price reaches these targets is made.
It also helps to keep an eye on interest rates and whether they continue holding their own upward trendline, and whether they chop or continue exploding higher.
Supplementary Chart D: Interest Rates Represented by TNX (10-year yield)
Author's Comment: Thank you for reviewing this post and considering its charts and analysis. The author welcomes comments, discussion and debate (respectfully presented) in the comment section. Shared charts are especially helpful to support any opposing or alternative view. This article is intended to present an unbiased, technical view of the security or tradable risk asset discussed.
DISCLAIMER: This post contains commentary published solely for educational and informational purposes. This post's content (and any content available through links in this post) and its views do not constitute financial advice or an investment recommendation, and they do not account for readers' personal financial circumstances, or their investing or trading objectives, time frame, and risk tolerance. Readers should perform their own due diligence, and consult a qualified financial adviser or other investment / financial professional before entering any trade, investment or other transaction.
SP:SPX
TVC:SPX
OANDA:SPX500USD
EIGHTCAP:SPX500
CME_MINI:ES1!
BLACKBULL:SPX500
VANTAGE:SP500
AMEX:SPY

Quant testing the top trendline of the 1day symmetrical triangleWe can see that priceaction is currently attempting to both test the top trendline of the symmetrical triangle (in chartreuse) as well as trying to climb back above the 1 day 50ma(in orange). If price action can flip the 1 day 50ma back to solidified support then it can validate the bullish breakout from this symmetrical triangle. The breakout target from that symmetrical triangle will take price action far above this white line which is actually the neckline of an even bigger inverse head and shoulders pattern. If we are to hit 100% of the breakout target for the triangle ($165), this will greatly increase the probability of it also triggering the breakout of the inverse head and shoulders pattern as well which can send it considerably higher afterwards($224). Of course for now the 1 day 50ma is still resistance so we want to see a couple daily candle closes above that and any confirmation candles after that that retest it, testing it as strong support. Flipping tat 1day 50ma back to strong support will also confirm that the golden cross that recently happened will be sustained instead of flipping back into a deathcross and confirming a golden cross fake out. *not financial advice*

Ethereum ETHBTC - New all time high this year! Then a big crash?
Ethereum is much stronger than Bitcoin and this trend should continue until we hit the major resistance from 2017, which is approximately another 85% upwards.
As you can see on the chart, this whole market structure looks like an ascending triangle. This triangle should break downwards, if we don't want ETH to flip BTC on coinmarketcap.
Keep in mind that ETHBTC does not belong to a trending market. It's more like an oscillator. You can compare this pair to the EURUSD forex pair. So, forex strategies should work much better on this particular ETHBTC pair.
According to my Elliott Wave analysis, we are currently in the final 5th impulsive wave of the bigger impulsive wave.
Bitcoin's dominance is breaking down the key market structure, which, of course, greatly favors ETH.
Look at my ideas about interesting altcoins in the related section down below.
For more analysis, please hit "Like" and "Follow"!

As policies continue to diverge…For readers who have been following us right from our first ever TradingView idea, you’ll recall our first ever trade idea on long USDCNH. It’s been a fun 5 months writing and sharing our thoughts with the community.
Much has happened since April, but two critical things stayed the same. The US Federal Reserve remains hawkish, raising rates, while the PBoC remains dovish, continuing with its easing stance. The result? USDCNH trading beyond the 6.9 level, surpassing both our target levels.
With the next Federal Reserve meeting coming up, we think it’s time to review this idea again. The CME FedWatch Tool allows us to gauge what market participants are expecting the Fed to do. The prevalent consensus seems to be that the Fed is likely to raise rates till the end of the year before holding rates at the 3.75 – 4.00 % level for the next year.
On the other hand, the PBoC has continued to ease, cutting reserve requirement ratios & lowering its medium-term lending facility. With China still battling Covid via lockdowns, persistently low inflation numbers, and weak economic numbers, we see further easing on the cards from PBoC.
Looking at the charts, the USDCNH pair has just completed a symmetrical triangle chart pattern. After breaking out to the upside and a brief pull-back, prices continued upwards with strong momentum. Using classical charting techniques, the target levels for the breakout can be set to the distance of the high and low of the symmetrical triangle and applied to the top of the triangle. With the target price of 7.1180, there is still upside for this trade.
It seems that policy divergence will remain for these two major economies, which is likely to strengthen the USD and weaken the CNH further, driving up the USDCNH pair. Using technical to identify target levels where we will be comfortable, we think that there is room for more upside.
Entry at 6.9500, stop at 6.8545. Target at 7.1180.
The charts above were generated using CME’s Real-Time data available on TradingView. Inspirante Trading Solutions is subscribed to both TradingView Premium and CME Real-time Market Data which allows us to identify trading set-ups in real-time and express our market opinions. If you have futures in your trading portfolio, you can check out on CME Group data plans available that suit your trading needs www.tradingview.com
Disclaimer:
The contents in this Idea are intended for information purpose only and do not constitute investment recommendation or advice. Nor are they used to promote any specific products or services. They serve as an integral part of a case study to demonstrate fundamental concepts in risk management under given market scenarios.
Reference:
www.cmegroup.com

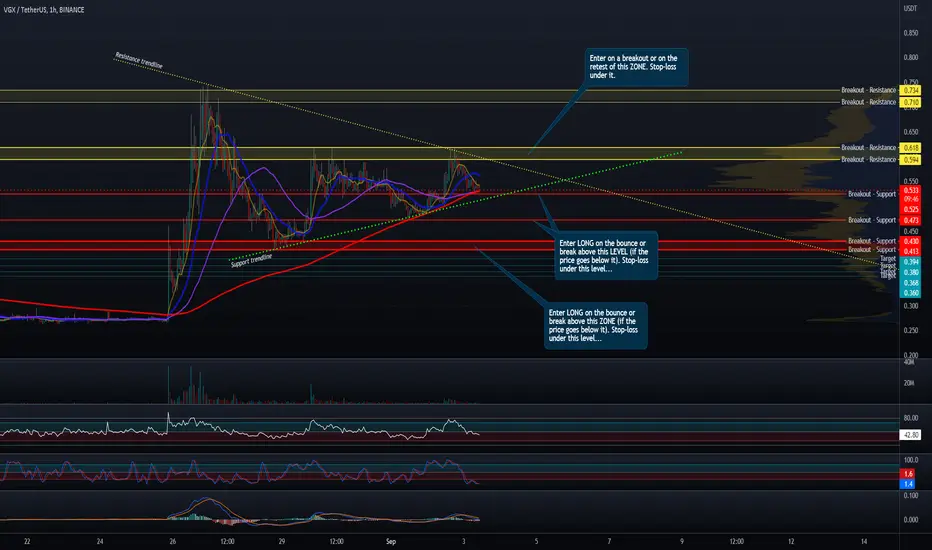
Symmetrical or ascending?Ascending triangle could be forming inside a symmetrical one... VGX gave us 20% in the last trade, and this could be a nice one also... Levels and instructions are on the chart...The hourly oscillator looks ready.. Set alarms, weekend action...
Good luck traders!
[09/06] Beast Trading _ Today's Bitcoin Analysis Beast Trading _ Today's Bitcoin Analysis
On an hour-long basis, Ethereum and Bitcoin do not appear to deviate to one side from their respective patterns.
However, the fluctuation is starting to increase due to the Ethereum merge issue
In general, I felt that Ethereum was leading Bitcoin in recent movements.
In the same upward line, the difference in the increase (buying tax) was also evident, and I think Bitcoin's market dominance may have decreased a little.
First of all, on the chart, Bitcoin has dropped sharply since today's shooting, spitting out all of its gains, and it is now close to the bottom line of convergence.
Due to the relatively large scale of the convergence, deviating from the bottom line can be accompanied by a large additional drop.
(On the contrary, breaking through the top line may be accompanied by a large additional rise)
Ethereum continues to rise due to the influence of the merge issue.
The third picture I uploaded is the Ethereum 5 minute candle, which you can check with the short-term upward trend line.
Before you leave that line, you need to be careful about the Ethereum short position.
Since NASDAQ is also opening today, the fluctuation is likely to be large starting from now.
Let's stick to our own trading principles so that we don't get confused trading!

CHZ formed a Symmetrical Triangle!!!Now, as the chart has formed a Symmetrical Triangle in a uptrend doesnt mean it should go upside, cause the Daily frame and Weekly frame chart doesnt indicate any signs for a bullish movement. So as I have marked the support level "of the Symmetrical Triangle" and the "4H Support Level" . If the price continues to break the "Support level of the Symmetrical Triangle" and close near to my entry price, I would enter for a short position with 2 Take Profits. You can follow this Trading Setup
⚠️NOT A FINANCIAL ADVICE!

SFP head and shoulders #SFP/USDT
$SFP is inside symmetrical triangle and also shaped head and shoulders pattern that price is above the neckline.
🐻 breaking down from neck line can drop price to lower support zones and final target of H&S can be around $0.36.
🐮 holding the lower line of triangle as support can increase price to upper line and break out from upper line will increase price to upper resistance zones.


BTC symmetrical triangle in 1h time frame#BTC/USDT
$BTC shaped a symmetrical triangle in 1h time frame.
🐻 break down from lower line will drop price to somewhere around $19200.
🐮 break out from upper line will increase price to around $21k.

NIFTY ENERGY - Just a view Key highlights: 💡⚡
📊 Currently NIFTYENERGY is giving breakout of Symmetrical triangle.
📊 and 29304 is its resistance level we can see rally of around 1000 point.
📊 but into RSI level 72 is working as resistance level twice.
📊 Keep an eye on both things RSI as well as price movement.
📊 One can go for long into ENERGY SECTOR.
📊 Example : ADANIGREEN , ADANITRANS , ONGC.
⚠️ Important: Always maintain your Risk & Reward Ratio.
✅Like and follow to never miss a new idea!✅
Disclaimer: I am not SEBI Registered Advisor. My posts are purely for training and educational purposes.
Eat🍜 Sleep😴 TradingView📈 Repeat 🔁
Happy learning with trading. Cheers!🥂
Happy Ganesh Chaturthi, ❤️🙏🏻 we wish that all hindrances and hurdles are cleared for you.
Michhami Dukkadam 🙏🏻 Michhami Dukkadam is all about Forgiveness and Kindness!

Symmetrical Triangle Personally waiting for upside Breakout for Long entry with the combination of Price Action strategy.
Trade safely my Friends and let me know your views on this in comments.

CBAY - Large Symmetrical Triangle Symmetrical Triangle leading to a bullish breakout plotted using a bars pattern
Symmetrical Triangles are often considered a bullish pattern

Eurusd symmetrical triangle formation Eurusd forming a symmetrical triangle if it's break upside I will go for long if the triangle break down go for short..........
DYOR!!!!!!

INDIA GLYCOLS - keep an eye for symmetrical triangle breakout 📊 Script: INDIAGLYCO (INDIA GLYCOLS LIMITED)
📊 Nifty50 Stock: NO
📊 Sectoral Index: NIFTY 500
📊 Sector: Chemicals
📊 Industry: Chemicals & Petrochemicals
Key highlights: 💡⚡
📈 There is crossover in MACD as well as in double moving averages and stock is trading towards upper band of BB last but not least RSI is around 62.
📈 One can take swing trade after stock give breakout of symmetrical triangle.
⚠️ Keep an eye on INDIAGLYCO.
⚠️ It is near at its resistance zone which is around 915.
⚠️ Script is going to give symmetrical triangle breakout.
⏱️ BUY ABOVE AROUND 915
⚠️ Important: Always maintain your Risk & Reward Ratio.
✅Like and follow to never miss a new idea!✅
Disclaimer: I am not SEBI Registered Advisor. My posts are purely for training and educational purposes.
Eat🍜 Sleep😴 TradingView📈 Repeat 🔁
Happy learning with trading. Cheers!🥂

INDIA GLYCOLS - keep an eye for symmetrical triangle breakout📊 Script: INDIAGLYCO (INDIA GLYCOLS LIMITED)
📊 Nifty50 Stock: NO
📊 Sectoral Index: NIFTY 500
📊 Sector: Chemicals
📊 Industry: Chemicals & Petrochemicals
Key highlights: 💡⚡
📈 There is crossover in MACD as well as in double moving averages and stock is trading towards upper band of BB last but not least RSI is around 62.
📈 One can take swing trade after stock give breakout of symmetrical triangle.
⚠️ Keep an eye on INDIAGLYCO.
⚠️ It is near at its resistance zone which is around 915.
⚠️ Script is going to give symmetrical triangle breakout.
⏱️ BUY ABOVE AROUND 915
⚠️ Important: Always maintain your Risk & Reward Ratio.
✅Like and follow to never miss a new idea!✅
Disclaimer: I am not SEBI Registered Advisor. My posts are purely for training and educational purposes.
Eat🍜 Sleep😴 TradingView📈 Repeat 🔁
Happy learning with trading. Cheers!🥂

KMD coiling up?Nice triangle, BTC drop didn't mess this one... Moves are getting narrower. Could move soon.
Entry on support or on breakout... Good luck traders

TLM weekly falling wedge potential to increase +900%#TLM/USDT
$TLM broke out from weekly falling wedge, and in daily time frame is inside lower zone of symmetrical triangle.
🐮holding this zone as support and will increase price to break out from triangle and pumping to upper resistance levels.
if price going up to reach weekly falling wedge target it can give us more than 900% profit.
🐻 if price breaks down from lower zone of triangle this analysis will be invalid and I will update you!

EURUSD - The downtrend is at the end! Elliott Wave + Channel
The EURUSD is successfully holding the 1.0 USD level. This is indeed a significant psychological level, and we haven't seen any weekly or monthly candles that closed below this level.
On the RSI indicator, we have a bullish divergence on this daily chart, and we also have another triple bullish divergence on the weekly chart as well! So, if you like divergences, this is definitely your cup of tea.
As per my Elliott Wave analysis, this huge downtrend should be over (or 1 last wave to the downside), and that's why I expect a corrective move to the upside (ABC correction). Let's see how big this upcoming retracement is going to be.
On the daily chart, we can spot a beautiful descending parallel channel, and if you prefer to wait for confirmation of my bias, then you can wait for the channel to breakout.
As you can see on the chart, we had 2 fakeouts during this downtrend, which indicated a corrective move. Usually, the third breakout is real!
The profit target is at 0.618 FIB + the start of wave 4.
For more ideas, please hit "Like" and "Follow"!

CADCHF - BULLISH EXPANDING TRIANGLE 🚀The CADCHF price is in Daily Support Level and Bullish Expanding Triangle Pattern🧐
the Resistance Line is broken ✔
so, i predict a bullish move 📉
TARGET: 0.75400 🎯
...
if you agreed with this IDEA, please leave a LIKE, SUBSCRIBE or COMMENT!

[08/25] Beast Trading _ Today's Bitcoin Analysis Beast Trading _ Today's Bitcoin Analysis
A series of ups and downs in the continuous triangular convergence, but I pierced one direction for the first time yesterday.
It's the top line right above.
I'll explain the response for the time being easily, so if you refer to it carefully, you can win the probability and profit and loss battle and proceed with the sale!
The shape of the chart is as simple as possible, so it will be easy for beginners to understand.
Let's get down to business!
Last night, a big rise broke through the top line in the big triangular convergence that had been shown for several days.
However, it was a little vague to say that it was an upper side, but it fell again and came down.
What you need to check here is
1. Short term "green upward trend",
2. Existing "Triangle Convergence Top Line",
"Red decline trend" from 25.2k
4. "Blue upward trend line" below
the green upward trend
A V-shaped rebound came from the short-term green trend line, confirming that it was a meaningful support line.
If it comes down again, there is a high probability of support on this line, and if it breaks, there is a risk of further decline.
Triangular convergence top line
He broke the top line of the triangle convergence in yesterday's shot, but he came down from the top without holding out, so I think it could still be meaningful.
It still hits the top line and falls slightly, and I think it will be a little more positive for the rise if it breaks through and settles upward.
A line that acts as a resistance.
Red on the decline
It's a downward trend created by 25.2k and 24.4k.
If we break through this downward trend and hold out from the top, it will be a little more positive for the rise, but we haven't yet.
If you break through, you'll break through a sharp decline, so I think you can judge that the decline has subsided a little.
Blue upward trend
It's the bottom line of the triangle convergence.
I think it will be the last line for those who see the upward view.
If this line breaks and falls, you have to think about renewing the 20.7k low point!
It acts as a support line.
If you check the support/resistance lines carefully and enter a position with a good probability and profit/loss ratio, you will lead the sale to an advantage!

Ripple XRP - Market overview + Elliott Wave analysis
XRP is a very weak coin this year, and this trend will probably continue for another year. I'll tell you why.
During the bull market in 2020–2021, XRP failed to print an impulsive wave and also failed to make a new all-time high. Instead of an impulsive structure, we have an ABC correction.
This tells us that the bulls are not strong enough yet to push the price higher and that the bears remain in full control.
I think XRP will experience a massive uptrend on the weekly chart, but we still need to be patient and wait for the opportunity that should come later in 2023–2024.
As per my Elliott Wave analysis, this bearish structure is absolutely incomplete, and that's why I expect another down-trend.
The chart printed a symmetrical triangle on the weekly chart that broke down. Symmetrical triangles on weekly timeframes are especially powerful, and it usually requires more time for the bulls to regain strength again.
I expect tremendous gains for selected altcoins. You can find them in the related section down below.
For more analysis, please hit "Like" and "Follow"!
