MY LONG SWING TRADE IN INDIA CEMENT India cement making good price action pattern in daily time frame,
this stock follow more than 200 days trandline resistance and break this trandline with strong bullish candel in daily TF with good volume.
also stock is follow support trandline with good respct.and aslo its PEMA(21,34,55) its turn to flat to sloping upside its best singh for long this stock
my lavels are enter to this stock
BUY = 204-205
TATGET = 210,220,230
STOP LOSS = 195
Symmetrical Triangle

Binance BNB - Stronger than ETH! Best time to buy?
As I mentioned in my previous analysis, BNB hit a new all-time high on the BNBBTC pair, which is an extremely bullish event!
Also, BNB is stronger than ETH, and as per my analysis of the BNBETH pair, the uptrend should continue into next year.
On the daily chart, we can clearly see a falling wedge pattern that has been destroyed by the bulls recently. Now we are "retesting" the pattern.
My Elliott Wave analysis suggests that a major ABC correction has been completed and we have already started a new impulsive wave to the upside. Currently, we are in the second corrective wave.
Binance coin is definitely a great choice and with an upcoming alt season, this altcoin will perform much better than Bitcoin.
Look at my ideas about BNBBTC analysis and other promising altcoins in the related section down below.
For more analysis, please hit "Like" and "Follow"!

Alpine Formule 1 - Breaking out! Huge opportunity, right now.
As you may know FAN tokens show great strength compared to other altcoins.
A huge symmetrical triangle is breaking out on the weekly timeframe, as well as a local rectangle base!
Due to my Elliott Wave analysis, I expect an impulsive wave, because the massive ABC correction has been completed.
I also checked out the ALPINEBTC pair, which is even stronger, so I don't know what about you, but I am buying!
The profit target is below the previous all time high, which is a reasonable target before a possible correction.
I expect tremendous gains for selected altcoins. You can find them in the related section down below.
For more analysis, please hit "Like" and "Follow"!

1810 XIAOMI | Elliott Wave Analysis - Possible Dump & Pump?Price action and chart pattern trading
> Ending diagonal with asymmetrical triangle pattern - possible scenario with dump & pump before ABC uptrend reversal.
> Aggressive entry @ downtrend channel wave ii and iv breakout
> Safer entry point @ triangle breakout
> Target @ previous 1 wave 0.382- 0.5 retracement zone
> Stoploss @ triangle lower support zone
> Risk reward ratio: 2:1
Indicator:
MACD - signal golden cross anticipated soon
RSI to breakout downtrend line MA before making the long entry
Always trade with affordable risk and respect your stoploss

Bullish on LTOUSDT 127%Bullish on LTOUSDT on Binance
as its breaking out of a symmetrical triangle
Entry at 0.1017
Stop Loss at 0.098
TP @ 0.1054
TP @ 0.1140
TP @ 0.1247
TP @ 0.1560
TP @ 0.2074
TP @ 0.2583
TP @ 0.2903
This is not a financial advice, please do your own research!
Best of luck!

RSR inside symmetrical triangle#RSR/USDT
$RSR is inside a symmetrical triangle pattern and hold above the middle line of this pattern.
🐮 breaking out from the upper line of the triangle will increase price toward the resistance zone around $0.011.
🐻 breaking down from the lower line of triangle can drop price to the support zone around $0.004.

DOGE/USDT (Dogecoin) - 15 min - Potential Symmetrial TriangleDOGE/usdt (Dogecoin) is forming a symmetrical triangle price pattern on the 15-minute time frame.
Price volatility & measured move could be about + or - 5%.
Resistance targets are: $0.87, $0.88, $.90.
Support targets are: $0.85, $0.84, $0.82.

ETHBTC also breaking above large symmetrical triangle on monthlyThis triangle is found on the 1month log chart. This pattern is more speculative than the smaller inv h&s and bullflag patterns I posted in the previous idea to this that I will also link to this idea. If the ethbtc pair were to hit this symmetrical triangles breakout target ethereum would gain insane dominance against btc. Again this pattern validating is much more speculative than the bullflag and inv h&s patterns I posted in the previous idea…but as of now this pattern is still a valid one….even if not quite to be seen on the linear chart. *not financial advice*

DOGE/USDT TRADE SETUP! READY FOR A 60% MOVE TO THE UPSIDE!!Hello everyone, if you like the idea, do not forget to support with a like and follow.
Welcome to this DOGE/USDT trade setup.
DOGE looks bullish here. DOGE is breaking out from the symmetrical triangle in a 12hr time frame. Also, break above 200ma. Buy some here and add more in the dip.
Entry range:- $0.74-$0.77
Target:- 60-65%
SL:- $0.66
If you like this idea then do support it with like and follow.
Also, share your views in the comment section.
Thank You!

Is it over? Hi everyone,
Yesterday I analyzed BTCUSDT and talked about the reason that we are still bullish in the short and midterm. (link down below)
Today, we are going to be analyzing ETHUSDT, and the chart looks clear and beautiful. Right now we just broke above previous resistance where we took off some liquidity that was sitting above the previous high, and we are at a really important level of resistance of a wedge that we are inside of it.
We are in the narrower channel part of the wedge and the price is showing a loss of momentum and a rejection of that resistance. Even though on the H1 timeframe price is in a symmetrical triangle, which is a continuation pattern, I lean towards breaking to the downside. However a break to the upside is possible, and if does so, I will analyze tomorrow where it will go.
Btw, DOGE is looking good if it closes above the resistance. Maybe take a look if you get to read this post right away.
Please comment if you have any questions, I will try my best to answer them.
Thank you😊

SOL 30% PUMP ON THE WAY?SOL is looking bulllish on daily timeframe and 4 hr timeframe , It formed a symmetrical triangle and breaked it on daily timeframe upside which means sol is ready for a take off to the next resistance of 60-69$ which also a region of daily 200 MA and also technically target of symmetrical triangle of around 30-39% . We just want a retest for confirmation, BUT BUT BUT...... still fundamentals will play a major rule for solana future for more and regular update follow our account.

CAD/JPY - 1H - Breakout SetupCAD/JPY is in a range, forming a symmetrical triangle . The price action is currently testing an important resistance zone after forming a double bottom on support zone.
I'm expecting a resistance breakout due to Double Bottom + Bullish Divergence on the RSI and Volume uptrend on OBV.
Now key zone for bulls is to break above the resistance zone. While a break from support zone will bring bears in party. The price could also stay in the range. Trade your levels accordingly.

PFE trianglePFE reached the bottom of the triangle AGAIN. I added of lows today to my current position. Still holding this dividend cash cow. It looks like something that's going to eat you! But the trend line works magic. Nice longer swing or LT hold for me. Not day trading this one, moving too slow.

MDX - Prepare for a massive breakout! + Huge parallel channel
MDX is forming a well respected descending channel on the daily/weekly chart and we are very close to a breakout!
Regarding my Elliott Wave analysis, this massive impulse wave has been completed and that's why we can expect an ABC correction to the upside.
Also we have a local rectangle consolidation, which is always very good to see at the end of the downtrend for a potential breakout trade.
The first profit target is at the strong resistance - wave (4) + double TOP, but i think we can go even higher later.
I think MDX is a great choice together with KP3R!
I expect tremendous gains for selected altcoins. You can find them in the related section down below.
For more ideas, please hit "Like" and "Follow"!

Ethereum ETH - Rising wedge is crashing! Drop to 1250 USD?
Ethereum is unfortunately losing steam, according to my technical analysis.
On the daily chart, the price is printing a clear rising wedge pattern that is currently breaking down! Ethereum has already made a massive 105% gain in 51 days, so I think the wedge is likely to break down rather than up.
As per my Elliott Wave analysis, which is my main specialization - a major impulse wave has been completed and we are prepared for an ABC correction to the downside.
Volume is generally lower during the 5th wave, and this is a textbook example here on the chart.
If we take a look at the RSI indicator, we can spot a nice bearish divergence with a lower low swing on the indicator.
The question is how deep the correction is going to be. We are retracing the first wave, so the correction is usually deeper. You can see 3 levels on the chart where I expect a bounce.
For more ideas, please hit "Like" and "Follow"!

Bitcoin BTC - Explosive move soon! Next stop, 32 000 USDT!
Bitcoin is absolutely prepared for an explosive move, with a high probability of success.
As you can see on the chart, we have just finished a corrective structure (ABCDE ascending triangle) as wave 2 and now we can expect a massive third impulse wave to the upside!
Triangles usually have a 3-3-3-3-3 structure as per Elliott Wave rules, and this is a textbook example pretty much.
We have a first wave as a leading diagonal and I presume this makes sense from the time perspective.
The next major resistance level is 32, 000 USDT, with some minor resistance for intraday pullbacks.
The major EURUSD pair is breaking out bullishly, which favors Bitcoin because of the weak dollar.
For more ideas, please hit "Like" and "Follow"!

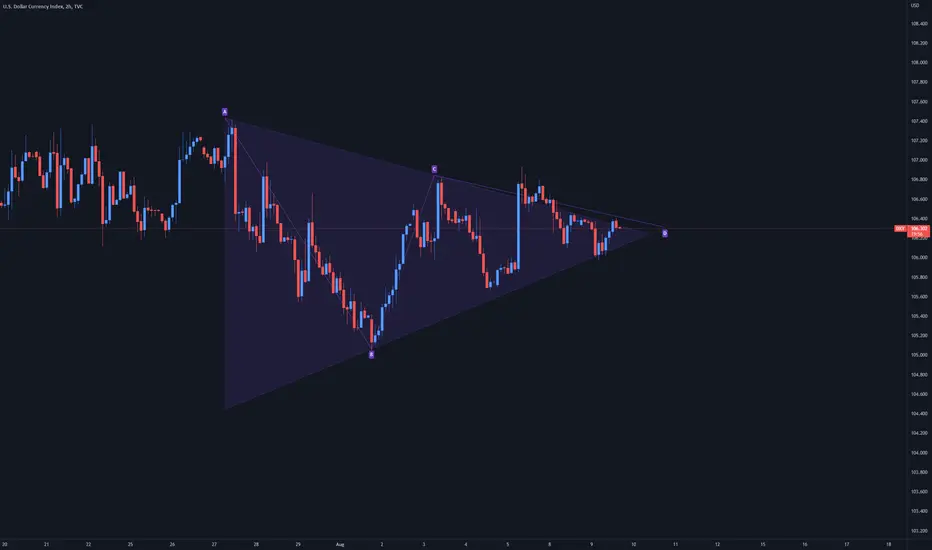
Triangle Formation on DXY on 8/9/22I enjoy trading many technical patterns, but this one I am not a fan of trading until price action shows a non-neutral trending structure. Therefore, I will only be monitoring DXY.
Equilateral Triangle Pattern: This is when the price action s neutral (flat) due to the price trending in both directions at the same time. Typically many fake outs happen with triangle formations, so it is very important to include a price filter when trading this.
SOL symmetrical triangle break down or out?!#SOL/USDT
$SOL is inside a symmetrical triangle pattern.
🐻 breaks down from lower line will drop price to support zone around $32.
🐮 breaks out from upper line will pump it to $47 and even $65.

[08/10] Beast Trading _ Today's Bitcoin Perspective Beast Trading _ Today's Bitcoin Perspective
Bitcoin has been showing a strong trend since August 8.
That's why I don't think it's good to trade with the mindset that "Bitcoin has risen this much, so I'm going to take a short position" and "Bitcoin has fallen this much, so I'm going to take a long position."
First of all, after the strong rise in B-c accompanied by the volume of transactions I've suggested two days ago, we're going exactly according to Elliott's view that there's a stronger C-wave decline with the volume of transactions, and it's now in a very important section.
This is the bottom line of Bitcoin's one-hour parallel channel, which I emphasized before, and it is a very supportive position at the level of one salary.
And as it has a strong meaning, it has shown a weak rebound by supporting it at the bottom line despite its strong decline.
I think there will be a little change in the big view depending on whether there will be a further rebound or a break from this position
First, there is a high chance that the rebound will not come out properly here, and if you break the bottom line, you will go according to the previously raised point of view. There's a lot of possibility of a further plunge.
Second, if there is a rebound here, it is likely that the B wave, which is newly raised today, will converge for a long time.
It's a perspective that keeps moving up and down in the form of a triangulation and rising at the end of the convergence.
Considering the current four-hour stoic, it is located at the bottom line, so even a slight rebound is expected to give a little boost to the rise.
+ The purple trend line at the top is the bearish trend line from 32k.


BTC: A BIG MOVE INCOMING SOON!!Hello everyone, if you like the idea, do not forget to support with a like and follow.
Welcome to this BTC update.
BTC is still consolidating in the same range from the last 5-6 days. It is trading inside a symmetrical triangle in a 4hr time frame and the triangle is squeezing very tightly here. So we definitely see a breakout or break down.
Bullish case:- If BTC breaks out of the triangle and breaks the $23.5k resistance then be ready for the $26k-$27k level.
Bearish case:- If BTC breaks down the triangle then be ready for the $19k-$20k level.
Let's hope BTC breaks out in the upside direction.
What do you think guys?
Do you think we see a rally to $26k-$27k from here or do we see a dump from here?
Share your views in the comment section.
Thank You!
S

VENKEYS EXPLOSION MOVE 75% UPSIDE ^^^VENKEYS India has given a breakout and retesting its previous levels
Reason to enter the trade
1. Breakout
2. Retesting
3. High volume
4. Daily timeframe
I HAVE EXPLAINED EVERYTHING ON THE CHART FOR MY VIEWERS SO THEY CAN EASILY GRAB THE OPPORTUNITY
AND SHARE IT WITH YOUR FRIENDS SO THEY CAN ALSO TAKE BENEFIT OF IT

BTC symmetrical triangle #BTC/USDT
short-term analysis.
$BTC is inside a symmetrical triangle between 0.5 and 0.386 fib levels of the last swing high.
🐻 bearish flag can drop price to break out from lower line toward 0.5 fib level at $22700.
🐮 the upper line of flag is the same with descending resistance zone, that makes this zone strong.
BTW if price breaks out from this zone price possible to move up toward resistance zone above $23500.
