USOIL SPOT : 4.54% IncreaseUSOILSPOT. Symmetrical Triangle Chart Pattern. Exponential Moving Averages. EMA 10 is above EMA 20 on H1 Chart.
Symmetrical Triangle

BTC inverse H&S or triangle#BTC/USDT
$BTC shaped inverse head and shoulders pattern, and now price is below neck line.
🐮 break out from neck line can increase price as high as head toward $25k and $26k.
🐻 rejection from neck line will invalid inverse H&S pattern and price will drop to ascending support around $19k.

Out of the Box chart !!!US Inflation has reached falling trendline where it has faced resistance
for three times.
Also, RSI has reached the upper range from where reversal is witnessed.
But, if it gives breakout above this trendline then the doors of huge upside will
be opened, as it's a symmetrical triangle pattern whose targets are huge.
Rising inflation is never favorable for stock market so it's a sign of caution.

SRTTRANSFINSRTransfin broke out of triangle pattern on 30 min charts with good volumes.
Could be bought with mentioned stoploss & targets

ETH: NOT LOOKING GOOD IN LTF! READY FOR A NEW LOW!!Hello everyone, if you like the idea, do not forget to support with a like and follow.
Welcome to this ETH update.
ETH is not looking good here in 1hr time frame. It is forming a symmetrical triangle-like pattern. ETH was rejected multiple times from the resistance line and now breaks the support line as well.
I'm expecting a 15-20% drop from here in ETH price. As you know when ETH drops many altcoins will also follow. So stay cautious and trade carefully.
If you like this idea then do support it with like and follow.
Also, share your views in the comment section.
Thank You!


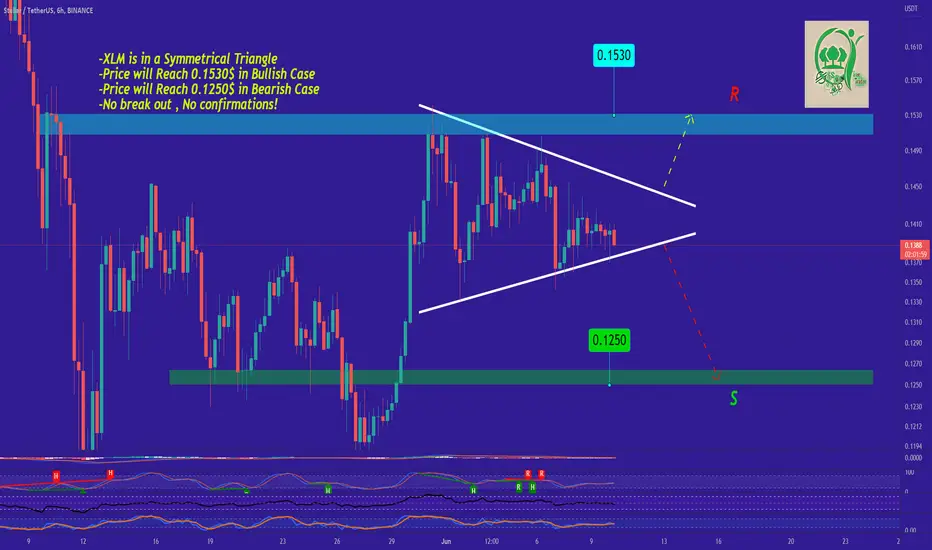
XLM Expected Movement ExplainedStellar is in a Symmetrical Triangle which means the Price can Do a Bullish and a Bearish Movement Depending on the Break out which is gonna Happen Pretty soon.If the Price does a Bullish Break out , We can Expect the Price to Reach 0.1530$ But If the Bearish Break out Happens, The Expected Price after Completing The Movement is around 0.1250$.
-XLM is in a Symmetrical Triangle
-Price will Reach 0.1530$ in Bullish Case
-Price will Reach 0.1250$ in Bearish Case
-No break out , No confirmations!
_ _ _ _ _ _ _ _ _ _ _ _ _ _ _ _ _ _ _ _ _ _ _ _ _ _ _ _ _ _ _ _ _
Thank you for seeing idea .
Have a nice day and Good luck
SHILPAMED Triangle pattern formedA symmetrical triangle pattern formed in SHILPAMED
Kindly consider the levels of technical educational purposes only

BTC: SHORT AND QUICK UPDATE!!Hello everyone, if you like the idea, do not forget to support with a like and follow.
Welcome to this BTC update. First of all there is no need to be panic here. We have seen this kind of pump and dump from the past few days.
Now let's get to the chart.
According to the 4hr chart structure BTC is still holding the support of $28,800 and currently testing the lower trendline of the symmetrical trendline. We can expect a bounce from here.
As long as BTC stays above $28k there is no need to be panic. If any 4hr candle closes below $28k then it would be very bad and we might see another low of $24k-$26k
So keep an eye on next 4hr closing.
If you like this idea then do support it with like and follow.
Also, share your views in the comment section.
Thank You!


High Chance For Long We can see that the price has broken the trend line, but now it seems that it was a fake movement with the appearance of a continuation pattern and it is a symmetrical triangle after a rise in the price, which means that the price will continue rising to return above this ascending trend line.

What to expect from $SukuThere are 4 important S/R levels on $Suku chart to pay attention.
A valid breakdown of $0.09 may provoke a 32% fall, as the next crucial support is at $0.06.
That'll be a disaster.
In a possible relief rally #Suku may reach prices as high as $0.20.

Bigger Picture NVAX Projection - UpdateUpdate from post yesterday - obviously the manufacturing news killed momentum so taking this opportunity to roll to July expiration and add some lower strikes at a discount.
- Chart indicates a symmetrical triangle breakdown into support. DMI suggests accumulation, this will be the spring.
- Expecting yellow path to play out as price trajectory. Forming an impulse wave that takes it right through the equilibrium point where supply = demand at the intersection of support and resistance from the triangle.
- initial target around 70 but will need to give this some time to unfold.
- mid term I see this going to triple digits easy (by end of 2022 - that is conservative)
NVAX has done this every pandemic {pop to 300s, sell off to 40s, re-accumulate and take it back into the 100s... rinse and repeat}
Sincerely,
Covid-19

EURUSD Be Careful Going Short! Possible triangle on chart.A triangle is a continuation pattern, and the current trend is long, so this breakout, aside, depending on where we close, price could snap right back up through resistance. I would wait to get in short until a few more lows get cleared!

XTZUSDT is going to have a breakout from the triangleThe price is testing the 4h resistance on the triangle.
The price had a breakout from the dynamic resistance and now the market is testing the 0.618 Fiboancci level. If you look on the left you can see that the price has a supply zone on 2 - 2.1 $
How to approach it?
The price needs to create a clear breakout from that area.
If the price is going to get momentum and volumes, According to Plancton's strategy, we can set a nice order

BITCOIN Symmetrical Triangle FormationHello everyone,
BTC has been forming a symmetrical triangle for a while now, while we are seeing the immensely volatile move as the MM try to discourage any kind of leverage trades by liquidating on both ends trading in this market has become very risky.
We are waiting for CPI figures that are to be released on Friday by the US that can severely affect how the market will move in the coming month.
For now buying BTC in parts under 30K$ seems like the safest strategy to scalp by booking on the top end of the triangle

BULLISH SYMETRICAL TRIANGLE EUR/USDEUR/USD is expected to continue the bullish momentum it has been showing in the last couple days with a symetrical triangle formation.
Comment your thoughts and stay updated for the results 👍


BTC: A PERFECT RETEST! NOW READY TO BOOUNCE!!Hello everyone, if you like the idea, do not forget to support with a like and follow.
Welcome to this BTC update. BTC looks good as of now.
BTC is breaking out from the symmetrical triangle in the 8hr time frame and after the breakout, we got a perfect retest. And after this retest now it is ready to bounce.
If any candle closes below $29.5k then this retest process will become a fake move. But as long as BTC holds above $29.5k I'm expecting a good move from here.
You can also open a long position with an SL of $28,900
If you like this idea then do support it with like and follow.
Also, do share your views in the comment section.
Thank You!

XRP will breakout soonXRP made a big symmetrical triangle and now it is trying a breakout using ascending triangle.
If we see huge volume breakout with perfect retest.
XRP will give 80-130% in profits.

ETH is bullish?ETH as usual following the KING BTC.
It has same chart patterns bearish flag with symmetrical triangle to confirm the continuation in the downtrend.
And calculating bearish flag put it into the order block which is confirmed and tested.
Also after plotting Weekly MA 50 is acting as a resistance it's about time to be hit by it

REEFUSDT is creating a triangleThe price is creating an ascending channel below the daily resistance of 0.005$.
As you can see the daily area is very strong for the market, and the price got several rejections from that area.
How to approach it?
IF the price is going to have a breakout from that area, According to Plancton's strategy , we can set a nice order
–––––
Keep in mind.
🟣 Purple structure -> Monthly structure.
🔴 Red structure -> Weekly structure.
🔵 Blue structure -> Daily structure.
🟡 Yellow structure -> 4h structure.
–––––
Follow the Shrimp 🦐

AMD daytrade ideaDespite market weakness, AMD has been holding and battling the psychological $100 level.
Also, I can see that a possible symmetrical triangle (a little wonky) black lines.
My plan into tomorrow is watching the direction of this move.
Upside scenario: Above $93.83 would long it targeting $96 and above that $100
Downside scenario: I would wait to see if price will break the bottom of the triangle, if it does i will enter short below the break and target $90 and $88.70
There is no need to have a bias in this market, just play what the day brings.
Good luck.
