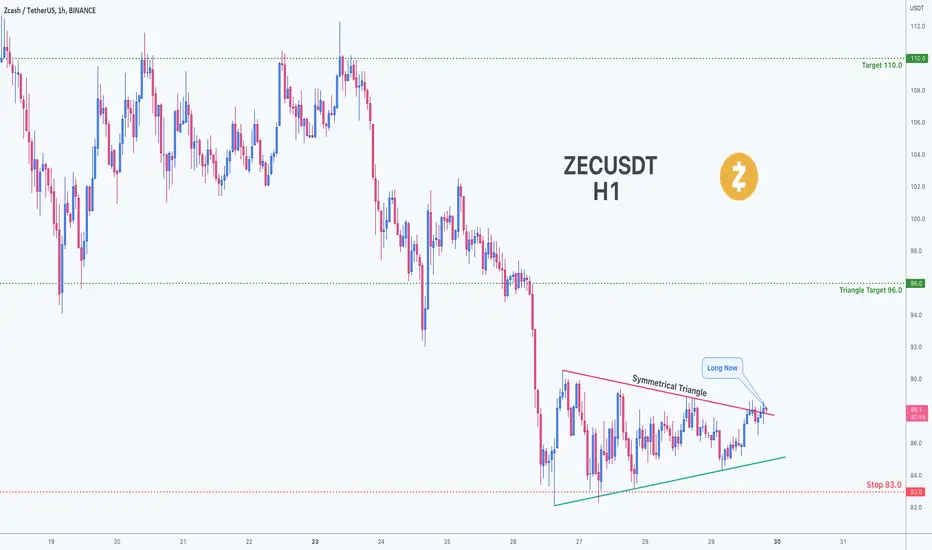
Symmetrical Triangle on ZECUSDT Based on technical factors ( Symmetrical Triangle ) there is a long position in :
📊 ZECUSDT
🔵 Long Now 88.1
🧯 Stop loss 83.0
🏹 Target 1 96.0
🏹 Target 2 110.0
💸Capital : 1%
We hope it is profitable for you ❤️
Please support our activity with your likes👍 and comments📝
Symmetrical Triangle

USDJPY-Weekly Market Analysis-Jun22,Wk1USDJPY, a sideway consolidation best present itself as a trading opportunity, in order for the break to happen on the upside, the candlestick has to break and close above 127.25. Towards the downside is much easier, provided there isn't any candlestick wick danging like what we saw on the current chart.
Sideway consolidation is my favourite breakout setup.


Bounce from top of symmetrical triangle/Elliot Wave CorrectionVANTAGE:DAX40
A possible bounce from the top of symmetrical triangle combined with an Elliott correction wave may give a good shorting opportunity but we'll need a convincing close below the trendline.

BTCUSD ShortBTCUSD has been trading in this tight triangle and it looks ready to breakout soon. Triangles can be traded in either direction but I have a stronger short bias.

CHAMBLFERTChamblfert broke out of symmetrical triangle on an hourly chart with decent volumes.
Could be bought with mentioned stoploss & targets.

ETH SHORT TERM UPDATE! Hello everyone, if you like the idea, do not forget to support with a like and follow.
Welcome to this ETH update.
ETH is trading inside a symmetrical triangle pattern in the 4hr time frame. Currently, it is reaching towards the major resistance line of triangle. If it breaks and close above the triangle ($2072) level then we can see a 14-15% pump in ETH.
On the other hand if we get the rejection from here then it might cam again to test the lower trendline of the triangle.
Let's see we will get a clear breakout this time or not.
If you like this idea then do support it with like and follow.
Also, share your views in the comment section.
Thank You!

BTC: BREAKOUT OR JUST ANOTHER FAKEOUT? Hello everyone, if you like the idea, do not forget to support with a like and follow.
Welcome to this BTC update. BTC is trading above $30k.
BTC is breaking out from the symmetrical triangle and currently retesting it. After this successful retest, we might see a good upward rally.
The important thing to remember here is that we have seen a false breakout many times in recent days. Every time BTC did a break out it turned out to be a fakeout. So if you open any long position then keep your stop losses tight.
What do you think about this?
Do you think that we have seen a bullish rally from here or this is just another fake-out?
Share your views in the comment section.
If you like this idea then do support it with like and follow.
Thank You!

AXS SYMMETRICAL TRIANGLEA great symmetrical Triangle forming in a Bear market.....
High chance of giving a spike upwards in coming dayzz to gain more liquidity in this type of market where most of the people will try to enter a sell order....
If you can relate then do like and comment on what crypto or a stock I should analyse next ?

ALTPERP UPDATE! ALTCOINS WILL PUMP MORE IF?Hello everyone, if you like the idea, do not forget to support with a like and follow.
Welcome to this ALTPERP INDEX update.
ALTPERP is looking good here. It is forming a symmetrical triangle in the 4hr time frame where breakout is still pending. If we get a proper breakout with good volume then we have seen a good pump in Altcoins in upcoming days.
I have already shared some Altcoins (Link given below) and try to share some more setups today. Looks like we have seen a mini Alt season in upcoming days.
Invalidation level:- If 4hr candle close below $2174 level.
If you like this idea then do support it with like and follow.
Also, share your views in the comment section.
Thank You!

BTC: BREAKOUT WILL DECIDE THE NEXT MOVE!!Hello everyone, if you like the idea, do not forget to support with a like and follow.
Welcome to this BTC update. BTC is rejected from the $30,500 level (Upper trendline of the channel and made a low of $28,700 level.
BTC is trading inside a symmetrical triangle pattern in the 4hr time frame where the breakout is still pending. If BTC breaks out from the triangle then our short-term target is $33k-$34k or if BTC breaks down the triangle then our target will be $25k-$26k level.
So overall it's better to wait for the clear move and decide where it wants to go.
If you like this idea then do support it with like and follow.
Also, share your views in the comment section.
Thank You!

BITCOIN(BTC) BREAKS SYMMETRIC TRIANGLE Bitcoin just broke the 4hr symmetric triangle. Price is expected to dump to $19k. -35%.
THIS IS NOT A FINANCIAL ADVICE, DYOR.
FOLLOW AND LIKE IF THIS WAS HELPFUL.

What's Next On APE (complete analysis)Interesting fact about the current APE situation here I give detailed analysis.
First, Ape breakdown from the overall 70% Fibonacci retracement which is unlikely, then it went further to break the 100% Fib. retracement again this is very unusual considering how bullish the APE market was but it happened due the the overall catalyst (BTC, UST, LUNA).
Now here comes the big question, are we done with the downtrend?
Yes we are. How?
On the right hand side you can see that a break of structure (BOS) occurred causing the manipulator, market monger, stop loss hunter (whatever name you give them) to take/provide liquidity, wait that's not enough, yea but I have more.
On the chart you can see where I annotate HL(higher low) and LL(lower low) while the RSI indicator forms the opposite LL,HL which is a strong bullish divergence
Now we have 2 scenarios the symmetrical triangle or the descending triangle. If the symmetrical triangle breaks down, you might want to watch out for the descending triangle before exiting the trade if you check my previous analysis on symmetrical triangle you will notice I mostly have 2-3 backup plan for it.
Unless I see a divergence at the oversold region of the RSI or again some unfavourable fundamental news and of course possibly BTC dump, I am holding my long position on APE.
Build your buy/long position in between the 0.78 Fib. retracement and 1.00 Fib. retracement price level and set your stop loss at $6.55 for mid - long term while for short term set stop loss at the breakdown of the symmetrical triangle to the especially if price closes below the 100% ret. level ($7.280).
Have a suggestion? What do you think
comment below, like and share also see t.me/dewycandles for records of profit bagged from our APE analysis.

GAL/USDT - symmetrical triangle with up to 70% upside potentialGAL/USDT is currently consolidating inside a symmetrical triangle inching closer to a breakout and the current price action makes me fairly confident in a move to the upside.
Since this is a new listing there's not a lot of price history to go off but with a current marketcap of $220 million only ranked at #232 on CoinMarketCap there's solid upside potential.
First and main target of this trade is at around $8.50 which also marks the key resistance that needs to be broken in order to fully take off.
Second target is between $11-$12, the level that the first bounce attempt got rejected at.
If it gets rejected on the first attempt at the key resistance we can expect it to come down to the upper trend line of the symmetrical triangle for a re-test.
This could provide a decent re-entry point but we'll have to wait and see how the chart comes along, make sure support holds before buying.
Either buy the breakout of the symmetrical triangle (less risk in case of a pattern failure) or build a position while it's still forming the pattern (more profit potential at the cost of potentially getting stopped out in case the pattern breaks down).
Consider using a stop loss slightly below the triangle so you don't get stuck if this setup gets invalidated.
Best of luck and let me know what you think!

Flash Spikes and Triangles and SymmetryThese violent delights have violent ends, no doubt... but for now... How bout a magick trick:
+8k by the weekend
Target flash spike level, straight up through the yellow horizontal level where supply = demand
