XRP/USDT BREAKS OUT: 50% Surge Incoming?🚀 Hey Traders! 👋
If this setup excites you, hit that 👍 and smash Follow for trade ideas that deliver real results! 💹🔥
XRP: Ready for Takeoff! 🚀
XRP has shattered its symmetrical triangle on the 4-hour chart and is now retesting the breakout level. If this level holds, we're looking at a potential 50% surge to the upside! 📈 This could be your golden entry—don’t miss out.
Trade Setup:
Entry Zone: Current Market Price (CMP); add up to $2.30
Profit Targets: $2.62 / $2.86 / $3.12 / $3.38 / $3.66
Stop Loss: $2.16 (Stay safe!)
Leverage: Keep it conservative (Max 5x)
💬 What’s Your Take?
Do you see XRP’s explosive potential here? Let us know your analysis, strategies, or predictions in the comments below. Let’s conquer this market together and bag those profits! 💰🌊
Symmetrical Triangle

EURCHF strong bullish expectations
OANDA:EURCHF in my EC idea before this one price is start moving bearish, at end i am make update and say will make new idea on OANDA:EURCHF when price start moving again bullish.
Today we have strong bullish push, price is come again in zone and SYMMETRICAL TRIANGL pattern is visible.
Technically on higher TFs are strong bullish, personaly strong bullish here
SUPP zone: 0.93500
RES zone: 0.94800, 0.95300

BTC: QUICK UPDATE AND CPI EFFECT!!🚀 Hey everyone! 👋
If you’re loving this analysis, smash that 👍 and follow for more high-value trade setups that actually deliver! 💹
BTC Update:
Bitcoin is currently forming a symmetrical triangle while holding the $90k support like a champ! 🚀 It’s bounced back strongly so far and is trading within the triangle—but the next big move hinges on the CPI data.
📊 Here’s what to watch for:
Bullish Scenario: If CPI data is favorable, we could see a breakout from this triangle, potentially driving BTC to a new all-time high (ATH)! 🌕
Bearish Scenario: If CPI data disappoints, BTC could revisit the $90k support. A break below $90k might take us to $85k or even lower levels.
💡 Key takeaway: Stay cautious and wait for the CPI data to give us a clear direction.
🔥 What’s your take? Are we heading for a new ATH or dipping below $90k first? Let us know your thoughts in the comments!
Let’s navigate this market together—stay tuned for updates! 🚀

GOLD → False or true resistance breakout?FX:XAUUSD is trying to consolidate above the previously broken boundary of the ascending channel and symmetrical triangle. The struggle that has not ended creates risks for both buyers and sellers.
Economic problems in China and Trump's policy risk continue to support gold.
Inflation expectations are rising amid rising oil prices and the outlook for trade policy in the US. Friday's NFP report showed strong employment growth, making it less likely that the Fed will significantly cut interest rates in 2025
Traders' attention is also focused on CPI data to be released on Wednesday and its impact on future Fed policy.
Resistance levels: 2690, 2700
Support levels: 2685, 2678, 2665
At the moment, the price is in consolidation above previously broken resistance.
If there is no bullish momentum and the price makes a false break of the channel resistance, in that case gold may go down to 2678 - 2665.
BUT, a break of the local downside resistance could trigger buying and upside to targets: 2700
Regards R. Linda!

EURCHF strong bullish expectations for next periods
OANDA:EURCHF highly interesting chart, many pulls back, strong zones and nothing special we are not see still, here having strong bullish expectations for next periods, let's analyze.
Trend line visible (doted line), price is make few push on her, but we can see there are not bi with some strong returns, long moves, after pushes are come pull backs.
Currently price is on strong zone, and SYMMETRICAL pattern is visible and ASCENDING TRIANGL pattern is visible, their structure are much more better visible on lower TFs 2 and 1h.
Here on todays events expecting bullish push
SUP zone: 0.93700
RES zone: 0.94750, 0.95000

GOLD → Paranormal growth on the back of strong NFP...FX:XAUUSD is rising with the dollar and strong NFP data. Those who shouted that the metal is ceasing to play the safe haven function are very much mistaken :)
The surprise of rising NFP data and rising gold, which is not specific in this context, surprised the market quite a lot. After all, rising data points to a more hawkish stance of the Fed and generally medium-term policy in the US. But based on the environment, we can say that gold is rising because of the risks of the policy of Trump, whose inauguration will be held on January 20.
Now all eyes are on the US Inflation data. The upcoming week, will be quite interesting.
Technically: GOLD is breaking the consolidation resistance (symmetrical triangle) and is trying to consolidate above this boundary. Most likely, the struggle will continue and the price may test the previously broken figure boundary or liquidity zone 2675 - 2664, which will determine the further development of events.
Resistance levels: 2698, 2721, 2750
Support levels: 2675, 2665
The situation is quite unstable, as there are too many factors putting pressure on the prices.
Accordingly: if after the retest the bulls are able to keep the price above 2680-2690, the growth may continue in the mid-term ( till January 20 approximately ).
But! If the bullish structure will be broken and bears will start to keep the price below 2680, it can provoke correction to 2665, 2650.
Regards R. Linda!

STORJ Breakout Loading Is a Bullish Surge on the Horizon?Pattern and Setup
Symmetrical Triangle Formation. A bullish pattern indicating potential upward momentum.
The price is currently consolidating within the triangle, nearing a potential breakout point.
Key Levels and Targets
Trendline Resistance at $0.70 this is a critical breakout level to watch.
Breakout Confirmation above $0.70 could lead to a significant upward move.
Strategy
Wait for a clear breakout with strong volume above $0.70 for a bullish entry.
Upside potential will depend on market conditions and momentum after the breakout.
Risk Management
Consider placing stop-loss levels below the lower trendline or recent support to manage downside risk. Target prices can be adjusted as the breakout unfolds, monitoring resistance zones.
Insights
Symmetrical triangles often indicatecontinuation, and this setup leans bullish. However, always confirm with volume for stronger conviction. Stay alert for false breakouts or a downside breach if momentum fades.

ALGO's expected movement!BINANCE:ALGOUSDT
ALGO is in a symmetrical Triangle which means we can't be sure of the coming movement. BUT! Ichimoku cloud shows a positive sign to us which means the price can increase to the top of the pattern easily👍
⚠️ Disclaimer:
This is not financial advice. Always manage your risks and trade responsibly.
👉 Follow me for daily updates,
💬 Comment and like to share your thoughts,
📌 And check the link in my bio for even more resources!
Let’s navigate the markets together—join the journey today! 💹✨

BTC/USDT Pullback to Key SupportThe chart highlights Bitcoin's breakout from a symmetrical triangle formation, followed by a pullback to a critical support level. This price action indicates a period of consolidation before the next significant move.
Key Observations
1. The breakout from the symmetrical triangle has propelled the price upward, signaling bullish momentum.
2. The area around $97,100 is a crucial support level where buyers may step in.
3. A breakdown below $97,100 could lead to further downside, indicating a continuation of the pullback.
4. If the price holds above this support, a strong bounce and continuation of the uptrend are expected.
Strategic Implications
Monitor the $97,100 level closely. A strong defense of this support could provide an opportunity for long positions, targeting the next resistance levels.
Conversely, a confirmed break below $97,100 would warrant caution, as it may signal further downside.
Patience and careful observation are essential to capitalize on the next move effectively.

symmetrical trianglehi we have a symmetrical triangle that has broken the lower line of triangle and the last pivot of triangle and we hope that the price going down to 0.00001981 or more to 0.000195.

ARB/USDT Symmetrical Triangle Breakout with Pullback OpportunityThe chart depicts a Symmetrical Triangle pattern, indicating a phase of consolidation followed by a confirmed breakout to the upside. Currently, the price is undergoing a pullback, presenting a potential opportunity for entry within the retracement zone.
Key Observations
1. The Symmetrical Triangle structure has already been breached, signaling the continuation of bullish momentum.
2. The price is retracing towards the $0.85–$0.84 zone, which aligns with key support and represents an attractive area for accumulation.
3. The projected target post-breakout is approximately $1.00, consistent with historical resistance levels and the triangle's measured move.
Strategic Implications
Focus on the pullback as a buying opportunity near $0.85–$0.84. Ensure the pullback holds within this range to confirm support and validate the bullish setup. Look for signs of reversal, such as bullish candlestick patterns or increased volume, to reinforce confidence in the trade. Set a stop-loss below $0.80 to mitigate downside risk, while aiming for the $1.00 target as the primary profit zone.

XRP → Consolidation before the breakout and rally ↑BINANCE:XRPUSDT has been in consolidation for a little over a month after a strong rally and this is a good sign indicating that there is still strength in the market. And as we know, consolidation at some point turns into distribution
The symmetrical triangle in our case has the character of a consolidation pattern, the purpose of which is the continuation of the trend. Buyers are aggressively defending the support zone, forming a cascade of levels. But more remarkable concerning the pattern is the consolidation 2.5 - 2.337, which is formed near the triangle resistance. Consequently, we can assume that the market is accumulating strength to break the resistance.
Fundamentally, the project has very good prospects after a long and protracted winter. Trump's victory and the changes provoked by him have a favorable impact on Ripple.
Resistance levels: 2.5, 2.73, 3.05
Support levels: 2.337, 2.2, 2.00
Accordingly, the realization phase will start after breaking the resistance of 2.5. Thus, we can assume that the exit from the accumulation will be upward, which can also be helped by a bullish and growing bitcoin.
Regards R. Linda!

Waaree Energies Forms Symmetrical Triangle: Next Steps...?WAAREE ENERGIES is currently developing a symmetrical triangle pattern on its price chart. This technical formation suggests that the stock is consolidating, with decreasing volatility as it approaches the triangle's apex. At this time, the share price has bounced off the lower trendline of the triangle, which is situated at the 2820 price level. This rebound indicates potential support at that level, suggesting that buyers are entering the market. If WAAREE ENERGIES successfully breaks out above the upper trendline of the triangle, we could possibly see a significant price movement, signaling a bullish trend. Traders should closely monitor key levels and volume as the pattern unfolds to capitalize on any potential breakout.

VANRY/USDT Breakout Alert: Ready for a 100%+ Rally!!🚀 Hey Traders! 👋
If this setup excites you, hit that 👍 and smash Follow for trade ideas that deliver real results! 💹🔥
VANRY: Primed for Liftoff! 🚀
VANRY is breaking out from a symmetrical triangle on the 4-hour timeframe and has successfully retested it. The chart is screaming bullish potential, and this could be the start of an explosive move!
📍 Entry Range: Current Market Price (CMP) – Add more up to $0.115
🎯 Target: 100-120% upside potential
🔒 Stop-Loss: $0.108
⚖️ Leverage: Use low leverage (Max 5x) to manage risk
💬 What’s Your Take?
Do you see the same explosive potential in VANRY? Share your analysis, strategies, or predictions in the comments below. Let’s capitalize on this opportunity together and secure those massive gains! 💰🌊

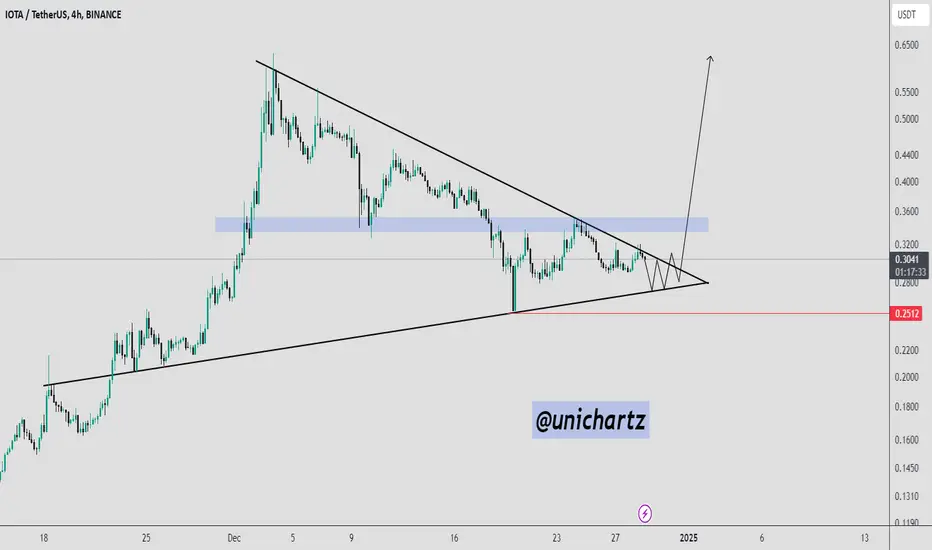
IOTA at $0.28 Support: Breakout or Breakdown Ahead?IOTA/USDT is trading within a descending triangle pattern, indicating consolidation with lower highs and steady support.
The initial support is at the $0.28 level, providing a key area to watch for potential breakdowns.
A breakout above the descending resistance trendline could trigger a bullish move, with targets in the $0.36-$0.38 zone.
DYOR, NFA
QNT Breaks Out! Is a 64% Rally on the Horizon?QNT/USDT has broken out of a descending triangle, signaling a potential bullish move. If the breakout holds, the price could target a 64% upside, as projected by the measured move.
Watch for a retest of the breakout level and triangle support for confirmation.

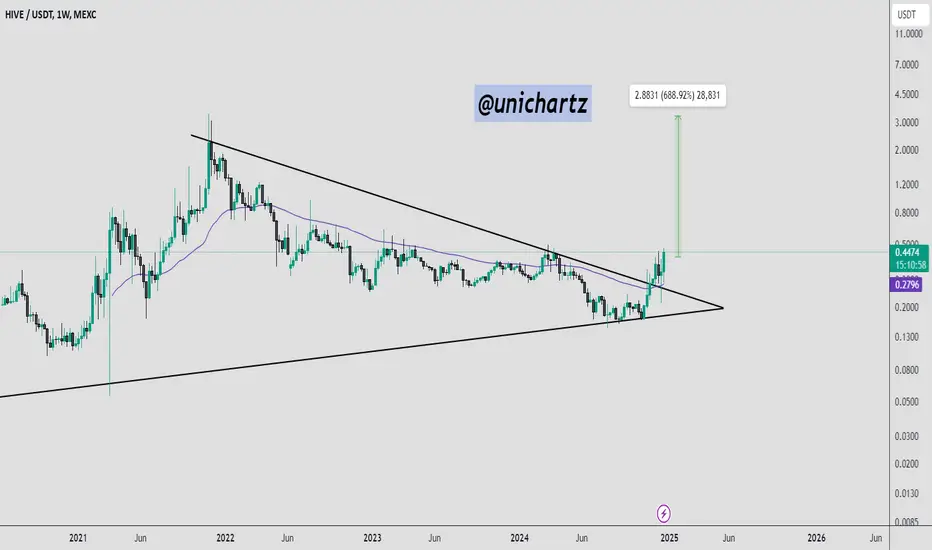
HIVE/USDT Breaks Multi-Year Triangle: Bullish Momentum Ahead?HIVE has broken out of a multi-year symmetrical triangle pattern on the weekly timeframe, with the price currently trading at $0.4456. It is now well above the 50-week EMA, which provides dynamic support around $0.28.
This breakout signals a strong bullish move, with potential resistance targets at $0.50 and $0.65. Watch for a retest of the breakout level for possible re-entry opportunities.
RENDER/USDT Breakout Alert: 200%+ Pump on the Horizon?🚀 Hey Traders! 👋
If this setup resonates, smash that 👍 and hit Follow for trade ideas that deliver results! 💹🔥
RENDER is looking primed for action! It’s broken out of a symmetrical triangle and successfully retested during the recent dip. This could be your chance to accumulate and add more on pullbacks. I’m eyeing a potential 200-250% pump this altseason! 🚀
📈 Trade Setup:
Entry Range: $6.7 - $7.7
Targets: $10 / $14 / $19 / $25
Stop-Loss (SL): $5.60
💬 What’s Your Take?
Are you seeing the same explosive breakout potential? Share your analysis, thoughts, or predictions below. Let’s ride this wave together and lock in massive gains! 💰🌊
🔔 Stay Tuned for More Winning Setups!

HBAR/USDT: Breakout Alert: 50%+ Upside Incoming?🚀 Hey Traders! 👋
If this setup speaks to you, hit that 👍 and smash Follow for trade ideas that actually deliver! 💹🔥
HBAR Looks Ready to Fly! 📈
HBAR is breaking out of a symmetrical triangle on the 4-hour timeframe—a classic bullish signal! Momentum is building, and we’re eyeing a 50-60% upside move. Now’s the time to position smartly:
🔹 Entry Range: CMP and accumulate up to $0.295
🔹 Targets: $0.328 / $0.366 / $0.412 / $0.444 / $0.495
🔹 Stop-Loss: $0.27
🔹 Leverage: Keep it low (Max 5x) ✅
💬 What’s Your Take?
Are you seeing the same explosive breakout potential? Drop your analysis, thoughts, or predictions below! Let’s ride this setup together and lock in those gains. 💰🌊
🔔 Stay Tuned for More Winning Setups!
Hit Follow, pin us to the top, and never miss the next big move! 🚀📊

USDJPY → Consolidation of price in the sell zoneFX:USDJPY reaches a strong resistance at 153.87 within an uptrend. Will this direction continue, as the Fed rate meeting is ahead....
Fundamentally, today is a big day for the markets. At 19:00 GMT the Fed rate meeting, where with a 93% probability the decision to cut interest rates by 0.25% will be made, which will make the dollar less attractive, but for how long, given Trump's policy?
Accordingly, the dollar is in a consolidation phase, traders are waiting. If the dollar starts a downward correction, it will affect the currency pair accordingly. But I do not exclude that on the background of high volatility the price may form a retest of resistance and a false breakout.
Resistance levels: 154.95, 156.75
Support levels: 151.44, 159.69
At the moment, after the retest of 0.79 fibo and the key resistance at 153.877, the price is consolidating in the selling zone. The fundamental background may increase the pressure, which may lead to a fall.
Regards R. Linda!

XLM - BullishXLM is in consolidation with its sideways movement. The sideways movement seems to play within a symmetrical triangle with the ability to continue its upward trend. The 20ma and 200ma are still in play after its golden cross in early November. According to the Relative Strength Index (RSI), XLM is currently in an oversold condition. However, the On Balance Volume (OBV) shows that XLM has increased buy pressure as it's in price discovery. I believe it's finding new lows at a higher value before the break to new resistance levels. There are many bull signals, which makes me bullish on XLM.
Support - $0.43
Resistance - $0.56
Fear and Greed Index - 79 (80 = Extreme Greed; if the market hits extreme greed, be prepared to watch things moon.)

VANRY/USDT: 50% PROFIT POTENTIAL SETUP!!🚀 Hey Traders! 👋
If this analysis hits the mark for you, don’t forget to smash that 👍 and hit Follow for premium trade setups that actually deliver results! 💹🔥
VANRY Looking Strong! 📈
VANRY is forming a symmetrical triangle on the 4-hour time frame and is holding the lower trendline like a champ. A solid bounce looks imminent from here. This could be your chance to catch a big move early! 🚀
📌 Trade Setup:
Entry Range: CMP and add more up to $0.138
Targets: $0.16 / $0.178 / $0.192 / $0.214 🎯
Stop Loss: $0.132 (Keep risk in check)
Leverage: Low leverage only (Max 5x)
💬 What’s Your Take?
Are you seeing the same breakout potential? Drop your thoughts, analysis, or predictions in the comments—let’s strategize and ride this wave together for massive profits! 🌊💰
👉 Stay tuned for more winning setups! 🚀💹

Doesn't make any sense a drop, right?It makes no sense that this company is dropping today, but there is a reason for it: it was forming this massive symmetrical triangle that aims to take us to a new high. In fact, it left two vectors with a formation waiting to be completed, perhaps today or during this important week of the FED meeting.
