CTSIBTC is creating a symmertical triangle 🦐📐The price is testing the upper resistance of symmetrical triangle. IF the price will have a breakout and test the current resistance as new support, According to Plancton's strategy (check our Academy), we can set a nice order
–––––
Follow the Shrimp 🦐
Keep in mind.
🟣 Purple structure -> Monthly structure.
🔴 Red structure -> Weekly structure.
🔵 Blue structure -> Daily structure.
🟡 Yellow structure -> 4h structure.
⚫️ Black structure -> <4h structure.
Here is the Plancton0618 technical analysis, please comment below if you have any question.
The ENTRY in the market will be taken only if the condition of the Plancton0618 strategy will trigger.
Symmetrywaves

$T Symm.Triangle Breakout vs Fakeout?Hello Everyone!
I recently had a successful play on ATT purchasing some calls before this past weeks uptrend on $T
Unfortunately, since I didn't enter the trade with any real, calculated goal targeted, the position was exited once I saw an enticing percentage of gains.
While I'm overall happy with the results, I couldn't help but notice the disappointment in myself as the price on the calls continued to rise even more after I sold them, knowing I could've quite
easily returned even more from the position.
So I've pulled up AT&T to get a closer look to see if I can identify any other clear opportunities on a new position.
If things play out along with my idea, I'll enter a new position and this time with a more calculated plan- as is my main trading goal for this new year.
To trade with more calculated entries and target goals to exit & improve accordingly.
$T seems to be bouncing within a more symmetrical triangle pattern, with no real success breaking out- as noted by the circles marking the failed attempts.
Personally I'm predicting that with some of the new business strategies AT&T is aggressively taking on recently, we could see some buyer confidence based off of those fundamentals. This could support the possibility of finally breaking out of this Symmetrical Triangle. We also seem to be retesting the resistance more than the support.
If price breaks above the horizontal line (marked BULLISH), a pullback using that line as new support would be a great point for an entry. The top of that green arrow marks the target, slightly under $37
While watching this play out, I'm considering if taking on this move in the form of going long on both shares & some Options calls would be a strong move?
That play would require some closer consideration to avoid over exposure to risk.
I say that, because at this point it seems equally telling that ATT could continue downward, especially if resistance holds on a retest and buyer confidence weakens.
I've laid out the 50 MA (thicker white band) & the 20 MA (thinner yellowish band)
the 50 MA will help as a tool to plot safe stop losses without being too overprotective of the position resulting in getting stop'd out.
I'll try to update on which way my view of this potential plan plays out on this idea.
Please feel free to give friendly but honest critiques!
Happy Trading!
*this is not financial advice*
**all my charts are for educational & personal tracking purposes**


GBPUSD - The best opportunities for Sell GU50% for all predicting.
- GBPUSD is at zone Weekly for sell.
- H1 timeframe breaks the rule of symmetry waves.
...Wait for a sell at Waves 4 with the small stop loss.
...Wait to occurs new rule symmetry wave.

ADA/USDT (Cardano) SYMMETRIC TRIANGLE BREAKOUT#ADAUSDT (1h Chart) Technical Ananlysis Update
Symmetric Triangle
ADA/USDT currently trading at $0.68
LONG ENTRY: Only enter long after Symmetric Triangle Breakout in 1 h chart
STOP LOSS: I will update soon
Resistance level 1( Target): $0.182
Resistance level 2 (Targe ): $0.195
Resistance level 3 (Target ): $0.235
Max Leverage: 10X
ALWAYS KEEP STOP LOSS...
Please Follow our Tradingview Account, Like, Share and Comment your thoughts

BIG PUMP BEFORE GREATEST DUMP IN HISTORY ?Hello all of you guys,
Here again the same idea based on TIP (The Inverse Parabol) axes and symmetries analyisis...
Hope you enjoy it! ;-)
Thank you for leaving the comments and a "like" just in case you like it, of course! ;-)
L&GL
Regards to all!
previous idea:

GOLD: Uptrend stalling??This chart shows that recent swing high is very weak. If you look at the previous swing its easy to note that price smashed right through the 161.8% and profit taking occurred around 200%. From here prices rallied higher up to the 361.8% extensions.
Looking at the recent swing, it would be safe to assume the heavy limit orders to be sitting around 161.8%. The rejection from 127.2% was severe and caused a lot of trouble for the average bull in this market.
Considering how gold has seemed to correct for about 50 days previously, the rally up should continue somewhere around March.
NOW if we start to get a close above 127% or even 161.8%, consider this analysis invalid. It is expected to go further and can become very extended if we happen to close above these levels.
If not a healthy pullback should be expected!
Thank you for reading!
Happy trading and may God bless

USDOLLAR - Expecting to retest Top and new TopDaily timeframe is at Symmetry wave zone (4), expect to go from wave (4) to (5). USDOLLAR is at value zone.
H4, H1: has a buy signal with MACD, RSI, FORCE INDEX

MU - long-term short setupMicron reached nice levels where to start building short position.
In worst case scenario $MU may fall as far as 70% from current levels, which is not absurd, given that the company is very cyclical, and global economy risks entering recession.
More prudent approach is to wait when bear flag would be broken below 40$, however, given current overbought level, MACD divergence and current wave C reaching symmetry with A in potential corrective B of larger degree , we are in very good spot to try first entry, and then move stop tighter, if we will see move lower in the upcoming month.
Stop: 64.67
Target: ~20$
NASDAQ:MU

USOIL - Expecting to retest the last bottom- Now Oil is at Symmetry wave IV, I forecast he will go to Symmetry wave V.
- Be careful with RSI & MACD signal must take Stop loss
EURGBP - Continue uptrend from 15-19/4/2019- The Main signal is MACD is highest during for3 months. Expecting to retest TOP and a new Top.
- The 2nd key is the slope of FORCE INDEX and RSI
- The 3rd key is EURGBP breakout the support level (Volume Profile).
* 3 targets are calculated by Elliot rule.

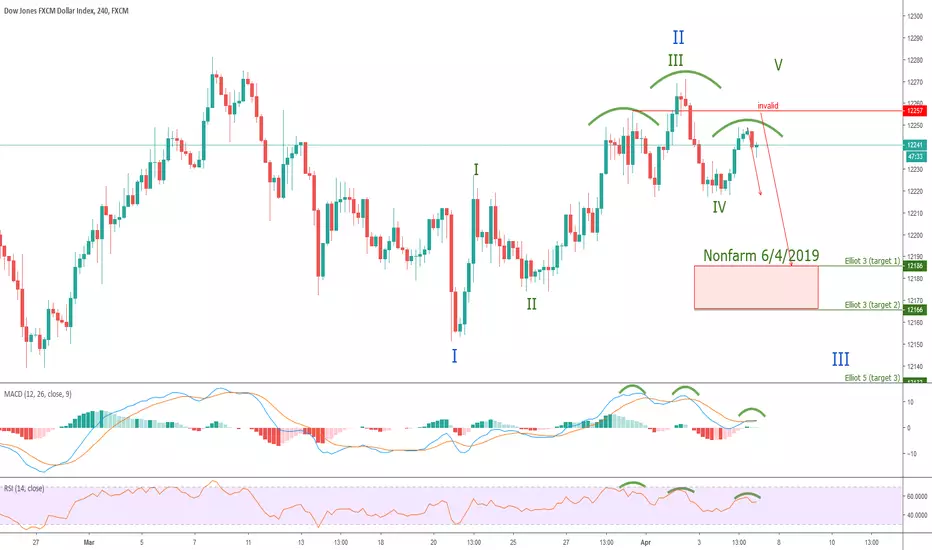
USDOLLAR - short with Nonfarm news 06/04- Head and shoulder: Chart - MACD, RSI for a sell.
Good luck.

GBPUSD - drop to next Brexit 21-22/3/2019- The 1st key for a sell, MACD lowest during for 3 months, to hope a retesting Bottom.
- The 2nd key is a real Divergence RSI, a new top at the chart but RSI does not exceed 70
- Divergence MACD is the 3rd key.
- The 4th key is the Close did not exceed the upper Bolliger band.
Thus, I forecast GBPUSD will drop to the Symmetry wave III to wave IV.

USDCAD - A big Uptrend soon.- The main key for my trading is Highest MACD during for 3 months at the Symmetry wave 3 (was exceed the upper Bolliger Band.
- Force index indicator is up.
- Now the price is at the mid-Bolliger Band (zone Symmetry wave 4).
- 3 targets are calculated by Elliot rule.

EURGBP - A Correction for Uptrend- The 1st key is the real divergence RSI (The point A was exceed 30, but C is not).
- The 2nd key is the real divergence MACD (point B was exceeded THE line 0).
- The 3rd key is the slope of MACD & SIGNAL.
Thus, I forecast EURGBP will up from the Symmetry wave III to IV.

GBP INDEX - A corrective for down on next Brexit 21-22/3/2019My main focus for signals is a bearish divergence on the MACD and RSI.
At the new TOP, RSI is not beyond 70.
Bolliger Band is not plugged deeply at wave V. Maybe GBP index has rejected a break for an uptrend and corrected continue.

CAD INDEX - short at Symmetry wave 6Wait for CAD index pass over MA200 = 4% and RSI must not beyond 70 for a sell + a divergence is at Momentum

SPX - A big drop soon.Look left, 24 Dec 2018 at the Symmetry wave (I) was broken the Uptrend, MACD histogram was lowest.
Thus I predict SPX step to the Bear Market at the Symmetry waves (II) to (III)
* Indicator:
- The MACD and FORCE INDEX is decreased.
- The MACD & signal Crossovers
- Real divergence RSI (The point A is higher 70, but point C is not).
* This is the third times SPX retest the Resistance.

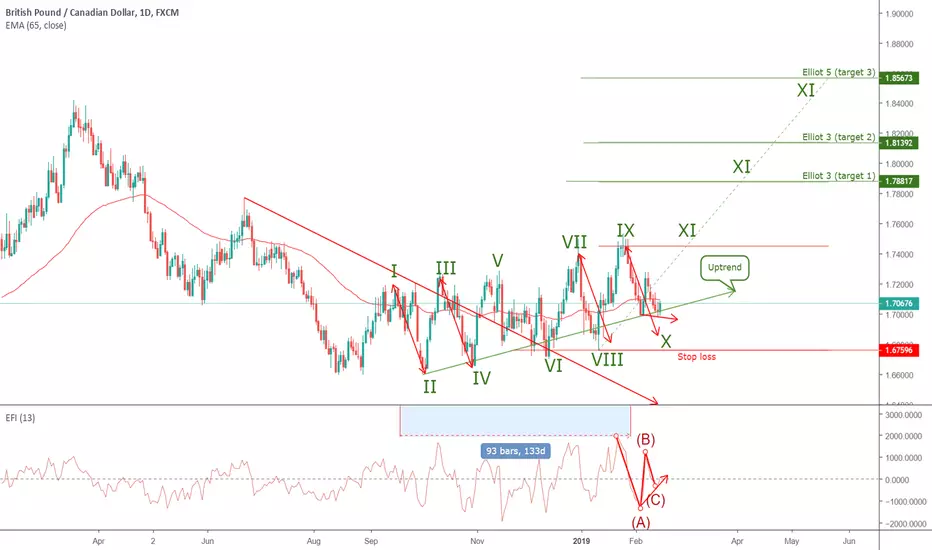
GBPCA - Hold long with targets Elliot wave rule- 3 months highest FORCE INDEX for an Uptrend.
- Real Force index divergence.
- 3 times confirmed at Symmetry wave II, IV, VI, VIII, X. Now is at zone Symmetry wave X.
Thus, I predict GBPCAD has a big Uptrend with Elliot wave targets.
Do not die in front of paradise
GBP INDEX - A corrective for down trendMACD & RSI divergence for a short.
Note: GBP index reached the Elliot wave 5 (27/2/2019) but RSI not beyond 70. The Candle Stick is at Upper Bolliger band.
I predict GBP index will correct down from the Symmetry wave III to IV.

AUDJPY - short at Symmetry wave VIII to IXLook left, At the Symmetry wave (I, II, III, IV, V, VI, VII, VIII) occur The Real Divergence MACD & FORCE INDEX, is always has a reversal.
Thus, I predict AUDJPY has a reversal for down from the Symmetry wave VIII to IX.

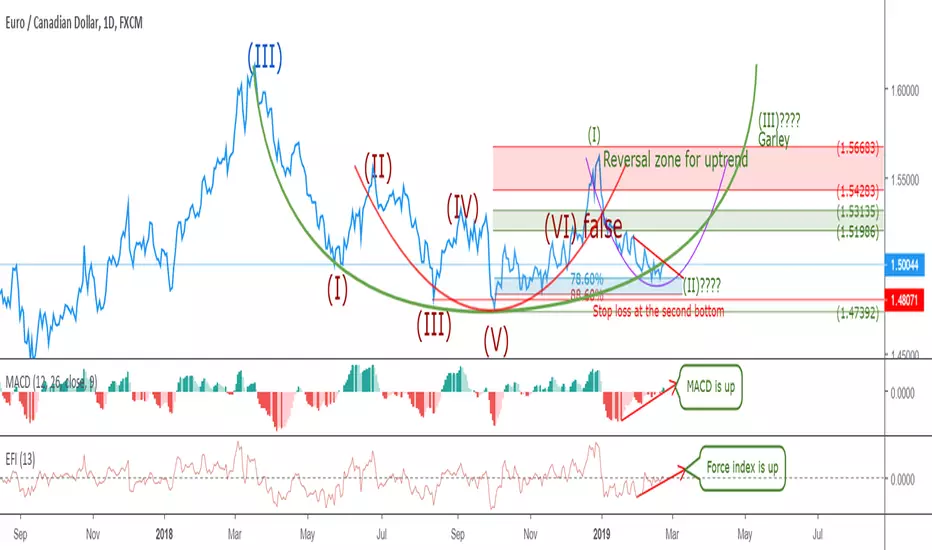
EURCAD - Big Uptrend with rounding bottom patternLook left, Symmetry wave (VI) was broken and confirm zone reversal for UPtrend.
- Rounding Bottom:
1. The biggest Green rounding bottom is at Neckline.
2. The second Red rounding bottom completed.
3. The last Purple rounding bottom looks the previous.
- Indicator:
MACD & FORCE INDEX is upward.
Thus, I predict EURCAD will go uptrend from 78.6 Fibonacci Retracement.
Target is at Harmonic Garley Pattern (Symmetry wave (III)