SYNGENE INTERNATIONAL LTD at Old Peaks Key Support 📈 Monthly Chart – Key Support at Old Peaks
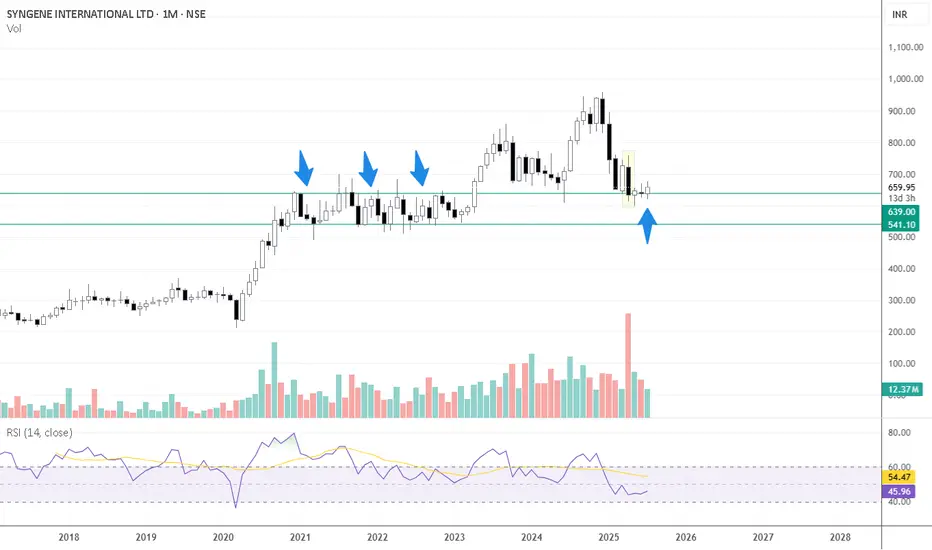
The stock has recently revisited the ₹600–₹610 range, which corresponds to a previous consolidation and monthly swing-low zone (~₹607) from November 2020 to April 2023 on the monthly timeframe
This zone isn’t just another support level—it represents an area where price historically spent over 2.5 years, making multiple tests before breaking higher. Such zones often act as strong demand zones when revisited
A sustained hold above ₹607 would reinforce this support, signaling a potential base for a multi-month reversal or bounce
🕯️ April Monthly Candle – Selling Exhaustion?
Large bearish candle in April (FY25 Q4 results month).
High volume, which often signals capitulation or Selling climax.
Price has since stayed within the range of this candle-no breakout above or below.
Indicates a potential exhaustion of sellers if the stock holds above the low of that candle, this structure often represents a volatility compression after a sharp move-like a spring coiling.
Syngenelong
Syngene International Ltd. - Long Setup (Swing Trade)Syngene International Ltd. has confirmed a breakout above the entry zone, offering a potential swing trade setup.
Here’s the trade plan:
Entry Price: 897.90 (Confirmed after the 15-minute candle broke above the entry zone at 895)
Target: 1027.90
Stop Loss: 828.65 (Stop loss will be triggered if a daily candle closes below this level)
With the entry price confirmed at 897.90 , the setup offers a favorable risk-to-reward ratio. The stock is targeting a move toward 1027.90 , with a well-defined stop loss at 828.65 to manage risk.
Disclaimer: This post is for educational purposes only and is not financial advice. Always manage your risk and trade responsibly.

break outSure! Here's a fun, visually engaging explanation of the pattern and setup for social media using emojis and a clean structure:
---
📊 **Syngene International Ltd. - Head & Shoulders Pattern Breakdown** 💡
🔍 **Pattern**: Head & Shoulders (Bullish Breakout)
- 👕 **Left Shoulder**: Price forms a peak.
- 🧢 **Head**: A higher peak, followed by a decline.
- 👕 **Right Shoulder**: A lower peak, matching the left shoulder.
💥 **Breakout**: The price broke **above the neckline** (₹860), signaling a bullish reversal 🚀!
📈 **Last 5 Candles**:
1️⃣ Big green candle 📈 — Strong buying momentum!
2️⃣ Continued rise 📉 — Steady upward pressure.
3️⃣ Smaller candle 🔼 — Trend continues.
4️⃣ Small pause 💬 — Brief consolidation.
5️⃣ Another spike 📊 — Bulls taking over with high volume!
---
🔑 **Target**:
🟢 **₹1,094** (Measured move from head to neckline projected upwards)
🔐 **Stop-Loss**:
🔴 **₹843-₹845** (2% below the neckline for safety)
📢 **Summary**:
🔥 Bullish breakout confirmed with volume spikes!
🎯 Target ₹1,094 📊 | 🛑 Stop-loss at ₹843.
---
Here’s a creative way to encourage your audience to **like**, **subscribe**, and **share** using the same fun style:
---
🔥 **Enjoyed the analysis?** 🔥
👉 Don’t forget to **LIKE** this post if you found it helpful! 👍
👀 Want more updates like this? **SUBSCRIBE** to stay in the loop! 🔔
🙌 **SHARE** with your fellow traders and friends! 🤝
---
📊 **Stay ahead of the market trends** with more patterns, tips, and insights! 📈
💬 **Comment below** if you’ve got questions, or want to see more stock analyses! 🧐
Thanks for your support! Let’s keep growing together 🚀
---
This keeps the tone light, fun, and engaging for your audience to interact! 😊

Syngene Stock for long term Only if 529 lvl is broken and closed below in 1 month time frame will be considered a down trend movement.
which willl last long 6 to 9 month that the price lvl come @ 350/-

SYNGENE - bullish flagSector: Pharmaceuticals
Industry: Pharmaceuticals - Indian - Bulk Drugs & Formln
52 week High / Low: 700 / 490.50
P/E ratio of 62.16
Resistance: 634-645-662
Support: 605-588-577
Look for buying opportunities around 633 for a Target of 686 with a stop loss of 616
Upper Circuit 685.30
Lower circuit 560.70
Syngene is trading above its 9, 20 and 50 EMA mark.
This is a short term view call.

Bullish, Take Long Positionhigher lows and lower highs are formed. good volume accumulation supporting for more upside. #SYNGENE
