#SYS/USDT looks very bullish#SYS
The price is moving within an ascending channel on the 1-hour frame, adhering well to it, and is poised to break it strongly upwards and retest it.
We have support from the lower boundary of the ascending channel, at 0.04060.
We have a downtrend on the RSI indicator that is about to break and retest, supporting the upward move.
There is a key support area (in green) at 0.03980, which represents a strong basis for the upward move.
Don't forget one simple thing: ease and capital.
When you reach the first target, save some money and then change your stop-loss order to an entry order.
For inquiries, please leave a comment.
We have a trend of stability above the Moving Average 100.
Entry price: 0.04221
First target: 0.04356
Second target: 0.04483
Third target: 0.04635
Don't forget one simple thing: ease and capital.
When you reach the first target, save some money and then change your stop-loss order to an entry order.
For inquiries, please leave a comment.
Thank you.
Sysusdt

#SYS/USDT#SYS
The price is moving within a descending channel on the 1-hour frame and is expected to break and continue upward.
We have a trend to stabilize above the 100 moving average once again.
We have a downtrend on the RSI indicator, which supports the upward move by breaking it upward.
We have a support area at the lower limit of the channel at 0.0487, acting as strong support from which the price can rebound.
Entry price: 0.0500
First target: 0.0519
Second target: 0.0544
Third target: 0.0570

SYS (SPOT)BINANCE:SYSUSDT
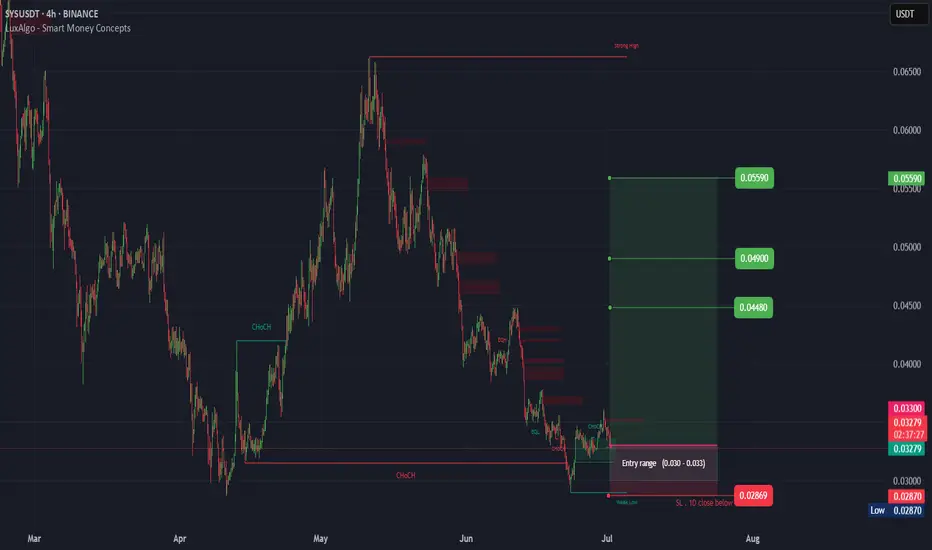
#SYS/ USDT
Entry( 0.030- 0.033)
SL 1D close below 0.02869
T1 0.04480
T2 0.04900
T3 0.05900
_______________________________________________________
Golden Advices.
********************
* collect the coin slowly in the entry range.
* Please calculate your losses before the entry.
* Do not enter any trade you find it not suitable for you.
* No FOMO - No Rush , it is a long journey.
Syscoin: From Bearish to Bullish, The Market Wants ChangeChange is good, but it is not always mandatory. Change is good and recommended only when we are stuck in a certain pattern, in a certain routine or lifestyle, in a certain way of being and we want to experience growth. Exponential growth. When it comes to growth, change is awesome.
Market conditions are changing. Very slowly but still, change is change and change leads to growth. If the market has been stuck too long in the same pattern, the same condition, stagnation is the result.
The market is alive. The market has goals and its goal is to reach you; in order to reach as far as you, the market must grow.
The market understands this dynamic and it will do whatever it takes. The market will not die, it cannot die, so it will do what is necessary in order to promote its own growth. If what the people want is a bullish wave, higher prices, high profits; get ready because the market will give you exactly what you want.
Syscoin has been bearish since December 2021. Apart from a few small bounces, 140% and 400%, it has been going down and really strong, just recently, we witnessed a new all-time low.
Syscoin will not continue in the same pattern for long. In fact, the all-time low happened 7-April, in June, last month, we had a double-bottom (higher low). So the downtrend is over, we are approaching a wave of growth.
The market is changing. The market will change. The change of course will be a major bull run. Instead of lower prices, we will have a multiple-years high, maybe even a new all-time high in the coming months.
In late 2025, everything Crypto will be up. We even have the potential of a multiple years long bull market. Do you agree?
Thanks a lot for your continued support.
Namaste.

SYSUSDT | Still Weak, Resistance Holds at the Red BoxSYSUSDT continues to show fragile price action. Until the red‑boxed area is cleared with genuine volume support, every upward move remains suspect. Here’s how I’d approach it:
Expect Rejections at Resistance
The red box marks a zone where sellers have stepped in repeatedly. Unless SYS clears this level on strong volume, I’ll assume the path of least resistance remains downward.
Shorting on False Rallies
When price makes a pop toward the red box, I’ll wait for two key signals before entering a short:
Low‑Time‑Frame Breakdown: A clear shift in structure on a 5‑ or 15‑minute chart—think lower highs or breakdown of a minor support.
CDV Divergence: If cumulative delta volume fails to confirm the rally, it shows buying pressure is drying up.
Patience Is a Virtue
I won’t force trades when these conditions aren’t met. If SYSUSDT somehow breaks above the red box with conviction, I’ll reassess. Until then, I let the market’s own behavior guide each decision.
By focusing on volume‑backed breakouts and CDV confirmation, or the lack thereof—you avoid chasing moves and trade with genuine conviction.
📌I keep my charts clean and simple because I believe clarity leads to better decisions.
📌My approach is built on years of experience and a solid track record. I don’t claim to know it all but I’m confident in my ability to spot high-probability setups.
📌If you would like to learn how to use the heatmap, cumulative volume delta and volume footprint techniques that I use below to determine very accurate demand regions, you can send me a private message. I help anyone who wants it completely free of charge.
🔑I have a long list of my proven technique below:
🎯 ZENUSDT.P: Patience & Profitability | %230 Reaction from the Sniper Entry
🐶 DOGEUSDT.P: Next Move
🎨 RENDERUSDT.P: Opportunity of the Month
💎 ETHUSDT.P: Where to Retrace
🟢 BNBUSDT.P: Potential Surge
📊 BTC Dominance: Reaction Zone
🌊 WAVESUSDT.P: Demand Zone Potential
🟣 UNIUSDT.P: Long-Term Trade
🔵 XRPUSDT.P: Entry Zones
🔗 LINKUSDT.P: Follow The River
📈 BTCUSDT.P: Two Key Demand Zones
🟩 POLUSDT: Bullish Momentum
🌟 PENDLEUSDT.P: Where Opportunity Meets Precision
🔥 BTCUSDT.P: Liquidation of Highly Leveraged Longs
🌊 SOLUSDT.P: SOL's Dip - Your Opportunity
🐸 1000PEPEUSDT.P: Prime Bounce Zone Unlocked
🚀 ETHUSDT.P: Set to Explode - Don't Miss This Game Changer
🤖 IQUSDT: Smart Plan
⚡️ PONDUSDT: A Trade Not Taken Is Better Than a Losing One
💼 STMXUSDT: 2 Buying Areas
🐢 TURBOUSDT: Buy Zones and Buyer Presence
🌍 ICPUSDT.P: Massive Upside Potential | Check the Trade Update For Seeing Results
🟠 IDEXUSDT: Spot Buy Area | %26 Profit if You Trade with MSB
📌 USUALUSDT: Buyers Are Active + %70 Profit in Total
🌟 FORTHUSDT: Sniper Entry +%26 Reaction
🐳 QKCUSDT: Sniper Entry +%57 Reaction
📊 BTC.D: Retest of Key Area Highly Likely
📊 XNOUSDT %80 Reaction with a Simple Blue Box!
📊 BELUSDT Amazing %120 Reaction!
📊 Simple Red Box, Extraordinary Results
I stopped adding to the list because it's kinda tiring to add 5-10 charts in every move but you can check my profile and see that it goes on..

#SYS/USDT#SYS
The price is moving in a descending channel on the 1-hour frame and is adhering to it well and is heading to break it strongly upwards and retest it
We have a bounce from the lower limit of the descending channel, this support is at a price of 0.0474
We have a downtrend on the RSI indicator that is about to break and retest, which supports the rise
We have a trend to stabilize above the moving average 100
Entry price 0.0540
First target 0.0588
Second target 0.0624
Third target 0.0666

SYS looks very bullish (1D)It seems that a diametric pattern has completed, and the price has reclaimed a key level. A pullback to this level is expected to hold as support, potentially leading the price toward higher zones.
The targets are marked on the chart, and as long as the green zone is maintained, a move toward those targets is expected.
A daily candle closing below the invalidation level would invalidate this analysis.
For risk management, please don't forget stop loss and capital management
When we reach the first target, save some profit and then change the stop to entry
Comment if you have any questions
Thank You

#SYS/USDT#SYS
The price is moving in a descending channel on the 1-hour frame and is adhering to it well and is heading to break it strongly upwards
We have a bounce from the lower limit of the descending channel, this support is at a price of 0.0583
We have a downtrend on the RSI indicator that is about to be broken, which supports the rise
We have a trend to stabilize above the moving average 100
Entry price 0.0646
First target 0.0732
Second target 0.0800
Third target 0.0905

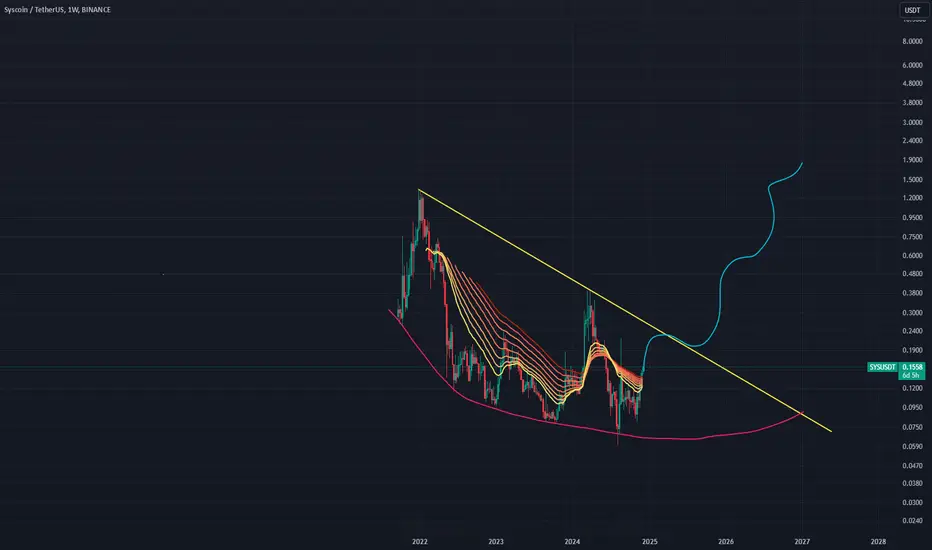
SYS HTF breakout with a nice 3x opportunityClean breakout and retest for SYS with a bottoming pattern indicating parabolic growth.
Next major target is around 2024 highs, which is still approx 3x away from current prices
Looking juicy, entering the trade
Let's see

#SYS (SPOT) IN ( 0.1000- 0.1240) T.(0.6400) SL(0.0940)BINANCE:SYSUSDT
#SYS / USDT
Entry( 0.1000- 0.1240)
SL 1D close below 0.0940
T1 0.1660
T2 0.2600
T3 0.4500
T4 0.6400
2 Extra Targets(optional) in chart, if you like to continue in the trade with making stoploss very high.
______________________________________________________________
Golden Advices.
********************
* collect the coin slowly in the entry range.
* Please calculate your losses before the entry.
* Do not enter any trade you find it not suitable for you.
* No FOMO - No Rush , it is a long journey.
Useful Tags.
****************
My total posts
www.tradingview.com
**********************************************************************************************
#Manta #OMNI #DYM #AI #IO #XAI #ACE #NFP #RAD #WLD #ORDI #BLUR #SUI #VOXEL #AEVO #VITE #APE #RDNT #FLUX #NMR #VANRY #TRB #HBAR #DGB #XEC #ERN #ALT #IO #ACA #HIVE #ASTR #ARDR #PIXEL #LTO #AERGO #SCRT #ATA #HOOK #FLOW #KSM #HFT #MINA #DATA #SC #JOE #RDNT #IQ #CFX #BICO #CTSI #KMD #FXS #DEGO #FORTH #AST #PORTAL #CYBER #RIF #ENJ #ZIL #APT #GALA #STEEM #ONE #LINK #NTRN #COTI #RENDER #ICX #IMX #ALICE #PYR #PORTAL #GRT #GMT #IDEX #NEAR #ICP #ETH #QTUM #VET #QNT #API3 #BURGER #MOVR #SKL #BAND #ETHFI #SAND #IOTX #T #GTC #PDA #GMX #REZ #DUSK #BNX #SPELL #POWR #JOE #TIA #TFUEL #HOT #AVAX #WAXP #OGN #AXS #GALA #ONE #SYS

SYS USDT reasonably bullish structure1.6 fib extension points to 26 cents which can be a reasonable target for perps of SYS. If ETH continues growing relative to BTC and USD, SYS can potentially go to higher targets

funny lines say syscoin 2 dollarsSYS is one of the oldest coins in the world and the chart is definitely one of the most messed up. Nevertheless at ETF we can reasonably expect a push to 2 dollars per SYS this cycle.

SYS - Beautiful Setup!Dear my friends,
After closing the XRP trade to wait for the next opportunity, I continued searching for coins with favorable entry positions. My attention turned to SYS, a coin I previously shared, where many of you hit target 1. I'm still waiting for a chance to enter for the next target.
This time, everything seems clearer. First, the volume is significantly higher than before—it's distinct and green, much like what we saw with Alpha. When I drew the trendline, something remarkable stood out. It revealed a perfect retest and breakout setup. I then plotted my targets and began waiting.
It's rare to come across such a beautiful setup—truly rare!
Best Regards,

Bullish Continuation for SYS USDT on the cardsSYS has maintained its freshly claimed levels of 0.17-0.18 cents and has consolidated at these levels even with RSI cooling off, suggesting little if any sell-offs. Given the coin's history dating back to 2014, it is feasible to assume that vast quantities of coin are lost and the remaining community may be diamond handed. Despite doing a 2x no sell volume. Next target around 0.29 cents where we reassess.

SYS USDT parabolic growth approachingSYS USDT pair are entering a parabolic growth stage. Upward movement can be violent and reach its prior ATH at 1.35 USD after which SYS can head into price discovery
Trading opportunity for SYSUSDTBased on technical factors there is a Buy position in :
📊 SYSUSDT
🔵 Buy Now
🪫Stop loss 0.1000
🔋Target 1 0.1500
🔋Target 2 0.2000
🔋Target 3 0.2500
💸RISK : 1%
We hope it is profitable for you ❤️
Please support our activity with your likes👍 and comments📝

SYS Gold Buy opportunity, same Cycle with 0.22XX is loading SYSCOIN (SYS) has recently experienced a bounce from the bottom, but it's important to be cautious about its future direction.
Key Technical Analysis:
* Fakeout: The last pump was above the $0.117X level could be considered a fakeout, as the price has since retraced to the $.0970 Monthly support level.
* Potential Correction: A deeper correction towards the 0.08XX support levels is possible.
Remember:
* Do Your Own Research: Always conduct thorough research before making any investment decisions.
* Risk Management: Use stop-loss orders to protect your investments from potential losses.
* Diversification: Spread your investments across different assets to reduce risk.
Stay tuned for more updates on Radicle and other cryptocurrencies!
Disclaimer: This is not financial advice. Please do your own research before making any investment decisions.
TRY TO HAVE AN ADVENTAGE And DCA from here

SYS buy/long setupWe have a bullish QM on the chart. Bullish QM features are well observed on the chart.
By maintaining the green range, it can move towards the targets.
Closing a daily candle below the invalidation level will violate the analysis
For risk management, please don't forget stop loss and capital management
When we reach the first target, save some profit and then change the stop to entry
Comment if you have any questions
Thank You

SYSUSDT(Syscoin) Updated till 19-08-24SYSUSDT(Syscoin) Daily timeframe range. it had a huge retrace from its local low. but selling pressure took over and failing to takeover above 0.1470 will trap above level bag holders. staying over 0.1470 can give PA another chance to push. recent support at 0.1006.

#SYS/USDT#SYS
The price is moving within a bearish channel pattern on a 4-hour frame and broke it upward after adhering to it significantly.
We have a downtrend on the RSI indicator, and it has been broken to the upside, and we have a trend to hold above
We have a major support level in green at 0.1020
We have a trend of domes above the Moving Average 100
Entry price is 0.1050
The first target is 0.1116
The second target is 0.1170
The third goal is 0.1220

#SYS/USDT#SYS
The price is moving in a descending channel on a 1-hour frame, about to break to the upside
With a strong support area in green at 0.2000, from which the price has already rebounded
We have a trend to touch the Moving Average 100
We also have an uptrend on the RSI on which the price rests and pushes it upward
Entry price is 0.2066
The first target is 0.2200
The second target is 0.2400
The third goal is 0.2567

SYS BUY SETUPIt seems that we have an ABC that the wave B is a diametric. There is only one G wave left from Diametric. The low risk place to buy is the lower green box. Wave C can advance up to supply
For risk management, please don't forget stop loss and capital management
Comment if you have any questions
Thank You

SYSCOIN will contiue the uptrend moveSYSCOIN will continue the uptrend move after the successful breakout
