Time to invest in JPY and TN/bond? Hello FX/futures traders!
Market is at a pivotal point. Not in a bad way, but in a good way!
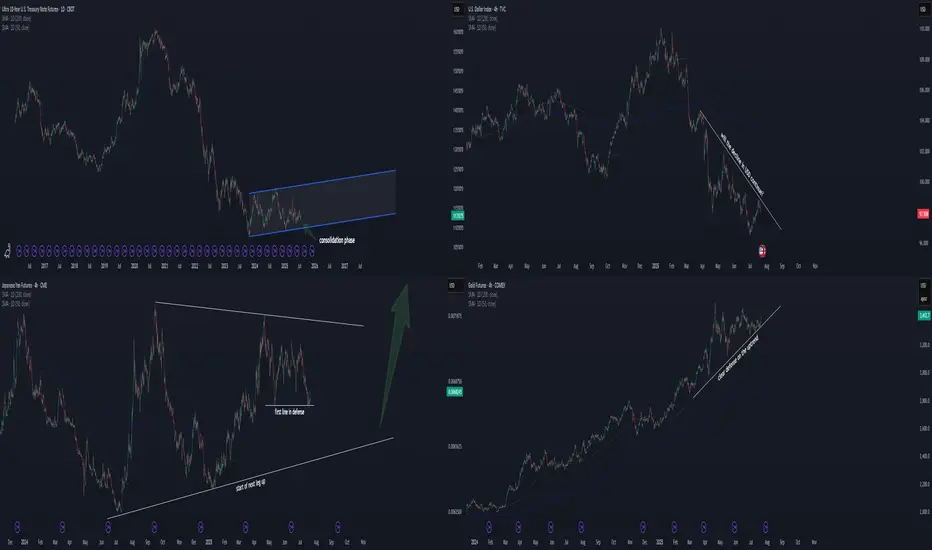
Chart 2: TVC:DXY
Let's start with the US Dollar . A declining USD was just well defended the last few days. If this is true, then the stock up, dollar down scenario is likely to continue. This is good for equities.
Chart 4: COMEX:GC1!
Gold defends its trendline as well. It seems like gold wants to go up more. A raising gold in the current scenario suggests declining USD TVC:DXY . This isn't always true, but we have to look at the current correlation and makes the best educated guess on this.
Logical Deduction 1:
Chart 1: CBOT:TN1!
A consolidation phase has been going on for almost 2 years now. This is definitely
a good sign to long bond, as at least we know the likely bottom for stoploss. With dollar leaning down and gold up, I think TN will defend its current level around 110-113.
Logical Deduction 2:
Chart 3: CME:6J1!
JPY is defending its first key level since May 2025. A wedge is forming, and the breakout is about to take place later this year. Likely the consolidation phase will take more time (with likelihood to breakout to either side). But with a declining USD side by side, I consider now a good entry point to long JPY with controllable risk.
Let me know what you think!
T-BOND
Divergence Since 2020 - What Happens When Bonds Continue?When Stocks & Bond Move Opposite Direction what does it mean?
We have observed a divergence between the stock and bond markets since 2020. While U.S. Treasury bonds entered a bear zone, the stock markets continued their upward climb. What are the implications of this decoupling?
Will the stock market resume its uptrend and hit new highs? Or is this merely a retracement before further downward pressure?
A healthy, three-way interdependent relationship occurs when the economy, bonds, and stocks move in the same direction. When investors have confidence in the U.S. economy, they tend to invest in long-term bonds, which it usually will benefits the stock market.
This alignment was evident between 2000 and 2020, during which bonds and stocks moved largely in tandem.
However, from 2020 onward, bonds began declining—signaling a loss of investor confidence in the economy. Technically, this should exert downward pressure on stocks as well.
Yet, we are witnessing a divergence: Where U.S. Treasury bonds have fallen while stocks have continued to rise.
When such a divergence surfaces, it signals the need for caution in our approach in the stock markets.
What could be the other reasons why US T-bond has peaked in 2020 and depreciated by 44% since then?
Micro E-mini Nasdaq Futures and Options
Ticker: MNQ
Minimum fluctuation:
0.25 index points = $0.50
Disclaimer:
• What presented here is not a recommendation, please consult your licensed broker.
• Our mission is to create lateral thinking skills for every investor and trader, knowing when to take a calculated risk with market uncertainty and a bolder risk when opportunity arises.
CME Real-time Market Data help identify trading set-ups in real-time and express my market views. If you have futures in your trading portfolio, you can check out on CME Group data plans available that suit your trading needs www.tradingview.com
Trading the Micro: www.cmegroup.com

When Stocks & Bond Move Opposite Direction - Its implicationWhen Stocks & Bond Move Opposite Direction what does it mean?
We have observed a divergence between the stock and bond markets since 2020. While U.S. Treasury bonds entered a bear zone, the stock markets continued their upward climb. What are the implications of this decoupling?
Will the stock market resume its uptrend and hit new highs? Or is this merely a retracement before further downward pressure?
Micro E-mini Nasdaq Futures and Options
Ticker: MNQ
Minimum fluctuation:
0.25 index points = $0.50
Disclaimer:
• What presented here is not a recommendation, please consult your licensed broker.
• Our mission is to create lateral thinking skills for every investor and trader, knowing when to take a calculated risk with market uncertainty and a bolder risk when opportunity arises.
CME Real-time Market Data help identify trading set-ups in real-time and express my market views. If you have futures in your trading portfolio, you can check out on CME Group data plans available that suit your trading needs www.tradingview.com
Trading the Micro: www.cmegroup.com

10 Yr Bond Yield breaks downtrend & then falls back into it!10 Yr Bond yields seem to have topped after that massive 1 week run. That was an impressive run! TVC:TNX
Even though the downtrend was broken, the 10Yr Yield put in a LOWER high.
We can also see that the recent uptrend was violated, back in a down trend.
Short term interest rates look worse!

Why Is the T Bond Heading Down?The downward pressure did not start with the Liberation Day tariffs on 2nd April.
Based on the 30-year long-term bond price chart, the market peaked in 2020, then broke below a major support line—established since the 1980s—in 2022.
Since that break, US bonds have been on a downward trajectory.
So, what happened in 2020 and 2022 that set the bond market on shaky ground?
Why is the recent tariff shock just a continuation of developments that began back then?
And where are bond prices heading next?
This goes beyond investors offloading its US Treasury holdings after 2nd April.
U.S. Treasury Futures & Options
Ticker: ZB
Minimum fluctuation:
1/32 of one point (0.03125) = $31.25
Disclaimer:
• What presented here is not a recommendation, please consult your licensed broker.
• Our mission is to create lateral thinking skills for every investor and trader, knowing when to take a calculated risk with market uncertainty and a bolder risk when opportunity arises.
CME Real-time Market Data help identify trading set-ups in real-time and express my market views. If you have futures in your trading portfolio, you can check out on CME Group data plans available that suit your trading needs www.tradingview.com
Trading the Micro: www.cmegroup.com

Can Brazil’s Bonds Defy Global Chaos?In an era of escalating trade tensions and economic uncertainty, Brazil’s financial markets offer a compelling enigma for the astute investor. As of March 3, 2025, with the USD/BRL exchange rate at 1 USD = 5.87 BRL, the Brazilian real has shown resilience, appreciating from 6.2 to 5.8 this year. This strength, intriguingly tied to a bond market boasting 10-year yields near 15%, prompts a deeper question: could Brazil emerge as an unexpected sanctuary amid global turmoil? This exploration unveils a landscape where high yields and domestic focus challenge conventional investment wisdom.
Brazil’s bond market operates as an idiosyncratic force with yields dwarfing those of peers like Chile (5.94%) and Mexico (9.49%). Driven by local dynamics—fiscal policy, inflation, and a central bank unbound by global rate cycles—it has seen yields ease from 16% to 14.6% year-to-date, signaling stabilization. This shift correlates with the real’s rise, suggesting a potent inverse relationship: as yields moderate, confidence grows, bolstering the currency. For the inquisitive mind, this interplay invites a reevaluation of risk and reward in a world where traditional havens falter.
Yet, the global stage adds layers of complexity. U.S.-China trade tensions, while not directly targeting Brazil, ripple through its economy—offering trade diversion benefits like increased soybean exports to China, yet threatening slowdowns that could dim growth. With China as its top trade partner and the U.S. second, Brazil straddles opportunity and vulnerability. Investors must ponder: can its bond market’s allure withstand these crosswinds, or will global forces unravel its promise? The answer lies in decoding this delicate balance, a challenge that inspires curiosity and strategic daring.

Bond Looks ready for PumpHi Guys
Bond Looks good here for move up.
Best buy area is around 3.30 - 3.40 but also we can buy a part here.
Dyor plz.
If u bought it please use stoploss.
Good luck.

Trump's Impact on Interest Rates: Higher Rates Ahead?After Trump’s decisive win on November 6th, Bitcoin, the USD, and yields (or interest rates) moved higher. In fact, these markets began moving upward in September, more than a month before Donald Trump became the 47th President of the United States.
We will study the direction of interest rates based on the actual market sentiment as reflected in U.S. bond yields.
10 Year Yield Futures
Ticker: 10Y
Minimum fluctuation:
0.001 Index points (1/10th basis point per annum) = $1.00
Disclaimer:
• What presented here is not a recommendation, please consult your licensed broker.
• Our mission is to create lateral thinking skills for every investor and trader, knowing when to take a calculated risk with market uncertainty and a bolder risk when opportunity arises.
CME Real-time Market Data help identify trading set-ups in real-time and express my market views. If you have futures in your trading portfolio, you can check out on CME Group data plans available that suit your trading needs www.tradingview.com

The Best Explanation of The Bond Market You're Ever Gonna Get12 Month US10Y Bollinger Bands between 2.5 and 2.9 Standard Deviations away from a moving average model greater than 4 years in length, preferably exponential. I haven't optimized this to perfection, but it's close enough to give you the basic idea.
The bond market is just a simple oscillator emerging from a complex system and simply does what every other very large and complex system does. It has a trend around which it travels but in decades and centuries not years. It isn't complicated, but it is extremely slow.
There are 2 phases and a 5,000 year long trend. It goes up. It goes down. Over the course of centuries it declines. In the down phase, it stays below trend and does the exact opposite in the opposite phase. A kindergartener can trade this thing.
Currently the phase is turning over from a down phase that lasted from 1980 to 2020, and entering into a new up phase that will most likely last for 3-4 decades.
Trading it: buy secondary market long duration government bonds at the bond yield 3 standard deviation line and sell at the trend. Repeat for the next 30-40 years. Easy peasy.

HYG/IEI, a proxy to inverse Credit SpreadHYG/IEI, high yield bond vs 3-7 year treasury.
Still near new high, no significant credit risk yet. Until we start to see this indictor turning down and break support line, Small caps should be holding up.

VGLT - Correction to 72 USDFirst Target 72 USD; then, the last leg down will start, maybe it will not go past the lows but that will be the real capitulation and where I'll be ready to buy.

Buy Opportunity on T-Bond Futures Hello,
We've identified a huge current opportunity to buy T-Bond Futures with a high probability in the Daily chart.
The Target is $129'31 within a few days (Swing trade).
Ibrouri

BOND symmetrical triangle patternBased on the Symmetrical triangle pattern I see bond falling down further for around 50%. I depend the 50% because of its last big drop where the symmetrical triangle pattern started. If BOND can NOT break out then I will go in position. If BOND will breakout we will see if it faked out or go up higher.
What are your thoughts?
I suggest to always Do Your On Research (DYOR) and that this is no Financial Advice (FA).

BONDUSDT Break Out or Break Down? Crucial Levels to Watch Now!Yello, Paradisers! Are you prepared for #BONDUSDT's potential breakout? This analysis will keep you on the edge of your seat!
💎#BOND has shown a price rebound from the demand zone and is attempting to break out of the descending resistance. A successful breakout of this resistance could be a positive sign for the next movement of BOND.
💎However, for a shift to a bullish trend, the price needs to break through the supply zone around the 2.8 area. If this happens, there's a high probability that the price will move significantly upward, possibly reaching our target resistance and the strong resistance area.
💎On the flip side, if BOND fails to break out of the descending resistance and gets rejected, the price will likely move downward and revisit the demand area.
💎The demand area at 1.88 is a crucial level for BOND. It needs to rebound and attempt to break out of the descending resistance again. But if BOND fails to rebound and breaks through the demand area, the bullish scenario will be invalidated, and the price could dip further.
If you want to be consistently profitable, you need to be extremely patient and always wait for the best, highest probability trading opportunities. Stay focused, patient, and disciplined, Paradisers.
MyCryptoParadise
iFeel the success🌴

BOND looks BearishIt looks like we have a large diametric that we are now in the G wave of.
The G wave looks like a triangle.
Keeping the red range, we expect wave c to be hit from G.
The targets are clear on the chart.
Closing a daily candle above the invalidation level will violate the analysis
For risk management, please don't forget stop loss and capital management
When we reach the first target, save some profit and then change the stop to entry
Comment if you have any questions
Thank You

Rates are breaking recent up trends, $TNXGood Morning Everyone!
The 2Yr Yield is retesting the recent support level, highlighted by arrows.
The 10Yr #yield is currently breaking the recent uptrend.
The yellow box was highlighted in the last post showing the WEAKNESS. However, forgot to speak on that yesterday (see profile for more info).
They cannot lower #interestrates... But they must, at least short term.
QT is done.

BOND UPDATE (1D)This analysis is an update of the analysis you see in the "Related Ideas" section.
Now we are in the green range of the previous analysis, but due to a small pump and rejection from the QM L range, we see a bearish QM on the chart.
BOND can drop towards the targets while maintaining the red range.
The targets are clear on the chart.
Closing a daily candle above the invalidation level will violate the analysis
For risk management, please don't forget stop loss and capital management
When we reach the first target, save some profit and then change the stop to entry
Comment if you have any questions
Thank You

Bond/UsdtWe expect an bullish movement to the point specified in the chart as a target. We are waiting...

BONDUSDT.4HOn this BOND/USDT 4-hour chart, I’m examining the inclusion of the RSI (Relative Strength Index) and MACD (Moving Average Convergence Divergence) indicators alongside identified support and resistance levels.
The RSI, currently at 51.38, is hovering around the mid-point, which suggests neither an overbought nor oversold condition. In the context of the RSI, a reading above 70 typically indicates that an asset is becoming overbought, while a reading below 30 indicates an oversold condition. Therefore, the current RSI level provides no clear directional bias.
The MACD, which is near the zero line and appears with minimal histogram bars, also shows a lack of strong momentum in either direction. The convergence, or lack thereof, of the MACD line and the signal line can offer insights into potential price movement, but as it stands, it's not indicating a strong bullish or bearish momentum.
Looking at the price chart, we see that price has recently been making higher lows, which is tentatively bullish as it suggests an uptrend. However, price action is currently compressed below the resistance level (R1) at $4.734. A breakout above this level could indicate bullish momentum leading towards the next resistance level (R2) at $5.417.
Support levels are marked as S1 at $4.013 and S2 at a lower point. These would be areas to watch for potential buying opportunities if the price were to retrace. Particularly, the $4.000 level is psychologically significant and aligns closely with S1, which could reinforce it as a strong support zone.
To form a complete trading strategy around this chart, I would seek confirmation from price action, such as a bullish breakout above R1 with increased volume. A stop-loss strategy would be prudent, potentially just below S1 to mitigate risk in the case of a false breakout or sudden reversal. As always, it’s wise to consider the broader market context, including any news or events that could impact the price of BOND.

Interest Rates NOT showing cuts...Let's keep looking at #InterestRates. Gives us an idea of what the Fed may do.
The 1 & 2 Year are still under their RESISTANCE level. Struggling a bit, but not breaking down. Trend is still there, weak though.
10 Yr looks like it wants to break the resistance zone.
30 YR looks like it's gone. Does not look like it wants to retrace at the moment.
#FederalReserve TVC:TNX

bondSupport and press the rocket to cheer me up
Observe the ten percent loss limit
Stay away from Bitcoins
Feel free to buy and sell and post your comments

BOND/USDT Break alert! Indicating continue the upward movement!💎 BOND has recently experienced significant market dynamics. After successfully breaking out of the resistance area, BOND is currently undergoing a retesting phase.
💎 If BOND manages to bounce from this retest and find support, there's potential for the price to continue its upward movement towards our target area.
💎 However, if BOND fails to find support and breaks below the retesting level, the next downward target lies at the demand area of around $4.3.
💎 BOND must bounce from the demand area and reclaim the price above the support level at $5.1 to maintain its upward momentum. Failure to do so could result in continued downward movement for BOND.

New exit pumpWith most delistings, we have already observed the exit of the pump up to a significant overshoot of the level at which the news about delisting was released. Today I filled positions on the exit pump for drep and pnt. A pump is possible on the reversal of the current weekly candle, which will turn into a pullback on the monthly candle. In a less optimistic scenario, the rollback attempt will already be in a new monthly candle. The likely targets are retests of 0.250-275 for drep and 0.15-75 for pnt, which can bring up to 200%+. The drep team announced the burning of a significant part of the tokens, which is an additional reason for the pump.
