XAUUSD DISTRIBUTION I see a Wychoff Distribution Schematic no. 1 forming. I have setup 2 trades one is targeting the SOW area within the schematic and the second is a higher R:R trade of 1 : 6.3 targeting the previous 30M / Hourly support level.
We'll see how it plays out
T-distribution


Analysis on Bajaj AutoBreak out of the level 4200 with retest will lead min 4400
SL 4050
probably high chance of downside, it looks like a distribution phase However wait for the confirmation
breakdown of the level 4100 with retest will lead min 4000
Target 3700


EURUSD - Institutional SellOANDA:EURUSD
Trade Idea - 💡
Bearish Order Flow on the 1h, looking for a short to the candle that started bullish momentum
Will be looking for a small timre frame dsitribution to confirm entry
Let me know your thoughts?

EURUSD - Institutional SellOANDA:EURUSD
Trade Idea - 💡
Looking for a test of the LSPY of the distribution schematic that has formed with a 4h Supply Zone, and BTS IC
Looking to take this down to the daily STB Candle before looking for buys back up.
Let me know your thoughts?

Bitcoin - distribution & redistribution - move to 41000$-40000$?Bitcoin - distribution & redistribution - move to 41000$-40000$?

Pair correlation between DXY and GU, Possible DISTRIBUTION on GUI'm personally hoping to see, with DXY giving a potential for a short term sell-to-buy, that GU can go as far enough to take out those LR wicks, creating a UTA -as price wicked the whole body of the previous UT, one could say it broke PRICE structure, but since it didn't wick ABOVE the wicks which formed the UT, I'm waiting to see if price will cover that UT; as it IS called Wyckoff; and create a UTAD-. Looking for a short term buy, then a mid-term short IF the UTAD shows.
DXY reference SHOWN BELOW (1HR):
With DXY breaking 1HR structure, I'm personally standing by to see if Inst. order flow can begin taking price bullish, but with the higher TF outlook on DXY (4hr/D/M), I'd like to think otherwise.. lol. In need of some opinions!
P.S Ignore my half level, Ik it's off

GU pushing for a UTAD?An update to my previous post.
Hopeful about a possible UTAD forming, or even an LPSY if price decides to grow weak -especially with all the volume that's been coming in and the short consolidation phases in between those large moves-. I'm thinking either another, final, push to the upside which'll tackle those equal highs and LQ spots.
Another thought: if price decides to give out, that -for me- will begin to confirm the start of an LPSY. Thought #1 seems the better option for me, as price on 30 and 15 have been forming LQ; just personally waiting for that take-out move to happen any time now or even London. 1HR and 4HR seem to show that price is beginning to exhaust, possibly to break to the upside for a buy-to-sell, or just start our down-side IPA fills.
I'm personally looking for a short-term sell-to-buy.
DXY REFERENCE:

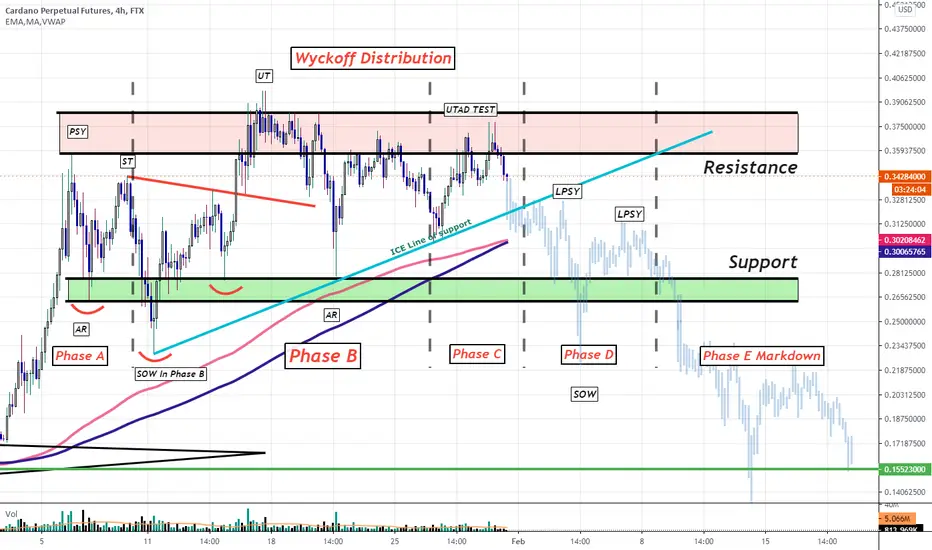
Potential Wyckoff Distribution Outlook.ADA Looks to be trapped within a Whyckoff Distribution Range, Upon breaking the ICE Line of support we could begin to see a major Markdown in price.
EURUSD [Distribution 3 possible sell plans]Distribution entering Phase 4
Three possible entry scenarios:
1. Break major support and wait for retest
2. H8 imbalance fulfilment under second LPSY as if may or might no able to hold
3. H8 imbalance fulfilment and around first LPSY
***Beware SOW on left could be also a re-accumulations***

DXY - AnalysisTVC:DXY
Analysis - 👨🏾🎓
The DXY is Bearish on the monthly from a structural and institutional perspective I can see the bullish momentum continuing until 92.184 to mitigate the orders made in the last period before a continuation in bearishness to create a monthly lower low.
The 82.000 demand zone, which has significance as far back as DEC 1990 could be a key level to show major dollar strength, failure in this level to hold could have catastrophic consequences for the USD
The rise of blockchain and cryptocurrency applications have accelerated during this period of decline, this is set to continue as people seek better stores of value than the USD. The decline itself and Quantitative easing never seen on a scale like this before have raised large questions on the suitability of the USD as the worlds global reserve currency for the longterm.
Let me know your thoughts, I've attached more snapshots below!

ETH Ascending Wedge: Target 1000I'm outta here. 5 waves are complete.
Target weekly demand from previous bull run at 1000


EUR/CAD: Bearish trend!!! Plan to trade!!!Euro/Canadian Dollar it's continue downtrend and we see that we can to get a big opportunity to trade this par. As we break down this simetric triangle of distribution, EUR/CAD it's going to down and we hope that going to end the formation of this ascendent triangle that we formed in monthly timeframe.
Another possibility it's into this ascendent triangle, we can to see a bullish channel, that it's so interesting to trade in short position in this par.
I will selected this par to trade in Prime XTB for the next week becuase the trend in weekly chart it's so claearly to sell.

GBPUSD [Distribution Phase C]*** Update markup mistakes ***
Potential Distribution forming:
- Looking for some rejection and IM around the possible supply area.

BTCUSD: Possible move into a long distribution phase from hereHi everyone! First of all have a happy new year - stay healthy and well :-)
When analyzing BTCUSD I have noticed a resemblance between what is happening right now (months of Dec2020 and Jan2021) and December2017/January2018. BTC made similar gains, as it did in that year of 2017/2018, recovering from a previous low back to the ATH (approx. 60%), before rallying to 20000USD (140%), followed by a long phase of distribution and panick selling. This time BTCUSD recovered back to the ATH of 20000 (approx. 60%) and then reached new highs of 42000 (approx. 107%).
Back in 2017/2018 the bull run held for about four weeks - we are also now in week four. What COULD follow is a strong phase of distribution (profit taking), followed by people panicking.
Yes, now "it's different" I hear many people saying and truth is, it could be. But also keep in mind that back then, when BTC reached 20000 USD, many claimed it will go even higher and higher. People took their savings and even some took loans and put it into BTC as they saw it plummeting and then sold out of desperation.
What I am saying: Please be very careful with trading BTC. Those who claim that it will go to 200.000 by the end of the year, are those who are holding BTC and want to catalyze.
A major difference that we can observe with this phase is that we have some big companies involved (Grayscale, Microstrategy etc.) holding millions of USD in BTC.
Many see this as positive sign for the BTC prive development, but there is also a major risk: With Grayscale holding 3% of the circulating BTC we have a whale that can dump a huge amount at any time for profit taking and then rebuy at a cheaper level when individuals panick sell.
In conclusion: Watch the price carefully, it's better to use dollar-cost-averaging, since the bull run MIGHT be over (possibility, but not 100& outcome). Use stop-loss and do your own research.
I am no financial advisor and this is no financial advice!
Many thanks to c0tt0nc4ndyTA and Wyckoffmode - so far I have learned a lot from the both of you and still learning!

EURGBP - Institutional SellOANDA:EURGBP
Trade Idea - 💡
Distribution on the 1h TF looking for market to retrace to the LSPY, mitigation of the 1hr BTS IC retaining the 1hr lg before selling off to break the 4h and continue bearish price action
Let me know your thoughts?


AUDUSD [Potential Sell]H4 UTAD has been form
In lower timeframe M15 in this case showing weaknesses. Found M15 institutional candle "buy before sell".
Entry at the IC stop above it.

AUDUSD [Potential Sell]Second wave after first UT, given the second SOW price might not able to form another UTAD.
Entry at previous swing high on M5 and confirmed by H1 in-balance candle.
