$HEXO Target 4.31 for 67.7%$HEXO Target 4.31 for 67.7%
Sometimes things just work out perfectly in my favor… and sometimes they do... 😜
At this time there is no support … however technical’s point to 4+
Let's go...
TA

TrendyTrades: BA Going Up! (Bullish Analysis)BA closed nicely on a key fib level with a bullish harami leading me to believe BA will push up towards 220 for a retest of trend.

$WISH Analysis & Key levels$WISH Analysis & Key levels
I do prefer stocks with more established technicals (there’s really not any support here)… but this one is on my radar today too…
Could have an attractive upside - especially in the short term
———
I have WAY too many positions to be able to update on … So I’m just going to start posting the most recent support and key levels…
Red = Key levels
Green = resistance
Blue = trendlines
Have fun, y’all!!

$DAL Analysis & Key levels$DAL Analysis & Key levels
Still in an overall down-trend but looking good for some day or short swing trading.
Sitting slightly above a longer support
———
I have WAY too many positions to be able to update on … So I’m just going to start posting the most recent support and key levels…
Red = Key levels
Green = resistance
Blue = trendlines
Have fun, y’all!!

CSCO breaking bear out of Rising wedge. BULLS WATCH OUT!Watch out! Especially because FED wants to "taper" their money printing as per their latest FOMC meeting minutes

BITCOINWe should take into the consideration the current wave formation. There are are literally countless ways to interpret it, but I will try to think of reasonable scenarios.
1 - Current wave is a B in ABC formation.
If that is correct then it would cause another big wave down to sub 20k. I don't think it is probable.
2 - Current wave is Wave 1 in a new cycle
If it is correct then:
Wave 1 might be completed with small 5th and bigger correction might be possible to the major support at 40-42k or even in an area of a TR or lower support. (wave one can retrace up to 100% of the original move. Even if this scenario is possible, I don't think it is probable after such a strong impulse. Furthermore it is 50% retracement from large move down - quite heavy resistance so it is also possible that the correction will take place as a trading range for a while. (it means altcoins will perform better)
If wave 1 is not complete and sub-wave 5 is still in formation, which might lead to 50-52k before larger correction. It would coincide with a measured move from impulse sub-wave 1 and also 0.618 fib levels.
This is all part of hypothesis 2.
There are also other 3 possible hypotheses for bitcoin price action.
1 - Price will continue to go up within the bull channel for extended period of time. I think it is less probable.
3 - It will ignore closest major support and retrace all the way down to 30k or somewhere in between 30-40k (trading range square) before bouncing up.
4 - Price will decide that latest impulse was in fact a B in ABC correction and will continue to go down towards 20k levels.
Another way to look at it if it is actually a wave 3 in 5 wave cycle (if cycle started at the lowest point of the structure (marked red). However I would prefer the start from the wedge bottom, as the last wave of the correction might be truncated (couldn't breach the bottom). Anyway, if the strong impulse is wave 3 and it is completed or even if not (5th wave is in formation), then possible positive scenarios (blue arrows) are the same as if it is wave 1.
Red arrows here are not possible as it would negate the 5wave structure at this point (correctional wave 4 is cant reach impulse wave 1).
The major thing that differs from original hypothesis 2, that this wave 3 can possibly extend and have an enormously strong impulse up (for example back to all time highs.
I think hypothesis 2 has most probability, because going down by retracing 100% after such a strong impulse move is unlikely. Bears simply are not strong enough after such strong upside. Furthermore I think that there is a bigger chance, that ABC has already formed and bottom at 30k is set.
In a short term we might see some trading range or down action, but medium term I would be LONG, nevertheless also evaluating other scenarios if price action would go in the 'not probable' zone.

BTC TATechnical Analysis of BTC using 200DMA and 128DMA. BTC has tested and retested 200DMA as well as the 2.618 Golden Ratio Ext and is currently being rejected. There is tough resistances on HTF going into the 48-51k region. Bollinger Band width has been compared with RSI, when RSI and BBW touch and deviate with RSI trending up BBW trending down, we see and increase in price. The converse is true for decending price action. Two simple paths have been laid out (time frame is not considered, this is rough).

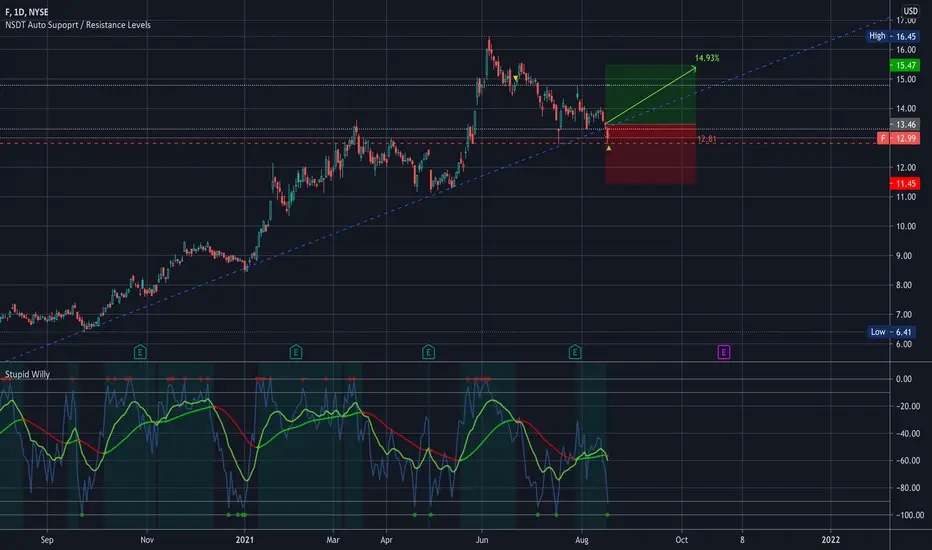
$F Target 15.47 for 14.93%$F Target 15.47 for 14.93%
This kind of messed with me today… a long trendline broken… but also caught by support… WOW… this TA stuff NEVER gets old… let's see what happens... place your bets...
-----
—
On the far right of the chart is my Average (Grey) Current Target (Green), and Next Level to add (Red) Percentage to target is from my average.
ONLY ADD at support levels & FIB levels… labeled
I start every position with .5 - 1% of my account and build from there as needed and as possible.
I am not your financial advisor. Watch my setups first before you jump in… My trade set ups work very well and they are for my personal reference and if you decide to trade them you do so at your own risk. I will gladly answer questions to the best of my knowledge but ultimately the risk is on you. I will update targets as needed.
GL and happy trading.
SOL SOLANA channels for the next few days!I called the shiiii out of the Solana ATH with a long position, here's my channels for the next few days or so.

GBPUSD buyFridays high and Monday Asia high raided collecting the liquidity. Looking for price to sell into the large candle imbalance and demand zone to collect more orders to get a larger move up.

BTC still bullishBitcoin is still bullish.
If we close below 45.5k however, expect a dump.
Buying targets are green
TP red

Bitcoin next stepsWarning: Use this information at your own risk.
Bitcoin actual situation:
- it stops at 46000
- now retracing in direction to 42000 support
- inside a rising wedge( OMG danger everywere X´D)
TA:
- it may retrace lower to 42000 and stay there for a while
- maybe we see a nice tradeable triangle
- then there are 2 options like always:
+ it can continue de new uptrend following the base of the rising wedge
+ or it can break lower and retrace furter to 38000 support and start a new downtrend
to 30000 support continuing the lateral bullshit
Let me now in the comments if this post help you and be welcome to make any suggestion.

FARM - CHAD COINSomething I would like to bring to your attention is the " Harvest Finance Project " Although might seem like a meme coin, with a large TVL, large team. It was able to survive all major dumps and as well hack attacks.
This coin did break down in the last dump and broke the Triangle down. However, now that the market is recovering, we can see good gain and seems like each time this coin drops below 70$ it eventually pumps hard to 200 plus. Well, I'm not saying it will drop again it is possible.
We now see another Moving Average "200" forming and it is holding/having a bounce off it.
What I can tell you right now is that FARM will be $400 and has all the reasons to hit the 1,000 dollar level.
I will post updates and reasoning for each TA I do.
Smogster...

DSK, DUSK chart interpretationDSK share price has had an immediate rebound from the bottom support zone marked with the ascending wedge, and is likely to start a bull run towards resistance. If the market continues strong before the 27th of August when they release the 2021 financial year results, it is possible for the share price to reach $4, or even a new all time high.

Ethereum EIP-1559 "London Fork" UpdateEthreum has now entered into the accending channel now at the 3,100 price level. It is now rejecting the perfect middle/center of the channel, meaning the TA is working.
RSI is overpriced therefore a pullback is normal.
BTC has broken the 42,000 lvl and we saw a good run in the Alt space.
Ethereum continues to burn 150-180 ETH per hour, bringing positive news, for the mid to long term.
Now that we are in the ascending channel you can use it as your support and resistance. Pay attention to Bitcoin as it is still meaning runs and dumps in the crypto space.
Smogster...

My interpretation of Cardno and it's short term future, CDDCardno has had a meaningful bull run since February when they realised financial earnings, and has since been trading in a channel pattern. The stock has had a lengthy pullback of about a month, however it has rebounded from the bottom support zone and looks likely to make a bull run towards resistance, the MACD crossover, steady RSI rise, and the increase in volume help confirm this. My original target price was $1.015 which it reached and pulled back fractionally as expected. My second target price is $1.06 which it will likely see resistance and pull back fractionally again. If the market continues strong for the next few weeks, it could see a price of up to $1.180, however it is likely the market will have a reasonable pullback by then, in which Cardno would likely replicate.

ETH Baby Bull push to 28, then back to 24My analysis on the current trend of ETH, post mini bull run to 2600.
Best fit curve analysis, taking into account the larger daily trend curve in red, with the smaller month long trends in green.
Using the apex of curve 2, I can guess at the endpoints of the current trend, while fitting the highs/lows.
Averaging the length of the three previous curves don't allow a timeframe that fits the development of this curve, better fits a 250ish bar timeframe, or 30-45days.
Educational use only, Not a financial advisor


Cardano Short SetupADA/USDT Possible setup for a short.
Exponential decay of previous trend was unsustainable, breakout was imminent.
Price then followed a linear rise, had a smallbear breakout and eventual retest/continuation.
Leading to where we are now.
Previous line bouncing between support/resistance looks to be the current trend top,
While the bottom continues on from a the first "stutter" after breakout of that exponential trendline.
DYODD, Set stops, not financial advice.

Final decision time for BITCOIN!It's long/short decision time as descending triangle formation nearly fulfilled. In general, a descending triangle is a bearish continuation pattern but could as well play out as a reversal pattern (we've seen both for BTC in the last months).
technical long target ~48k - first major resistance @38k
technical short target ~14k - first major support @24k
Also, pay attention to the bullish divergence in the RSI.
The green path shows the potential upwards movement after breaking the triangle. The red one shows a possible way to reach the bearish target of 14k.
Tbh, I don’t think we will fall below the 2017 ATH (20k). Actually, the fundamentals are looking not too bad and every dip to or below the 24k area should get bought up very aggressively.
Have a great week.

TOMOUSDT Short OpportunityTOMO/USDT has been one of the biggest gainers in the past few weeks during the crypto bear market
I believe the price is highly inflated, and is showing signs of breaking down
These indications are mostly influenced by the large dips BTC/USDT has made so i do expect to see TOMO/USDT test resistance again at roughly 2.77-2.80
If it breaks past this level, it will be going to the next stop, at 3.00, although 2.77-2.80 is very strong
And the fact that BTC/USDT has built a fairly strong resistance at 32000.00 with support being at 31000.00, i am expecting BTC/USDT to break past its support level and head to 28-29k which would influence TOMO/USDT's bearish reversal further
I am far from an expert, and am simply doing this to be able to look back and see what i got right/wrong, so please understand that if you do decide to trade this
And any feedback would be appreciated
Thanks

NIO buy areaThis is NIO coming (back) into the buy area for me. I've set orders within the box.
- Price action
- TA
- I'm bullish on EV stocks :)

LQQK~~!! Most simplest TA prediction when BTC will MOON again...First a bit more down to 31.5 - 32.5k zone. Then up to 36k - 37k zone. Then DUMPENING to around 19.5K - 20.5K Zone. Long Consolidation. Then HEAVY MOOOOON UP UP UP UP !
I am the BTC Seer and I see what BTC will do.
