SEC Sues Binance taking Bitcoin right to its mark!Traders,
Legalized mafia (the SEC) have attacked crypto once again. But crypto remains strong, resistant, and resilient. This time will be no different. In fact, from a technical standpoint, as long as we can remain above BTC 25,200, I will be as bullish as ever. Let's take a look how the SEC's lawsuit against Binance might impact crypto.
Stew
TA

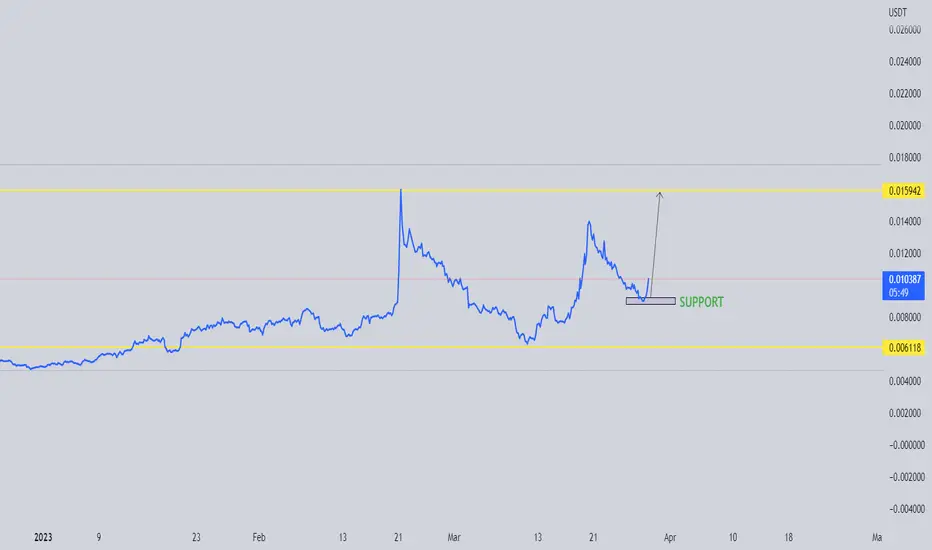
CAT idea long wedgeWedge formed, looking for some retest of previous levels.
Especially if overall market strength continues to go as it has currently been going.
If it breaks down, I don't see CAT going much lower.

I hope Bitcoin dies. │ Why Bitcoin has a long way to go. Bitcoin is far from being an asset or anything of that kind, the prices moves from the bigger market movers who like to manipulate prices to a point that there are little to no explanations to the price movements.
Although 99% of people think they have figured out Bitcoin and its movements, they haven't. This currency is now used for manipulating newer adopters of the currency into believing it is "The future of currency" or something stupid like that.
Many people come from YouTube or some other platform where they are told lies about the future of the currency to a point they decide to "Invest" and they come into the currency with an approach that it is going to hit $10 million or something stupid along those lines.
They spend a lot of their time watching the price fluctuate up.. down... up.. down. To a point that they only really pay attention to the main winners. +10%. -15%. +20% etc etc.
These people get so addicted to this currency and think only because they see all of these profits a lot of the time then they think that this will continue to the future.
They might put another $1000 into it.
After maybe a year of watching their money move up and down they might get into other alt coins and please don't get me started on this ... lol
Alt-coins are not the future unless it is made by a governing body.
They might even get into some deep TA, I have even seen people predict the future of bitcoin on the formation of stars over time. THE FORMATION OF STARS!?! HOW STUPID ARE YOU?
Sadly, although the whole cryptocurrency scene is mainly fuelled by people who are manipulated to think it is going to $10 million next year. It still will have a future. The adoption of bitcoin has increased over the past years but I don't expect it to grow a massive amount more in the commercial world.
People have adopted it for payment methods but this isn't something that will change the world or really move the price.
There are some people who use it for illegal activities and to stay anonymous and I think this is where a lot of volume comes which makes it even harder to predict future prices.
No doubt the currency will be at less than $2500 in 2022.
Please do not believe the lies that they tell you.
Thank you, I hope you enjoyed me ranting on about this topic aha.

Short & SimpleOpportunities to wait for if you're stacking sats. Would daily close above previous close, what you think?

BTC diamondHey everyone, happy sunday
quick idea to show you
BTC diamond on the 15 min TF
Red vector ranges above if it breaks out of the diamond, however we do have some green vectors residing below.
Moving averages are getting tightly squeezed, probability of a move soon.
if it breaks 200MA and holds we could see a move up towards 28 K
also its in this weird kind of symetrical triangle pattern, heading for potential break out or green vector recovery.
But note that it has hit the green vector but left a bit so lets see.

Taking a shot on SLooks like a decent setup for a long here. Spring backtest of that resistance level. Fairly tight stop on this one.


DXYHey everyone waaaSUP,
so here is another idea on the DXY.
1 hr timeframe suggests to me that the dxy could hit the 200 SMA at around 101.4 range, it may grab the liquidity in them red vectors at around 101.6 maybe even 102.00
This would hit the trendlines coming down to then grab the liquidity below and major dump to either a double bottom or dump.
There is probability of breaking out but we will see.
Stoch Rsi is curling down for a retrace, i reckon wont reach no where near the bottom bounce up then drop.
MACD looks like it wants to roll over.
Peace and love everyone

HIMAYC 1 dayYo Yo Yo, i thought i would share this idea with you all. HIMAYC daily timeframe
This has been pumping since November last year, over 6000% took a couple of big drops during that time but even so, its pumped.
Even from March this year its pumped up 2000%. Thats insane
So here we are 1 hour time frame, Ive just made it simple. Moving averages look nice smooth and still curling up. Ive drawn some rectangles illastrating big moves on price and copied thes measured moves that matches the previous so ive basically done the same.
But to add some confluence ive drawn some simple uptrend patterns and they both pin point to the measured moves previously done. And its at a key price target of $2.50
Also moneyflow coming up into the green ;)
I know it bonkers, its a huge move but probability suggests its possible.
I thought i would put it out there so here we are :)
Peace and love everyone

BTC 2 day fractalHey everyone.... so ive done a 2day BTC fractal analysis
As you can see if added some important key areas in the orange bubbles. The first one being the covid but also what many might not be aware of was on the 20th March 2020 Suadi (US allies) dropped an oil price war on Russia. This tanked the oil price to less than zero. And you can see it here on the chart. Then the second is where the crash would of happened at present day based on the fractal from this period.
Now look at the fractal, ive outlined the main fractal on the left from june 2019 to april 2021. I have then split his fractal into two, thus removing the previous spoofy crash.
I say spoofy becasue it was a coincidence with covid, i wonder who stocked up on the oil at that price, for it to rocket a few months later hmmm.
Anyway thats for another day, But the fractal from june 2019 to feb 2020 is pretty much bang on to price action june 2022 to march 2023.
So is it fair to say we have skipped past the previous crash and heading into the bull run phase 1
Look how close we are to a golden cross (50MA crossing up and abovew the 200MA.
SO what about levels, longer term levels of resistance to breakl are : 41,600 / 52K / 69K
Then when we hit ATH next level up potentially 100K then up to 150K basing it on this fractal pattern and the golden cross.
Im not saying this is gonna happen overnight but its happened before so probability says it can happen again,
Or could Balanji be right and we hit $1M
Peace and love everyone, share and like dudes :)

4/14 Watchlist + NotesMy watchlist got taken down by TradingView moderators yesterday. As a recap, I was bearish on SPY, and main watch was PYPL for the 3-1 setup it had on the daily
SPY - Super bullish uptrend day. I was hoping for bearish continuation, but the markets had other plans. I can really only credit this movement to two things: Neutral CPI data, and markets possibly re-adjusting/stabilizing from yesterday's madness. Regardless of why we were so off with our prediction, we were just wrong plain and simple. Unfortunately my streak of correct predictions has ended because of today. This is a prime example of an engulfing day not following suit and moving in the unexpected direction, which happens about 15% of the time when we see engulfing candle days.
We closed relatively strong, so I have to believe we will see continuation tomorrow. Upside target set at the 416 area. I have a feeling we either pump hard tomorrow or just consolidate and create an inside day. Would rather see an inside day being made than another 2U
Watchlist:
3-1 Daily Setups: (Neutral on all except TSLA)
TSLA - Bullish
COST
DOCU
DIS
2-1 Daily Setups: (Also Neutral on All)
AMD
SHOP
PFE
SQ
BABA
LULU
CSCO
Main Watch:
TSLA & PYPL
PYPL never broke out of the 3-1 daily so now it is in a 3-1-1. Watching for upside
TSLA is in a 3-1 and has more room to the upside. Also watching for upside. Target is 191. To the downside target is 176.16
Yesterday's main watch:
PYPL: mentioned it did not break out of the 3-1 above. Not a loss, not a win either
Watchlist Stats:
3/4 on SPY predictions
2/4 Main Watch Plays
Personal Stats:
1/3 On the week
Overall red
Messed up today. Had two solid trade ideas, but just barely got stopped out on both before the move I was looking for happened. After two losses I called it a day and just watched for the rest of the day. Sometimes on days like today where I am right with my analysis, but lose trades, it is best to just stop trading and watch. Every trader has good and bad days. I can credit this red day to a few minor issues, but the main thing on days like this is to be able to recognize the mistake or mistakes, learn from them, and move on. Lets rebound tomorrow and close the week green. Good luck everyone

Long on $BBBY which has earnings today Couple channels in play here- I took this trade (with minimal risk), contingent on BBBY pulling out one of those big pumps it's been known to have. I could see this breaking the channel and going to the downside as well, although that seems less likely to me. Always use risk management :)

BTC 22hr NeilHey everyone, i thought i would share this idea with you all.
On the 22 hr time frame i see a neil diamond pattern forming and price is right tight in the corner.
Ive not really sussed out these diamonds, wether they are reversal or continuation or wether its a diamond at all.
But i also drew out a fractal and it kind of plays out with the drop out of the diamond, so could we be seeing BTC at 25,100 then a retrace and down to 23400 ?
Or is it gonna pump to 31100.....
Also not the channel it is in, and also where the 200 SMA is floating, Probability suggests to me that BTC will follow the fractal, but it could easily fake out to 31100 to break back down.
peace and love everyone

Solana ideaWaaaaSUP everyone, heres another idea out ther based on the 4 hour time frame.
So here we go, what do i base my anylsis ideas on and where do i think price is going to go towards based on probabilty.
1. Bouncing off good support
2. bounce/bouncing off bottom symetrical triangle pattern 50/50
3. macd histobars look like they want to curl up
4 stochastic rsi low
5 hidden bull div
6. money flow back in the green
7. vwap coming up
so ..... SOL could touch support (VAL) again at around $20.30 before making a move up to the top tendline of symetrical triangle pattern which is local VAH at 21.1, top violet line
sorry i should of marked these lines.
I see SOL breaking out and moving up to higher top trend line at around $21.5 to resistance 22.41
So there you have it my idea based on these probabilities :)
happy good friday everyone

ICX longwaaSUP everyone, i just put on a long trade on ICX based on the probability below on the 144 minn TIme Frame
1.hit the 0.706 fib retrace,
2 low on the stoich rsi,
3.low on the mac d wanting to curl up
4 histograms curling up into the green
5 money flow curling up into the green
6 hidden bull divvy
7 measured move to a resistance area at 0.59
However Moving averages are low down and needs to bounce which it looks like it is doing.
Anything can happen, probability is key

LINA : INCREASE VIEWLINA seems to show an interesting volume.
we will follow this coin to see if it's able to confirm from this support zone.
It will be only interesting if it shows a building increase in the coming time frame.
The increased view means only coins that could be interesting for confirmation.
Most coins are still not building long-term increased views.
History doesn’t repeat, but it does often rhyme!So far I’d say we’re leaning more towards repeating. Coming into the local resistance around the same time as the Shanghai upgrade. Will that be the catalyst to slow this rally down? Sending ETH back down to confirm the June 2022 lows as support, and play out exactly like the bear market of 2019? If so, it will be about the same time from the local top to the next Bitcoin halving 11 to 12months. Shockingly similar if you ask me and makes total sense. Perfect price action. To accumulate into the always bullish for all of crypto, the BTC halving. Good luck everyone and be careful!

OIL SHORT RE-ENTERAfter being stopped out by a marginal higher high I've now re-entered a short with SL just above 74. Looking to profit from this one as I am confident that OIL will pull back.

Possibilities of Spy to 360 1DObserving the daily chart, it appears that a head and shoulders formation has emerged, which may indicate significant changes on the horizon that have yet to be disclosed. This channel has persisted since October of last year, suggesting that a potential shift in market dynamics may be underway. Additionally, if this head and shoulders pattern holds true, it could trigger a significant bearish trend with potential retests of support levels around 360 and possibly even down to 320. Powell's recent tendency to keep his announcements brief and to the point also warrants attention, as it may reflect a cautious approach to managing the economy. As always, it's important to stay vigilant and stay informed as events unfold.

LQTY breakout ATHs?Possibility for a breakout to ATHs
Would look at reaction here and broader market movements.
Currently not traded.


SPX and equities might resist the stormStrong earnings are surprising everyone with positive cash flow, the disaster has probably not been felt yet.
Rather, fully...
A guy in finance told me his teacher said rates takes at least 8 month to be digested by the equity market.
Just an idea.

Change my mind! The time is now to reassess the situation.
The bulls have made themselves known again, for now. They are trying to establish a base above the 21wema and the time has come to plan. You probably know timing is everything. But always remember. Plan your trade. Trade your plan.
This chart lays out the bullish scenario for bitcoin over the next few years. Starting from a simple swing trade (the first & smallest column) to a longer term, moon shot trade. The columns are also derived from fibonacci sequences on both axes. And maybe a dash of meme power.
Of course, this is the scenario for the bulls and is relevant until 16,000 is lost. No one knows what the future will bring. That's why planning is so important. To know what you will do ahead of time in either scenario so you have a better chance of making a non emotional decision. But what if this is wrong?! Your an idiot! Well first, you shouldn't copy other peoples trades. Make your own decisions with due diligence (DD) that you are comfortable with. For me, its easy! Risk off as 12,000 becomes the next area of contention. And then reassess after some time. Opportunity is infinite, capital is finite.
But until then, this is the way.
Happy Trading!
