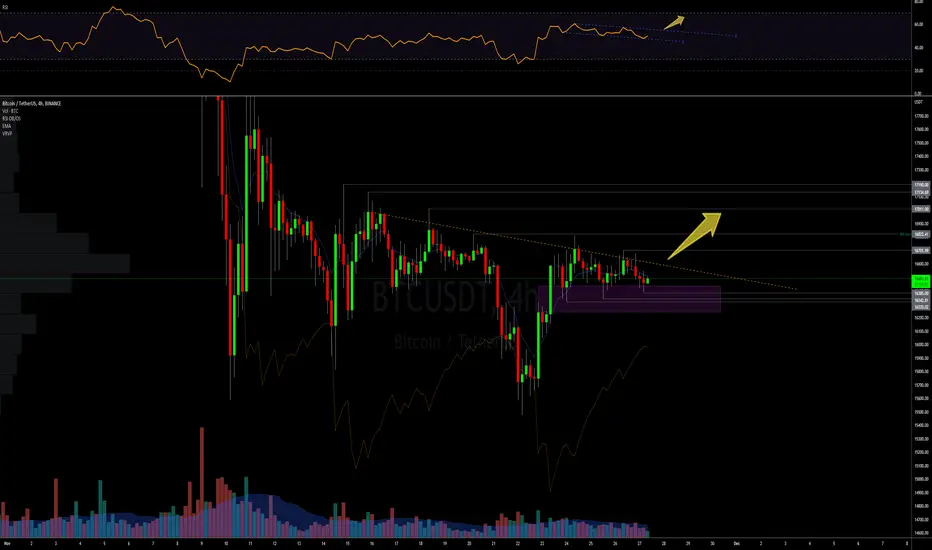
Bitcorn toight like a tigerBTC toight like a tiger on the 4hr here
Downtrendline watch- orange
Also watch for the 4HR RSI trendlines breaks
bulls need to hold either the higher lows on 4HR
or
Hold the box support
For best followthru both RSI downtrendline and Price EQ to break at the same time!!!
EZ-PZ right?
Get ya stop loss in
TA
BTCUSD Cost basis indicates current mid-pointBTCUSD cost basis indicates that potentially the downside target is just over USD 12k, with upside of the range currently around USD 24k.
This analysis's is based on 75% of BTC current supply (being around 80% of 21 million) can be traded and around 20% of that supply is more active than HODL or cold wallet volumes. Whether 60% or 75% numbers are used, the lower support line is still around the USD 12-14k mark.
Realised profits and loss calculations indicate that volume shifted in BTC has been due to storage and not profit/loss realisation and exit out of BTC.
The point being that a potential low is forming, but we are not quite there yet.

Bitcoin and cryptos - time to bail? too late? safe haven?This custom chart that I post periodically continues to have excellent TA.
Right now it's reflecting the volatility from recent crypto events, and less obviously but more importantly, that gold has bottomed.
The spike upwards is showing us where things are headed - bullish for precious metals compared to cryptos.
BTC *may* have found it's bottom (for now, though I see it headed lower still in 2023), regardless gold and especially silver will be bringing this ratio much much higher in the coming weeks, months, and years.
So if you really want to maximize your crypto gains (this is not financial advice), it might be prudent (and for some, counterintuitive) to pull out of crypto (no, it's not "too late") and dip in to something that CANNOT go to zero: precious metals.
But how you ask? There is a platform that does this reliably that I have done my own due diligence around (please do your own DD too), however trading view does not like me to tell you about it here. (Maybe check the comments ;)
Good luck out there everyone!

Is Ethereum forming this one pattern?Is it a triangle or head and shoulders? Or are we going to break bull or bear?
It's too early to tell,. It good to keep an eye on and make trade plans accordingly.
Which one is it going to be?
I reckon a triangle that breaks bull.
Find out on the next episode of dragon ball z

EOS Long in Daily, three targetHi, Here is the our analysis from EOSUSDT, so price hit the bottom at a major support level and bounced back,
so If we draw our next few resistance and at the same time we put FIB retracement we can see have the possibility of the price to hit 0.5.
at three different stage, First 1.15, next 1.30 & then 1.38- to1.40.

Eth tightening range on 4 hr going to breakWe got
Weekly 21 ema acting as resistance
Daily 21 ema acting as Support
FOMC announcement coming in on Wednesday 2pm New York time
Triangle on 4 hr ready to break with some follow thru
Let's be ready
Stay protective

LINK AnalysisHello Dear, as we can see in the chart, Link kind of broke the daily down trend line but it's not moving toward upper resistance yet.
instead formed another dynamic downtrend in which is clearly visible in 4h timeframe.
If it breaks that up and give us confirmation, we can go long. otherwise we are short now.

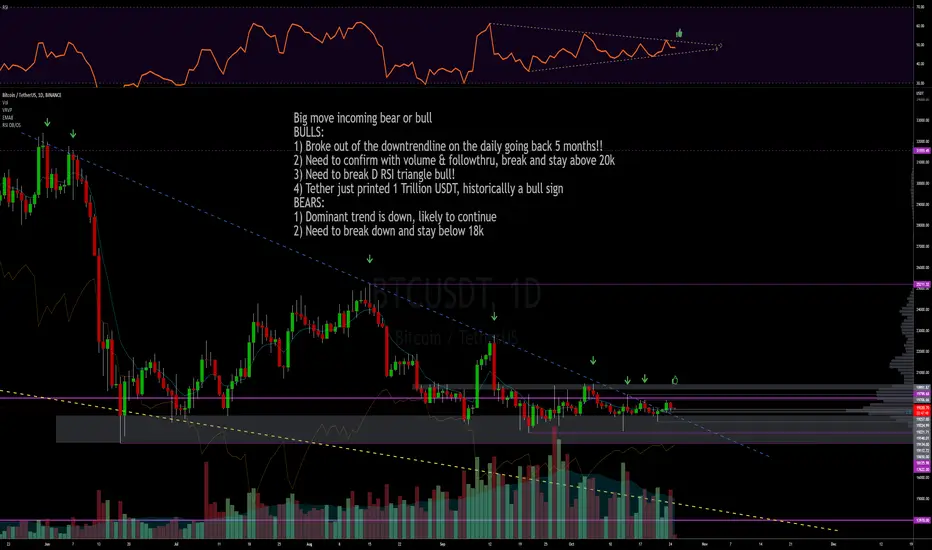
BITCOIN Big move incomingBig move incoming bear or bull
BULLS:
1) Broke out of the downtrendline on the daily going back 5 months!!
2) Need to confirm with volume & followthru, break and stay above 20k
3) Need to break D RSI triangle bull!
4) Tether just printed 1 Billion (not trillion typo in the chart) USDT, historicallly a bull sign
BEARS:
1) Dominant trend is down, likely to continue
2) Need to break down and stay below 18k

AMC downtrend H&S?Odd place for a H&S, but as far as the structure of the pattern its pretty textbook with a retest. The position of it is a little unusual to me.
Let me know what you think, and if you've ran into a H&S positioned this way.

BitcoinI know a lot has been going on in the world, but Bitcoin has been showing unusually high volume with usdt pairs as opposed to usd pairing. It can get interesting coming up to this line here with volume and divergence after being mostly sideways since June. Of course, anything is possible here. We could reject and continue down, break this trend and continue sideways, but I like the idea of meeting back up with that 200EMA and see what attention crypto can get while the world is in need of something financially positive.
Let me know what you think.

$LVS Bullish MegaphoneBullish megaphone pattern can clearly be seen in various timeframes.
Pt's on chart.

Bitcoin Bull Scenario to f up all the bearsEveryone is so sure that we are going lower, this would be the perfect storm to fake everyone out and head higher.
Here I drew one possible scenario that could play out. It doesnt mean it will happen, but it would nicely trap all the bears if it did.
Make sure you know when youre wrong and protect your capital!
GL

$JD Clear Descending WedgeThere is a clear descending wedge occurring on lower time frames. Target is top of the structure.

Revisiting my theory on GME FTDs creation through TTTHello everyone, Chem here..
Earlier this year along with the help of copious amounts of information on Reddit. I discovered that it is super blatant that TTT (ProShares Ultra Pro Short), seemingly spikes strongly into GameStop run ups. Overlaying the charts has allowed me to view and observe perfect symmetry between the two.
My theory and ideals on this entire topic stands. If you wish to read my extremely detailed ideas and rant topics then feel free to somewhat educate yourself.
Kenny G, ain’t no stoppin’ me.
Cant stop. Wont stop. GameStop.
Just sold my car for more shares, I bike to my chemical warehouse job where I work 80 hours a week at. I’ll inhale cancerous products 24/7 just to fuel GME fractional amounts if it means cell one day. You give me power Kenny G. Thanks you
Check out my other great topics about this same idea.
GME to the moon
Not financial advice.
Also I’m 100% on my calls so far, in terms of success, if that means anything to you analytical people.

ES could catch a bounceA few factors in this trade:
✅ Friday showed a nice bounce off the 3853 support level
✅ Bullish divergence on the MACD and RSI daily charts demonstrating seller exhaustion
✅ Wonky inverse head and shoulders and descending triangle could play out.
Two price targets on this one with a defined stop at 3842 (giving that 3853 level some room to breathe). Hoping we can get up to fill the Weekly gap on the futures charts, create another lower high, and continue with the macro downtrend.

BTC: STRONG TA: WHY THIS CAN BE THE BOTTOMBitcoin is one of the best coins we ever have seen in history, but also the best coins get breakdown trends and recovery as the markets go up and do wn.
It's hard to predict always the Bottom, but with some study, we have a high chance to be right.
BTC did breakdown today from the 22800 level and the reason for this breakdown is that stock markets that did show a breakdown trend
Bottom study
There is a high chance that between 20600-2800 is the BTC bottom, which means that BTC after this can increase to higher targets.
What after happened is to study at that market time.
BTC can have a new confirmation for uptrend at 21500, what after can bring THE BTC price with time to 24K
Further 22400 and 23300 are important targets for BTC in case of an increase.
These 2 points are volume points.

ETH possible buy zone coming upSupports there
-falling wedge, 4HR
- Daily GP 0618-065
- RS support zone from action before
dont forget to have stoploss!
GL everyone~!

WHERE I THINK BTC GONE MARKED BOTTOM! Around 14k by march 2023! I have also taken in mind that the feds gonna increase rashes. On the chart we got increasing volume and thats really bad. Falling wedge pattern, but i want to see a new touch on the support and resistance line to increase my bias for this pattern. In the my on chain analysis i think 14k is a huge support for btc and where both my technical and on chain -analysis match each other. (Made this one to look back in march 2023 and see if I called the bear marked bottom or not lol(:)

btc chartDetailed TA everyone should with focus and learn the movement of BTC and upcoming points where Possibly BTC can go My personal TA not a Financial Advice

$btc/usdt #Bitcoin 1Wbitcoin on the weekly, support and resistances drawn, fibs to consider. overall market sentiment is currently bearish, with optimism. September Fed rate review is something to consider. $btc seems content being under $22k for now

ETH hot our taget buy zoneAs per previous call We have hit our consolidation target. My order didnt feel by a few dollars, so i bought a smaller position when we broke out of 2 minute falling wedge. I will take profit at ~1650 just to be safe.
Now the reason for the bounce here:
- RS zone 1550-1600 hit
- W 8 EMA being retested for the first time
- 0382 D Fibs from june lows
- Oversold on all timeframes up to 6HR first time since june-july lows
Can we bounce to 1725 RS zone?
I am expecting at least a relief rally, which is happening right now. But for a longer/swing term picture we need to see what next week brings for the BTC and for the wider stock market.
So far the market is acting completely normal and was due a consolidation due to a massive run in the last 30 days or so.
We have a few support zones for SP500 a bit lower down at ~4100 and ~3900 zones and we need to get a feel how the market behaves there. We need to be thinking bullish right now and look where to buy. Only if we start smashing the support levels like they are nothing, with increasing bear volume, and head back to the lows quick then we need to worry and start thinking about new lows. until then we have bull goggles on and look for nice dips.
If we head lower in the next few hours I will be adding more to my position/scaling in for a bounce
keep in mind this is the weekend so there will be way less volume and could be more fakeouts as per usual weekend action
GL and control you emotions

ETH broke down 26D uptrend, will there be a followthru????!!!I went against my no shorting rule and took a small position last night when we rejected from 1960 with a large wick on 4HR.
This is what usually happens - the price fakeouts with a bull break only to quickly go down and trap anyone who was playing a bull breakout.
So I decided to take a small short position for shits n giggles.
Thats where i put my stop - a Hard stop so I have a known acceptable loss if i am wrong.
Reasons for going more downside here:
-Weekly 21 EMA resistance
-Broke down from 36Days long uptrend line!
-D RSI trendline broke down!
-Nasty 4HR wick rejection!
-Need for Weekly to consolidate after 131% run from the 880 low
-Weekly RSI trendline resistance
-RS zone in 2000 area where we broke down from last time in June and some paper hands will be selling breakeven
Consolidation targets:
-D fibs of 0382 lining up with D RS at around 1600-1550 levels
- there is another support zone at about 1700, but im thinking we have a small bounce there and head a bit lower. Either way will be monitoring daily and watching for any adjustments that need to be made
right now we are testing 4HR 8EMA resistance. Lets see if bears hold it - it has been acting resistance for last 2 days
So far there isnt a bear followthru. But lets see how it pans out over next few days.
Gl Everyone and make sure to protect your bankroll, cheers
