$AAPL will be a good a buy in the eightiesJust my TA, I see AAPL going down further, I believe that a good buy zone will be down in the 80$-90$ range.
TA

Bitcoin - large falling wedgeThe price on the daily timeframe is moving in a falling wedge. The lower timeframes show downward price compression and liquidity in the $29300-29200 zone. Important next levels and zones: $28850-28650, $28050-28000, $26700. There are many stop-losses of the different caliber of traders behind these levels. There is a high probability that we will harvest it all. It is the road to $20,000. The horizontal volume levels are on the verge of the abyss. Support around $30000 is significant, but if the price breaks through the nearest liquidity zones - the path to $20000 will be almost inevitable, or even lower with some squeeze. After testing $20,000, I expect the price to return to the zone of maximum vertical volume - about $40,000 before the end of 2022.
Best regards,
EXCAVO

Just my 1st ideaJust my 1st idea after a year of TA studies... Any comments are more then welcome...


Teladoc Short and LongTeladoc is range bound atm. We might have this range for a long time. best trades are to long the low and short the top.
We got a rejection from the POC of the range and are making our way down to the golden pocket, HVN and an orderblock.
If we loose this level i am looking down to the bottom of the channel.
As being in the channel we are also in a descending triangle type structure. Looking to see how this brakes also.
No financial advice. Just sharing trade ideas.
Cheers

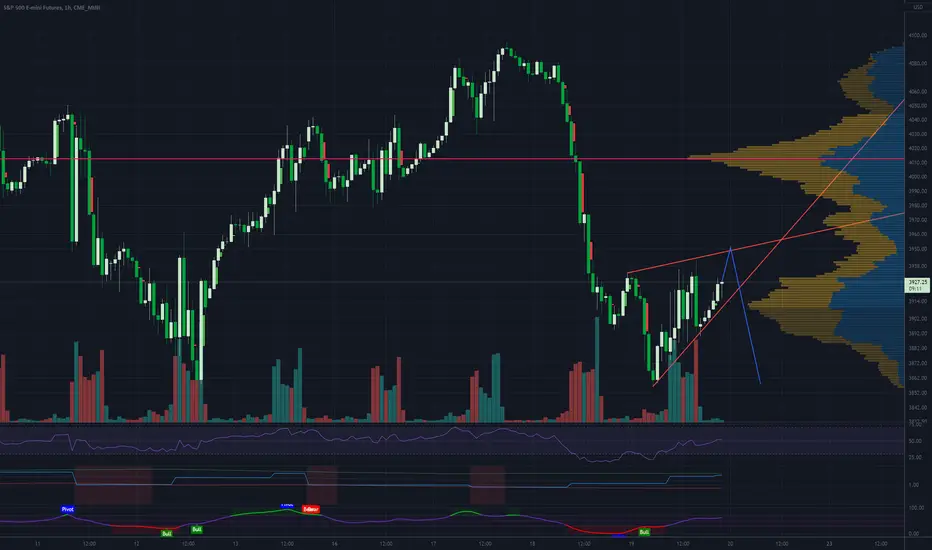
ES 1 Hour Ascending Triangle - BearishES/SPX in an ascending triangle. Going down Friday. Other indexes are in a similar pattern.
BTC/USD ShortQ2 5-19-K22 We have a potential short opportunity. If Bitcoin fails to hold its 30K level with declining volatility. Then, we may see a correction back to 25K to validate or Invalidate the next level of psychological support. In terms of a ''short'' context that is.
(Note) Please do your DD before application of a position. This is Idea is highly aggressive and vouched for by @Ra_way leader of the guild.
BINANCE:BTCUSDT
THI$ I$ THE WAY
EN -30,455
SL- 32.5K
TP 1 - 27K
TP 2- 26K

Solana may be forming an ascending triangle to the 65/70 levelSolana may be forming an ascending triangle to the 65/70 level

29 -> 35-40 (max) -> 23
We haven't seen a SFP and "just" bounced o f a HTF Daily support level. Should we reject from the W (yellow, dotted since traded), I expect another leg down into the 1:1 trend based fib extension.
However, flipping that W(eekly) S/R Level into support, should bring us up to 35, if not 38. Unlikely, but possible, the highs around 40k could be taken too, while I believe they serve better for a re-visit at alter point - sometime...
Ensure to add VPFR(s) to get VAL/VAH/POC on this "bounce".
Long story short: I can see some relief but doubt the bull market is back and expect lower - rather sooner than later.
Note:
I am sharing my personal point of view based on my own analysis - which is a lot more in depth than shown on the chart(s).
The mix between a "simple" Chart while still providing enough context to make sense of it is a matter of taste. Like it or not. However, I, personally, "hate" those people throwing a line on the chart leaving the audience in doubt completely.
I don't care if I am wrong or right. My plan could change within 15 minutes without me sharing an update. Therefore take this is an idea rather a setup.
In no way, I am sharing any kind of financial advise.

Long Scalp SPX/SPY May 04 2022We can see based on the yearly volatility , that the current expected movement is around 1.75 - 2% +-
Our top is going to be 4250
Our bot is going to be 4075
From the technical analysis point,
Volume was broken on the top side above 4150 and 4175 (yesterday and today POC volume) so thats a strong momentum indication for long opportunity.
At the same time we can see that on 15 min we got a long entry at 4155
I believe we can go towards 4200 minimum
From fundamental point of view
We have the PMI release and later on today we have FOMC -> interest rate decision.
This last movement is the one that bring the highest amount of volatility possible.
So I strongly recommend you to be out of the position before that happens, and once the market stabilize and takes a direction, re enter again.

Eth usd 29 April 2022TOP Side = 3000 - 3050 according to Implied Volatility and ATR
BOT Side = 2820 - 2775 according to Implied Volatility and ATR
Expected movement at 28April 00h between 3.5 - 5.5% movement during the day
In terms of fundamentals that can affect BTC
In terms of technical analysis, our product ONE TOOL TO RULE
On 4hours, or calculus product gave a short at 3020 on 22April
For 10 min ONE TOOL TO RULE gave a short entry around 2920.
At the same time we can see that main concentred volume area is around 2920, 2nd level
2940 and last one 3000. So overall there is not so much interest above these points
Conclusion:
After the "rally" from yesterday, once we hit close the 3k area,
we see how the market started to bounce so I believe today we are going to have a continuation of that
short movement,and close around 2900-2850(or below)

TSLAHave a feeling we got our last taste of the 1000's for a few weeks .. maybe months even.
Don't want to bring too many predictions to the table, although this has a bearish look and I have plenty of bearish targets on TSLA, that I WILL be buying at each support lvl.
TSLA stock is dominate and will continue to dominate in the long term.
-------------------
Below 900 stay bearish
Buy zones :
770 - 800
600 - 640
430 - 470

AMC Major Upwards Movement SoonA lot of AMC apes are worried about the day-to-day price movement. In my opinion, as long as it doesn't drop below 14.50 for more than a day, I'm hyper-bullish on a run up between now and the start of August.
Keeping calm and accepting that this could take a couple more months before it blows will do wonders to investors' mental health. Stop worrying about little drops. The stock is still within it's descending triangle. Soon, but not that soon we will break out.
Be smart. Be patient.

RUNEUSDT This is my possible set up on RUNEUSDT hopefully BTC won’t spoil the set up for usdt
Entry matters
DCA WOULD BE NICE TOO BUT USE LOW LEVERAGE THE JOURNEY IS FAR
Success all traders

Bitcoin price 7 Zones.The #Bitcoin price has been moving within a defined 7 zones since almost a year.
Defining the zones helps anticipating the Support & Resistance levels.
What do you think?
Thanks for reading.
Nader.

What is a breakout? #breakout #Candlestick #TA #Tocademy
Hello. This is Tommy.
The lecture material I prepared today is a concept that must be well informed by TA(Technical Analysis) traders, especially in recent market where untraditional patterns, price actions and trends, as we call ‘scam moves’ occur all the time.
I bet you are familiar seeing retail traders or chart analysts shouting “breakout!”. In order to derive market trends and price action/momentum, we find millions of technical variables such as trendline, channel, Fibonacci retracements, pivot levels, and other indicators, etc. Then we seek for behavior of price action by observing whether these variables are kept valid (not broken) or become invalid as soon as they are broken. Understanding and utilizing this behavior, we make trading decisions by deducting optimal zones to enter position(support/resistance), set stoploss/target price(bottom/top), and statistically giving weights on particular scenarios.
In TA world, breakout means that the price has pierced through certain variables. It is commonly known that when the technical factors are broken, additional price momentum is expected towards the direction of the breakout. As the example above, let’s say that we found a falling trendline that are being formed, meaning that at certain point or area, trendline keeps pushing the price down forming LH(Lower High)s. As soon as the price pierce through the trendline, meaning that the trendline failed rejection, we say “trendline is broken above” and can expect more bullish rally. The direction of the trend would be vice versa when trendline under the price is broken below.
So, we buy when PA is broken above and sell when PA is broken below. That sounds so simple huh?
If it was that easy, everyone would be rich right now. I'm sure most of you reading this post are already aware that it's never easy. Why? It’s simple. In this world, there is no such thing as 100% “breakout”. To put it simply, everything we do based on the technical chart is somewhat relative, abstract, and subjective concept. It’s not like breakout has 100% succeeded, or failed but rather is more like breakout has succeeded in 60~70% chance. In other words, there are more than two possible future cases when we search and utilize breakout behavior.
So, we traders need a reliable standard to statistically quantify the ‘degree of breakout’. The most basic way according to the ‘textbook’ is to consider closing price of candlestick firstly crossing the variable. As the price of the candlestick closes above the trendline as case 3, we give a decent weight on breakout scenario.
However, case 2 is the one that confuses us every time. This is when the price did pierce through the trendline but closes below, usually leaving a long tail as a trace which sometimes is interpreted as a whipsaw. As soon as this happens, we have to admit that the chances and reliability is definitely lower than the case 3. It might be regarded as a false breakout or a noise if the trend continues afterwards and it might not actually. It’s a 50:50 call I would say.
When you encounter case 2, to give you a little tip, try waiting a little more to observe next following candles. If the next following candlesticks keep closing prices below, I would raise the probability that the breakout is a false one. In fact, it is best to just not give any meaning on breakout in case 2. It itself is a risk to confirm whether the breakout is successful, not successfully, or false and thus try not take aggressive trades in this very case.
Thank you for reading my posts. Trade Well!
Your likes, comments, and subscriptions are the greatest motivations for me to upload more posts.

SPY price Analysis April 1st SPY price Analysis April 1st
If you have any questions, feel free to comment down below!

AllianceBlockWell shit. There isn't much to say here folks. However, it has pretty much reached rock bottom, only way is up. + Albt moves similarly to Btc therefore it should see a pump very soon, just a matter of time.
Again, even if it doesn't pump anytime soon, i'm personally in this coin for the long term. I'm just gonna try trade it to increase my bag.
RSI definitely has room to go up = market up.
LongShort ratio is at 37:63 = market up.
Macd looks like it's about to cross up.
S&R well.. its rock bottom lmao. where else is it gonna go?
#LAMBOINAUGUST

VXV price movementVXV lately been sh##ing the bed. However, i believe this is upside for it. Easily retrace to the 15s + -20s + mark.
RSI looks undervalued quite a bit
Long:Short ratio is at 36:64, meaning more people shorting and selling = market trend is up ^^^^
MACD is bound to reverse up.
The chart itself, S&R is positive in my eyes. We might hit the 1.8s before breaking 2.2s
This is more of a long term coin i'm personally holding but i'll be selling and buying to make my VXV bag bigger.

Bitcoin Daily Chart Analysis#Bitcoin USDT Pair:
TA 1D Chart- #BTC/USDT
👉 In Daily TF it's following a falling Ascending Triangle pattern.
👉 It did breakout above from marked Resistance Zone.
👉 As of now, seems Bullish.
👉 Target is about 52K in short term .
👉 Strong buying Area- retest at marked support zone.
Keep Learning😃💯
➖➖➖
Cheers,
Team Crypto Billu
#CryptoBillu #HappyTrading💯 #NFA #DYOR

$omi buy zoneThesis: Using Elliot wave theory from our 1-5 correction with a trend-based fib from 1-2 we've retraced back down to our 1.618 level. That level is also shown in the past looking at our green box to be a clear area of support. Using a trend line from Jun 2021 if we look at recent price action it lines up with the idea of this being a local bottom. I personally bought $350 @ 0.00285 and will be buying another $350 if we can reclaim support above our resistance line from March 2021.

Looks dubious for QNT.A descending series of symmetrical triangles. Don't be surprised to see QNT visit the recent low of ~83.
I'd like to get a buy-and-hold on QNT when BTC bottoms out, but where will that be -- 30k? 25k? 20k? Lower?
A swing long on QNT is in the cards for me if BTC is at support when/if QNT hits 83-ish.
