Tadawul
Saudi Re - 8200 We should be expecting a new low = Scenario No1 Hello Traders,
Previously I built up positions that Saudi Re should starts a WAVE 3 up, our analysis were wrong, and we saw that it created a new low. There are two scenarios, I will speak about the first, which looks like most probable so far
1st Scenario
Saudi Re is in the third wave down, and it should target a target zone of 4.00 Saudi Riyal. We short the moment it hits lower price zones than 5.30 Saudi Riyal. If this price or new low was not achieved, then we might be looking at the second scenario, which we are in wave 2! I will explain it in another post.
Happy Trading
Harbs
REITS Index, Tadawul, Where we are from an Elliot Wave POV?Hello All,
Tadawul declared that the Saudi Market requires more listed Reit Companies in Saudi Arabia TADAWUL:TRTI , and they justify that there is a need and more demand from investors. It has been one year so far and we do not see such demand from an Elliot wave principle, which makes us produce two theories of Elliot Wave
1- We are facing a temporary trade-able ABC Correction up, then it will continue going down for a while.
2- It is the end of Wave 1 where it traced more than 100%, and we are in a long position for a new wave up.
Either ways, the indications that we see today is to go up and we recommend to go long. We are more in fav of the above first opinion, however, we need to see how this goes in the long RUN.
Go long.
sahara petrochemcialsBroken out of long term resistance with good volumes. Go long with a short term tgt of 20-22 . stockdada.com
8200 Saudi_Re Hello All TADAWUL:8200
Just to define the elliot wave on Saudi_Re TADAWUL:8200 , We can see the correction ABC is over of the 4th wave, and we should expect the 5th wave with a target of 12.00 SAR minimum :)
My other thoughts is the whole wave is considered 1 :) we could be in the third wave of some degree :)
8200. Ola la! We might be looking at Wave 3 developing right nowHello Traders,
Our first analysis about TADAWUL:8200 was that we were in the process of developing wave 5! I guess we were wrong!!!! Since Nov 2017 and things became more obvious, we are certainly in the process of Wave 3, it is still developing! which we expect a very powerful uptrend, nothing can stop this trend!
We should be targeting between 13 to 17 SAR for W3
Happy Trading!
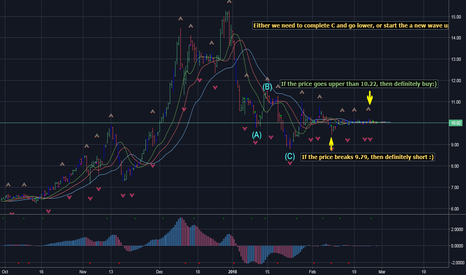
4300 It totally depends on which price it hits first :) Hello Traders :)
Now, it is a matter what price it will be hit first :) so we have two options:
1- Price hits 10.24, definitely go long and buy big time :)
2- Price hits 9.79, defintly go short and sell big time :)
There are no buts, the rule is clear :)
Happy Trading :)


