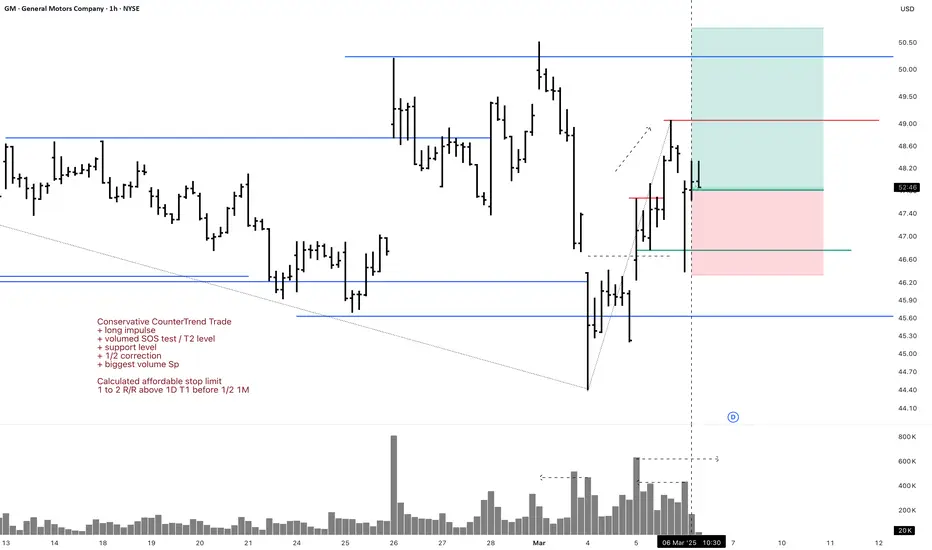
GM 1H Long Swing Conservative CounterTrend TradeConservative CounterTrend Trade
+ long impulse
+ volumed SOS test / T2 level
+ support level
+ 1/2 correction
+ biggest volume Sp
Calculated affordable stop limit
1 to 2 R/R above 1D T1 before 1/2 1M
Daily CounterTrend
"- short balance
- unvolumed expanding T1
+ volumed 2Sp+
+ test"
Monthly Trend
"+ long impulse
- below 1/2 correction
+ SOS test level?"
Yearly Trend
"+ long balance
- neutral zone"
Will add more if 5M corrects to 1/2 or 1H doest weak test and resumes buying
Takeprofit
GM 5M Long Conservative Trend TradeConservative Trend Trade
+ long impulse
+ SOS level
+ support level
+ 1/2 correction
+ Sp
Calculated affordable stop limir
1 to 2 R/R take profit
1H Trend
"+ long impulse
+ volumed SOS test / T2 level
+ support level
+ 1/2 correction
+ biggest volume Sp
+ weak test
+ first buying bar closed"
1D CounterTrend
"- short balance
- unvolumed expanding T1
+ volumed 2Sp+
+ test"
1M Trend
"+ long impulse
- below 1/2 correction
+ SOS test level?"
1Y Trend
"+ long balance
- neutral zone"

AUD_NZD LONG SIGNAL|
✅AUD_NZD is going down to retest
A strong horizontal support of 1.0947
And the pair is clearly oversold
So after the price hits the support
We can go long on the pair expecting
A bullish correction with the
Take Profit of 1.0965 and
Stop Loss of 1.0939
LONG🚀
✅Like and subscribe to never miss a new idea!✅
Disclosure: I am part of Trade Nation's Influencer program and receive a monthly fee for using their TradingView charts in my analysis.

GBP_AUD LONG SIGNAL|
✅GBP_AUD is moving down
Down now to retest a horizotnal
Support level of 2.0327 from
Where we can enter a long
Trade with the Take Profit
Of 2.0413 and SL of 2.0270
LONG🚀
✅Like and subscribe to never miss a new idea!✅
Disclosure: I am part of Trade Nation's Influencer program and receive a monthly fee for using their TradingView charts in my analysis.

GBP_NZD NEW LONG SIGNAL|
✅GBP_NZD is going down now
But a strong support level is ahead at 2.2454
Thus I am expecting a pullback
So we can prepare to enter
A long trade with the target 2.2562
And Stop Loss of 2.2406
LONG🚀
✅Like and subscribe to never miss a new idea!✅
Disclosure: I am part of Trade Nation's Influencer program and receive a monthly fee for using their TradingView charts in my analysis.

EUR-NZD Risky Long! Buy!
Hello,Traders!
EUR-NZD is approaching a
Horizontal support level
Of 1.8868 so after the
Retest of the support
A long trade with the
Target Level of 1.8947
And Stop Loss of 1.8851
Buy!
Comment and subscribe to help us grow!
Check out other forecasts below too!
Disclosure: I am part of Trade Nation's Influencer program and receive a monthly fee for using their TradingView charts in my analysis.

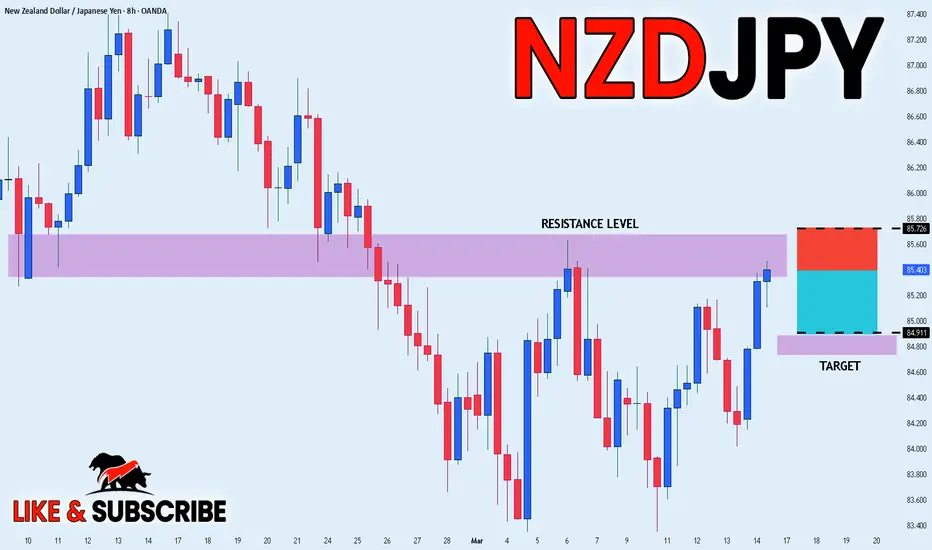
NZD_JPY SHORT SIGNAL|
✅EUR_USD has been growing recently
And the pair seems locally overbought
So as the pair is approaching a horizontal resistance of 85.6800
We can enter a short trade
At 85.3890 with the Target of 84.9110
And the Stop Loss of 85.7260
Just above the resistance
SHORT🔥
✅Like and subscribe to never miss a new idea!✅
GBP-USD Bearish Breakout! Sell Limit!
Hello,Traders!
GBP-USD was trading in an
Uptrend and the pair was locally
Overbought so as we are seeing
A bearish breakout we are
Locally bearish biased
And we can set a Sell Limit
Order at 1.8649 with the
Target being 1.8465
And the Stop Loss at 1.8773
Slightly above the local high
Sell!
Comment and subscribe to help us grow!
Check out other forecasts below too!
Disclosure: I am part of Trade Nation's Influencer program and receive a monthly fee for using their TradingView charts in my analysis.

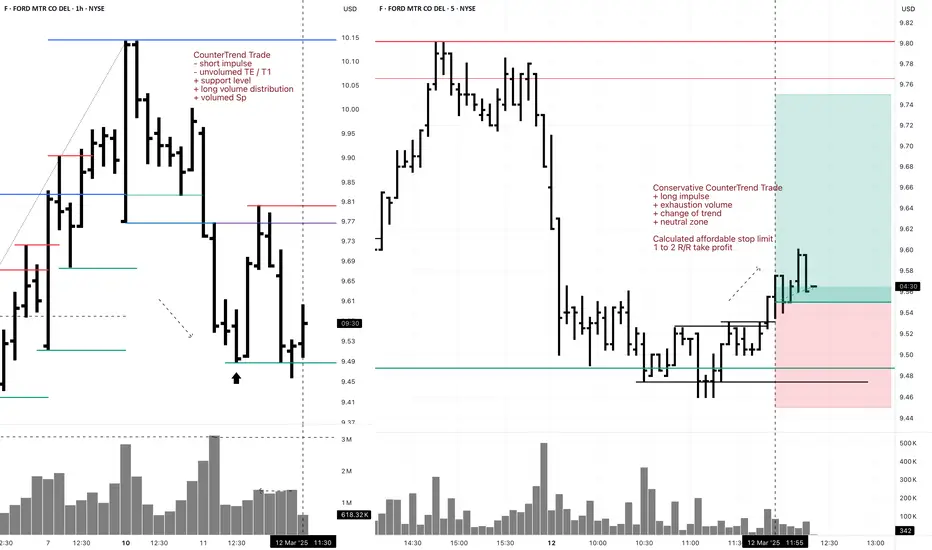
F 5M DayTrade Long Conservative CounterTrend TradeConservative CounterTrend Trade
+ long impulse
+ exhaustion volume
+ change of trend
+ neutral zone
Calculated affordable stop limit
1 to 2 R/R take profit
1H CounterTrend
"- short impulse
- unvolumed TE / T1
+ support level
+ long volume distribution
+ volumed Sp"
1D CounterTrend
"+ long impulse
- biggest volume on correction
- below SOS test level
- below support level
+ 1/2 correction"
1M Trend
"- short impulse
+ 1/2 correction
- unvolumed T1
+ support level
+ reverse volume approach
+ volumed manipulation"
1Y Trend
"+ long impulse
+ volumed T2 level
+ volumed 2Sp+
+ weak test"
F 5M Daytrade Conservative CounterTrend TradeConservative CounterTrend Trade
+ long impulse
+ T1 level
+ support level
+ 1/2 correction
+ volumed 2Sp-
Calculated affordable stop limit
1 to 2 R/R take profit
1H Countertrend
"- short impulse
- unvolumed TE / T1
+ support level
+ long volume distribution
+ volumed Sp
+ test"
1D Trend
"+ long impulse
- biggest volume on correction
- below SOS test level
- below support level
+ 1/2 correction"
1M CounterTrend
"- short impulse
+ 1/2 correction
- unvolumed T1
+ support level
+ reverse volume approach
+ volumed manipulation"
1Y Trend
"+ long impulse
+ volumed T2 level
+ volumed 2Sp+
+ weak test"

MRK 5M Long Investment Aggressive CounterTrend TradeAggressive CounterTrend Trade
- short impulse
+ exhaustion volume
+ volumed T1
+ volumed 2Sp-
+ weak test
+ first bullish bar closed entry
Calculated affordable stop limit
1/2 1M take profit
Hourly CounterTrend
"- short impulse
+ 1D SOS level"
Daily Trend
"+ long impulse
+ SOS level
- before 1/2 correction"
Monthly CounterTrend
"- short impulse
+ 1/2 correction
+ exhaustion volume?"
Yearly Trend
"+ long impulse
+ 1/2 correction
+ exhaustion volume?"

F 5M Long Conservative Trend DayTrade Conservative Trend Trade
+ long impulse
+ SOS level
+ 1/2 correction
+ support level
+ biggest volume 2Sp+
Calculated affordable stop limit
1D T2 take profit
1H Trend
"+ long impulse
- before 1/2 correction
+ SOS test level"
1D Trend
"- short impulse
+ exhaustion volume
+ volumed TE / T1 level
+ biggest volume 2Sp+
+ test"
1M CounterTrend
"- short impulse
+ 1/2 correction
- unvolumed T1
+ support level
+ reverse volume approach
+ volumed manipulation"
1Y Trend
"+ long impulse
+ volumed T2 level
+ volumed 2Sp+
+ weak test"

Behind the Buy&Sell Strategy: What It Is and How It WorksWhat is a Buy&Sell Strategy?
A Buy&Sell trading strategy involves buying and selling financial instruments with the goal of profiting from short- or medium-term price fluctuations. Traders who adopt this strategy typically take long positions, aiming for upward profit opportunities. This strategy involves opening only one trade at a time, unlike more complex strategies that may use multiple orders, hedging, or simultaneous long and short positions. Its management is simple, making it suitable for less experienced traders or those who prefer a more controlled approach.
Typical Structure of a Buy&Sell Strategy
A Buy&Sell strategy consists of two key elements:
1) Entry Condition
Entry conditions can be single or multiple, involving the use of one or more technical indicators such as RSI, SMA, EMA, Stochastic, Supertrend, etc.
Classic examples include:
Moving average crossover
Resistance breakout
Entry on RSI oversold conditions
Bullish MACD crossover
Retracement to the 50% or 61.8% Fibonacci levels
Candlestick pattern signals
2) Exit Condition
The most common exit management methods for a long trade in a Buy&Sell strategy fall into three categories:
Take Profit & Stop Loss
Exit based on opposite entry conditions
Percentage on equity
Practical Example of a Buy&Sell Strategy
Entry Condition: Bearish RSI crossover below the 30 level (RSI oversold entry).
Exit Conditions: Take profit, stop loss, or percentage-based exit on the opening price.

MGNT 1H Long Investment Conservative Trend TradeConservative Trend Trade
+ long impulse
+ SOS level
+ 1/2 correction
+ volumed 2Sp-
- day will close without test
Calculated affordable stop limit
1/2 1M take profit
Daily Trend
"+ long impulse
+ SOS test / T2 level
+ support level
- strong approach from volume zone
+ biggest volume manipulation"
Monthly Trend
+ long impulse
+ expanding biggest volume T2
+ support level
+ 1/2 correction
+ unvolumed 2Sp-
+ strong buying bars
+ weak selling bar / test
Yearly no context

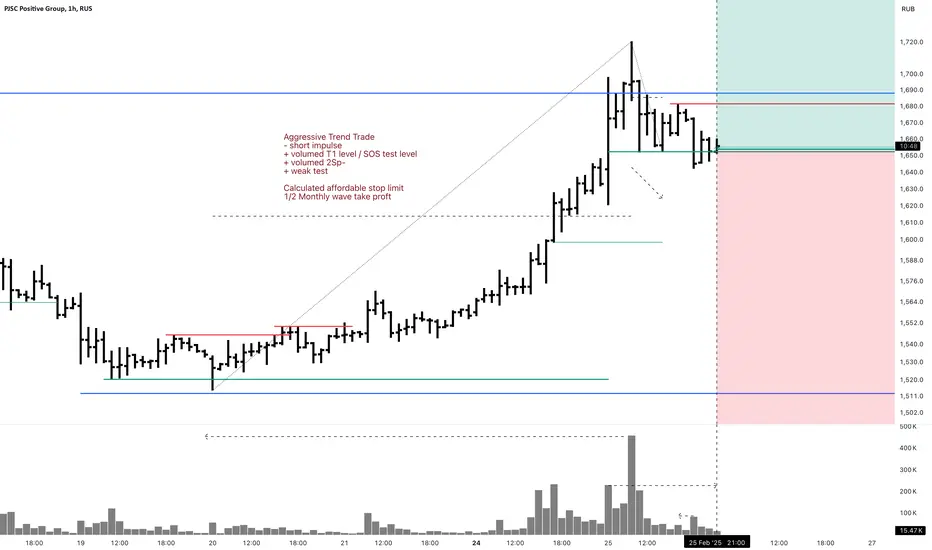
POSI 1H Investment Aggressive Trend TradeAggressive Trend Trade
- short impulse
+ volumed T1 level / SOS test level
+ volumed 2Sp-
+ weak test
Calculated affordable stop limit
1/2 Monthly wave take profit
Daily Trend
"+ long impulse?
- resistance level
- short volume distribution"
Monthly Trend
"+ long impulse
+ 1/2 correction
+ volumed expanding T1
+ support level
+ biggest volume manipulation"
Yearly Trend
+ long impulse
Weird set up. Market is strong and Monthly look a lot like exhaustion!
O 1D Investment Aggressive Trend TradeAggressive Trend Trade
- short impulse
+ biggest volume TE / T1
+ support level
+ biggest volume 2Sp-
+ weak test
+ first bullish bar close entry
Calculated affordable stop limit
1 to 2 R/R take profit
Monthly Trend
"+ long impulse
+ 1/2 correction
+ SoS level
+ support level
+ weak approach"
1Y Trend
"+ long balance
+ volumed manipulation
- neutral zone"

Sell, Hold, or Hope? Netflix Approaches $1000Hi,
Looking at Netflix's historical price behavior around psychological round numbers ($100, $500), we see a pattern that indicates it might be a good idea to lock in some profits at these levels.
Why?
- Round numbers often act as psychological barriers where prices tend to consolidate or range for a while, limiting further growth.
- There's a significant chance of a correction, especially after a strong rally like the one we've seen recently.
Both of these scenarios suggest it's worth considering taking some money off the table. One thing is for sure: please avoid letting FOMO influence your decisions at these prices - don't buy it at the moment. There will be better changes, just be patient enough!
Historical Examples of Psychological Round Numbers
$100 Level (2015-2016)
In July 2015, Netflix approached the $100 level. While it did show some upward movement, the price largely ranged around this area until late 2016. It was stuck for months, offering limited returns for those who didn't react.
$500 Level (2021-2022)
Around $500, Netflix once again demonstrated the same behavior. For about a year, the stock did little more than range around this level. This shows how powerful round numbers can be as areas of stagnation.
Current Major Level: $1000
While Netflix has surpassed previous round numbers, $1000 is shaping up to be the most significant psychological level yet. The rise to this point has been enormous, and history suggests that sooner or later, a correction is likely.
If you're not prepared to hold through a potential correction or consolidation, the current price levels might be an ideal time to lock in profits. Long-term holders who stick to their thesis might choose to ride this out, the choice is yours. However, for mid-term investors, locking in some gains here could be a wise move!
"Sell, Hold, or Hope?"
Let's say in that way - I hope that some holders will sell around current prices! ;)
All the best,
Vaido

SMLT 1D Aggressive Investment CounterTrend TradeAggressive CounterTrend Trade
- short impulse
+ biggest volume T1
+ support level
+ biggest volume 2Sp+
+ weak test
+ first bullish bar closed entry
Calculated affordable stop limit
1 to 2 R/R take profit
CounterTrend 1M
"+ short impulse
+ biggest volume TE / T1 level
+ support level
+ biggest manipulation?"
Trend 12M
"+ SOS test level
- far below 1/2 correction
+ support level
+ biggest volume manipulation?"
They say company is going to bankruptcy, but why would it concern technical analysis?!

The TrumpCoin Craze: What’s Really Going On?Yesterday, something truly bizarre happened in the world of crypto. Donald Trump—yes, that Donald Trump—launched his very own cryptocurrency, TrumpCoin ($TRUMP).
At first, like everyone else, I thought his account had been hacked.
I mean, launching a meme coin just days before his presidential inauguration? Come on...
But nope, it’s 100% real. Verified.
Like many others, I got curious and, let’s face it, greedy. So, I bought in. The result? I cashed out at a nice 3x profit, enough for a fun night out. But before we dive into the crazy market activity, let me clarify a couple of things:
- I’m not a Trump fan. This isn’t about politics.
- I don’t think this is a rug pull, at least not intentionally .
It seems more like someone who doesn’t fully understand how crypto works decided to jump in.
A Brief Timeline of Chaos
TrumpCoin was announced on his social platforms, including Truth Social and X (formerly Twitter). Initially, everyone thought it was fake news. I mean, a meme coin with his name on it? Right before inauguration day? It screams “scam.” But soon after, major crypto news outlets confirmed its legitimacy.
And then the madness began. Within hours:
- Market cap: Over $14 billion at the time of writing(and climbing).
- Trading volume: A jaw-dropping $11 billion in just one day.
- Price swings: The coin hit a high of $3.30 before dipping below $1.50 and now is above $4.
Trump’s company, CIC Digital LLC, reportedly holds 80% of the coin supply, making this a financial windfall for him—even if the project crashes.
The Crypto Community Splits
This move has divided the crypto space. On one hand, you have people who are treating $TRUMP like any other speculative asset. ( Hi, that’s me! )
On the other, there are folks who see it as a statement of loyalty to Trump. Then there’s a third group—the skeptics—who warn that this could end in disaster.
The real problem? Newbies are piling in without understanding what they’re doing. The hype is pulling in people who don’t know a rug pull from a blockchain. They’re buying and buying, hoping to ride the wave, and are likely to get burned when the bubble bursts.
Is This a Rug Pull?
Let’s address the elephant in the room. With 80% of the supply in Trump’s control, the setup raises eyebrows. But is this an intentional scam? Probably not. If anything, this feels more like a PR stunt gone wild—a way to cash in on his fame and make a splash before returning to the White House.
That said, the outcome could still be the same. At some point, the hype will die, the price will tank, and many will lose money. The bigger it gets, the harder it’ll fall.
My Take: Enjoy the Ride, but Be Careful
TrumpCoin is the epitome of crypto’s wild side: volatile, unpredictable, and more about hype than substance. If you’re diving in, know what you’re getting into. For me, it was a quick trade—buy low, sell high, and get out. But I worry about the inexperienced investors who are holding on, hoping for it to hit $10, $20, or even higher.
So, here’s my advice:
Don’t invest more than you can afford to lose.
Take profits while you can.
Remember, just because something is popular doesn’t mean it’s sustainable.
Whether $TRUMP reaches a $25 billion, $50 billion market cap or crashes spectacularly, one thing’s for sure—it’s going to be one heck of a ride.
Stay safe out there, and happy trading!

XLV Swing Long 1H Conservative CounterTrend TradeConservative CounterTrend Trade
+ long impulse
+ 1/2 correction
+ T2 level
+ biggest volume Sp
- resistance level
Calculated affordable stop limit
1 to2 R/R take profit before 1/2 of the Day
Daily Context
"- short impulse
- unvolumed T1
+ support level
+ volumed Sp"
Monthly Context
"+ long impulse
- SOS level broken
- far below 1/2 correction"
Yearly Context
"+ long impulse
- resistance level"

NLMK 1H Long Swing Trend TradeTrend Trade
+ short impulse
+ support level
+ biggest volume T1?
- 1 bar reversal?
+ volumed 2Sp
+ weak test to 1/2
+ first bullish bar closed entry
Calculated affordable virtual stop
1 to 2 R/R expandable to 1D if closed Sp take profit
Daily Trend
" + long impulse
+ 1/2 correction
+ JOC level
+ support level
+ volumed manipulation"
Monthly Trend
"+ long impulse
+ T2 level
+ support level
+ volumed manipulation"

HUBB 1H Long Swing Aggressive Trend TradeAggressive Trend Trade
- short impulse
+ biggest volume TE / T1 level
+ support level
+ boggest volume Sp
Calculated affordable stop limit
1 to 2 R/R take profit
Daily Trend
"+ long impulse
+ T2 level
+ 1/2 correction
+ support level"
Monthly Trend
"+ long impulse
+ T2 level
+ 1/2 correction
+ support level"
Yearly Trend
"+ long impulse
+ neutral zone"

Optimized MACD Study with AlertsThis Pine Script study enhances the classic MACD indicator with additional functionality, making it a powerful tool for traders who want actionable and visually intuitive signals on their charts. It is designed to help traders identify BUY and SELL opportunities with customizable alerts, along with visual labels for better chart interpretation.
Key Features:
Customizable MACD Settings:
Users can adjust the Fast EMA, Slow EMA, and Signal Smoothing parameters to fit their specific trading strategies and preferences.
Take Profit Logic:
The script includes a take profit mechanism that tracks price movement after a BUY signal and highlights when the target is achieved.
Visual labels ("Take Profit Hit") make it easier to track price performance directly on the chart.
Visual Signals:
BUY signals are labeled clearly on the chart when the MACD line crosses above the Signal line.
SELL signals appear either when the take profit is hit or when the MACD line crosses below the Signal line, making it easy to interpret market conditions at a glance.
Dynamic Alerts:
Selectable alerts are included for both BUY and SELL signals, allowing traders to stay informed in real-time without constant monitoring.
Alerts dynamically display the symbol, time, price, and reason for the alert (e.g., BUY Signal or SELL Signal due to Take Profit or MACD Exit).
User-Friendly and Flexible:
This study is versatile and suitable for different asset classes and timeframes, from cryptocurrencies to stocks or forex.
Clear visual annotations and dynamic alert messages make it beginner-friendly yet powerful enough for experienced traders.
How to Use:
Attach the script to your preferred chart and timeframe, adjust the MACD settings as needed, and set up alerts using the "BUY Alert" and "SELL Alert" conditions in the TradingView alert system. The custom alert messages provide key details, such as the symbol, time, and current price, helping traders respond quickly to opportunities.
This script is ideal for those looking to enhance their trading strategy with actionable insights and automated notifications. Whether you're day trading or swing trading, the Optimized MACD Study provides a robust framework for informed decision-making.
