GBPUSD 4H SHORT TRADENFP may not effect this pair too much
If price goes up from here Sell Limit @ 1.8165
If price continues to drop Sell Stop @ 1.8025
Take Profit is @ 1.7925
Stop loss @ 1.8231
Or if Macd crosses above Red signal line
Also you can exit early at 1.8115
Takeprofit

USDCAD 4H RANGE TRADESPair has been in a consolidation pattern above the 50 sma.
Buy stop @ 1.2918 if prices pushed for a higher high in the up trending pattern
Long Take Profit @ 1.2995
Sell Stop @ 1.2795 if price drops below the 50 sma
Sell Take Profit @ 1.2730
I will follow the Macd for a stop loss either direction.
If Macd crosses either the Red Signal Line or the Zero level line against open trade
Or a hard stop of 26 pips above/below the candle that opens your trade

GBPUSD 4H RETRACEMENT PHASE TRDEPrice in an obvious down trend
Anticipating a retracement phase
NFP is the end of the week
Probability this price action will reverse because:
Price would move to a more neutral position before Friday
Price stretched far from ma's core center
Macd stretched far from zero line
Macd over sold
Possible Fractal Bullish breakout setup developing at current price action


Continuation of Gann Fan Propulsion Strategy Steps 3-4-5Step #3: Apply again the Gann Fan Indicator on the Swing low Prior to the Breakout above 2/1Gann Fan Angle
How to use the Gann fan indicator? Simply follow the instruction presented in the above sections.
At this point, you can also get rid of the previous Gann fan angles drawn from the swing high. This will make sure your chart will not get cluttered and the price is still visible.
One of the reasons why this is the best Gann fan strategy is because we use the Gann fan indicator to track every swing in the market.
At this point, your trade is opened, but we still need to determine where to place our protective stop loss and take profit orders, which brings us to the next step of best Gann fan trading strategy
Step #4: Place Your Protective Stop Loss below the Most Recent Swing Low Which should align with the point from where you draw the second set of Gann Fan Angles.
The best Gann fan strategy has a very clear level where we should place our protective stop loss order which is right below the swing low located prior to the 2/1 Gann angle breakout.
Step #5: Take Profit once we Break and Close Below the 2/1 line.
We want to ride the new trend for as long as possible and with the help of the Gann fan indicator, we can pinpoint the ideal time to take profits. We take profit at the earliest symptom of market weakness which is a break below the 2/1 line that signals a possible start of a bearish move.

SYS-BTC Strong divergent signal MACD/RSIPotential price increase :)
Exchanging with your head and remember we buy cheap and sell dear.

BTC: Beware the Bearish GartleyCould be a good idea to lock in some profits just in case BTC has a deep correction. The .774 across the top is very close to an exact .786 for a Bearish Gartley setup. Adam & Eve should still be in play even this correction.

EURAUD SHORT TRADE NOWEntered trade at 1.6019
Take Profit @ 1.5955
Day chart price has fallen into BB Dev 1 band channel bearish bias
4H - Macd over bought/falling to 50 sma/needs to break below to 100 sma
1H - Price entered trade moving to take profit @ 1.5955

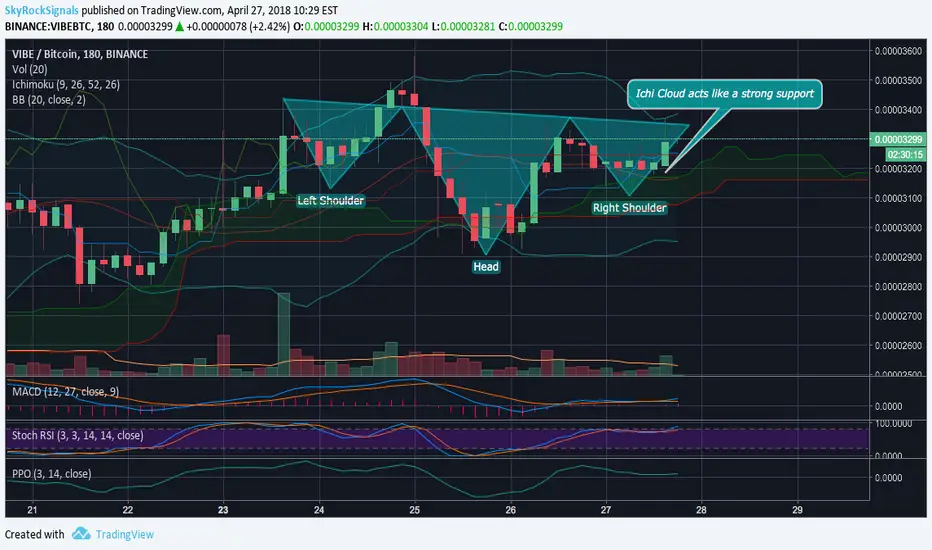
VIBEBTC Reversed H&SWe found a finished reversed H&S pattern and analyzed technical indicators which are bullish now. It seems like Ichi Cloud acts like a strong support zone, the price bounces from the upper edge of it. Chikou Span line is above Tenkan-sen line which means lagged for m periods close price is higher than the line of reverse so there should be a bounce which will start uptrend. Reversed H&S pattern has been formed which enhances our forecast
GBPUSD 4H TRADESEURUSD fell to 800 sma
GBPUSD could follow
Short Trade
Sell Stop @ 1.3867
Take Profit @ 1.3775
Long Trade
Buy Stop @ 1.4005
Take Profit @ 1.4070

USDJPY 1H BULLISH CONTINUATION TRADEBig 3 Indicator still showing green Bullish bias
15m Buy Stop shown for entry
4h Sup/Res level will be Take Profit

LUNBTC a hot short term trade opportunityWe detected a BB contraction and volume rising. The price went down sharply, however it managed to recover very quickly forming Gartley butterfly pattern. If it happens the price will reach ichi cloud and hit our targets. Indicators are bullish and market situation is favorable. The signal is already in the Premium channel

The pair continues to move in a downtrendHaving formed the "Double top" figure, our pair is directed downwards and is able to stand under the mark of 1.22 at the moment.
Prior to this, having found the resistance level near the 1.2235 mark, it steadily rushed down. If we consider this motion from the point of view of the Elliott wave theory, then we can observe the formation of the third wave, which must overcome the levels of 1.2180 and 1.2150.
So we recommend taking short positions by setting take-profits near these levels.
Otherwise, if the pair fails to consolidate below these levels, we assume the entry of the price into the corridor with the lower limit of 1.2180.

USDCAD 4H 3 SHORT TRADE ENTRIES1st ENTRY - Macd cross below Red signal line
2nd ENTRY - Sell Stop 1.2810 support breakout
3rd ENTRY - Sell Limit Range Top
1st Take profit 30 pips from entry
2nd Take profit 1.2735 Support level
SL above range top

EURUSD 4H LONG TRADEPrice has been stretched from ma's awhile
Macd about to cross above red signal line rising up to 0 level line
Enter with a break-hook-go on 15m chart or buy stop
Take profit at the whole number @ 1.2300
SL below swing low

ETHUSD Bouncing Short off Day ResistancePrice has hit multi Day resistance level
15m chart wait for break-hook-go for entry on a 5m chart
Take profits shown
SL above day resistance

STELLAR CRYPTOCURRENCY STRATEGYSTELLAR/DOLLAR 4H
DOUBLE BAR LOW HIGHER CLOSE PATTERN (DBLHC)
What is Stellar Lumens?
Stellar is a platform that it’s trying to do very fast payments with very low fees. The key advantage of Stellar is that it has between 3 and 5 seconds confirmation time and it supports thousands of transactions per second.
Stellar Lumens price is below the $1 and trading at only a few cents, which makes XLM a top cryptocurrency under $1.
Stellar Cryptocurrency Strategy
All we need for swing trading cryptocurrency is the Double Bar Low Higher Close pattern also known as the DBLHC pattern.
All you need is to look for two bars that have equal lows or near the same price level. The second condition that needs to be satisfied for a valid DBLHC is that the second candle needs to close a lot higher than the first candle (see chart above).
Usually, the bar tails are tiny, but the candlestick body is large.
Step #1: Find a bullish trend or wait until the market develops a swing low
The double bar low higher close can be found at the end of a bearish trend and the start of a new bullish trend acting as a reversal bullish pattern. However, at the same time, the DBLHC is also a continuation pattern that can develop at any stage during a bullish trend.
Having a prior trend already established increases the probabilities of the DBLHC pattern to work.
The DBLHC can produce the same kind of results even when the market is only in the process of establishing a market swing low. If a DBLHC develops right after a swing low is created that’s the confirmation we need that the institutional money is buying low.
Step #2: Wait until the DBLHC chart pattern develops on the Stellar XLM Chart
Now that you’re familiarized with the DBLHC pattern, it should come easily to spot this powerful chart pattern on the Stellar chart.
The DBLHC pattern has two identical lows and the second candle close is way higher than the high of the first candle.
In most of the cases the first candle will be bearish followed by a second bullish candle, but as we can see the Stellar price action is developing a DBLHC were the first candle is also bullish. This doesn’t invalidate the DBLHC chart pattern as in our books; it’s still a very tradeable chart pattern.
Step #3: Buy at the market at the opening of the next candle after the DBLHC pattern
When to buy Stellar is quite easy. As per the DBLHC pattern rules, we need to enter immediately at the market when the DBLHC has formed. Alternatively, we can place a buy limit order above the high of the second candle.
Buying Stellar with our cryptocurrency buy strategy will offer you a high risk to reward ratio.
The second advantage you have is that you’re buying Stellar right when the bullish momentum is starting to build up. Technically, this means that the price should never look back, which means that the drawdown should be minimal.
Step #4: Place protective Stop Loss below the DBLHC low
The DBLHC chart pattern also provides us with a great spot to hide your protective stop loss.
Trading without a stop loss is the number one mistake that traders make. Make sure you always trade with a stop loss to protect your account balance.
After you bought XLM coin, the protective stop loss can be placed below the DBLHC low.
Step #5: Take Profit when we break below the up-sloping trend line that connects the swing low points
The first thing we need to do when trading Stellar and you want to cash out some of your profits is to draw an up-sloping trend line starting from the swing low you identified in Step #1 and connect all the swing low points that are part of this new uptrend.
As soon as Stellar XLM price breaks and closes below the upward trend line you take profits.
This take profit strategy will maximize your trading profits and it will keep you as long as the bullish momentum is strong.
Note** the above was an example of a BUY trade using the Stellar cryptocurrency trading strategy. Use the same rules for a SELL trade – but in reverse.

GBPJPY 1H - SWING TRADING STRATEGY THAT WORKSStep 1 Wait for the price to touch the Upper Bollinger Band
The first element we want to see for our simple trading strategy is that we need to see price moving into overbought territory. Any swing trading strategy that works should have this element incorporated.
Note The preferred time frame for this simple swing trading strategy is the 4h time frame, but the strategy can be used on the daily and weekly time frame as well.
Step 2 Wait for the price to Break below the Middle Bollinger Bands
After we touched the upper Bollinger Band , we want to see confirmation that we indeed are in overbought territory and the market is about to reverse. The logical filter, in this case, is to look after a break below the middle Bollinger Band .
This break below middle Bollinger Bands is a clear signal in the shift in market sentiment.
We at Trading Strategy Guides don’t trade breakouts without disseminating weather or that there are real buyer/sellers – in our case, sellers – behind the breakout which brings to the next step of our simple swing trading strategy.
Step 3 Swing Trading Indicator: The Breakout Candle needs to be a Big Bold Candle that closes near the Low Range of the Candlestick. Sell at the Close of the Breakout Candle
So far our favorite swing trading indicator has correctly predicted this sell-off, but we’re going to use a very simple candlestick based method for our entry trigger. In this regard, we want to see a big bold bearish candle that breaks below the middle Bollinger Band .
The second element of this candlestick based method is that we need the breakout candle to close near the low range of the candlestick . This is indicative of strong sellers, which really want to drive this currency pair much lower.
Step 4 We hide our Protective Stop Loss above the Breakout Candle
The breakout candle has a lot of significance because we’ve used it in our candlestick based entry method. We assumed that this candle shows the presence of real sellers in the market. If the high of this candle were to be broken, it’s clear enough that this is simply a fake breakout as there are no real sellers.
Step 5 Take Profit once we break and close back below the middle Bollinger Bands or with a 3 to 1 risk ratio.
In this particular case we’re looking at a short trading example. So, if the price breaks back above the middle Bollinger Banks it’s time to get worried and take our profits as it can signal a reversal or if our 3 to 1 risk ratio has hit.
The reason why we get profit here is quite easy to understand as we want to book the profits at the early sign the market is ready to roll over.
Note The above was an example of a SELL trade. Use the same rules – but in reverse – for a BUY trade.

GBPJPY DAY SHORT TRADEDouble Bollinger bands
BB Deviation 1
BB Deviation 2
Price breaking below top Dev 1 band Bearish bias
Sell Stop @ 151.95
Take Profit @ 151.05
SL above breakout candle

GBPUSD 1H NEW BIG 3 INDICATOROPEN AND CLOSE SIGNALS SHOWN
ABOVE 50 EMA LONG
BELOW 50 EMA SHORT
If you have any question PM me and I will be happy to help.

QTUMBTC the price is breaking strong resistanceThere was a significant impulse growth and volume increase on 19th of March, then the coin went in the side trend for about a month and has met the lower edge of Ichi cloud which is formed by a green line. Moreover, triangle finishes at this point. Indicators are positive volume is increasing and it seems that the price is ready to break through this strong resistance. This will start another impulse growth to the upper edge of Ichi cloud and a quick break through it till our targets.

SWING TRADING STRATEGY THAT WORKSStep 1 Wait for the price to touch the Lower Bollinger Band
The first element we want to see for our simple trading strategy is that we need to see price moving into oversold territory. Any swing trading strategy that works should have this element incorporated.
Note The preferred time frame for this simple swing trading strategy is the 4h time frame, but the strategy can be used on the daily and weekly time frame as well.
Step 2 Wait for the price to Break above the Middle Bollinger Bands
After we touched the lower Bollinger Band, we want to see confirmation that we indeed are in oversold territory and the market is about to reverse. The logical filter, in this case, is to look after a break above the middle Bollinger Band.
This break above middle Bollinger Bands is a clear signal in the shift in market sentiment.
We at Trading Strategy Guides don’t trade breakouts without disseminating weather or that there are real buyer/sellers – in our case, buyers – behind the breakout which brings to the next step of our simple swing trading strategy.
Step 3 Swing Trading Indicator: The Breakout Candle needs to big a Big Bold Candle that closes near the High Range of the Candlestick Buy at the Close of the Breakout Candle
So far our favorite swing trading indicator has correctly predicted this buy-off, but we’re going to use a very simple candlestick based method for our entry trigger. In this regard, we want to see a big bold bearish candle that breaks above the middle Bollinger Band.
The second element of this candlestick based method is that we need the breakout candle to close near the high range of the candlestick. This is indicative of strong buyers, which really want to drive this currency pair much higher.
Step 4 We hide our Protective Stop Loss below the Breakout Candle
The breakout candle has a lot of significance because we’ve used it in our candlestick based entry method. We assumed that this candle shows the presence of real buyers in the market. If the low of this candle were to be broken, it’s clear enough that this is simply a fake breakout as there are no real buyers.
Step 5 Take Profit once we break and close back below the middle Bollinger Bands
In this particular case we’re looking at a long trading example. So, if the price breaks back below the middle Bollinger Banks it’s time to get worried and take our profits as it can signal a reversal.
The reason why we get profit here is quite easy to understand as we want to book the profits at the early sign the market is ready to roll over.
Note The above was an example of a BUY trad. Use the same rules – but in reverse – for a SELL trade.

