I know that since COVID, Zalando has been completely overbought.... however, I'm taking all of my profits... up over +62% since my purchase at the bottom. That's more than honorable. One must know when to say goodbye when the price is quick and significant... good luck to others.
Takeprofit

HOW TO SET TAKE PROFIT AND STOP LOSSES ON CONNECTED BROKERSOne of the best features of TradingView is all the connected brokers and how you can not only place, but also move any take profit and stop losses around on the screen to match what you are seeing on your various indicators or support levels.
Video also covers a way to gracefully exit out of a trade bit by bit if you are already up a long way and want to protect your profit by selling a little bit at a time instead of the whole lot if the price starts coming down.
It's very cool.

Nasdaq (NQ1): The Grand Finale!Nasdaq (NQ1): CME_MINI:NQ1!
Examining the Nasdaq on the daily chart, it appears we may have indeed reached the final level of the potential primary scenario Wave 3 at the 461.8% extension, which is around $18,400. Now, we should be entering a Wave 4. If we continue to rise beyond this point, we might consider an alternative scenario where there is a bit more room to extend upward before developing Wave 5 as a Wave 5 extension, possibly around $19,500, marking our maximum in this scenario.
Thus, there are two scenarios, but we primarily lean towards the scenario that we are currently experiencing Wave 3, not Wave 5. Consequently, we anticipate a downturn to at least $15,500 minimum, up to a maximum of $14,140, the subordinate Wave ((iv)) level. This is the maximum level we expect to reach with Wave 4. We should definitely see a stronger corrective movement downwards before the final impulsive Wave 5 ascends. If we begin to see the first signs of weakness, we will consider establishing short positions on shorter timeframes, but until then, we will wait and observe.

Backtesting Settings For the Logical Trading Indicator V.1Since creating the Logical Trading Indicator, my trading game has changed in a big and positive way. But I have been curious as to how I can make an automated strategy with it and how much it makes. The Logical Trading Indicator has many different signals and alerts that you can use to create your own trading strategies that work best for your trading plan.
Over the weekend, I have been tinkering around with the base strategy of buy when I get a buy signal and sell when i get a sell signal. I have played around with both a long and short strategy mainly focusing on the BTCUSD pairing. I am really doing this to help me find the best settings possible for each time frame and letting the strategy do the backtesting for me. This really helps me to figure out how it does over the past year or so. So far, at least for BTC, a LONG only strategy has yielded the best results. Mainly because I couldn't get it to fire shorts the way I wanted it to. This is where machines still need some human guidance, as well as your trades, haha.
Dialing It In
What I am doing is going into different timeframes and finding the best settings for the ATR multiple and length in combination with basis length and the long period moving average. I have been recording the results primarily on the 5 minute as well as the 1 HR and 4 HR time frames because those are the main time frames I focus on.
I have played around with different variations of functions, but TradingView can't seem to get things to fire on the strategy the same way I can get the main indicator to fire. But based on this, I set the strategy to a simple LONG only strategy where it buys when you get a BUY signal and then closes when you get a SELL signal, with the addition of a stop loss function that let's me set a stop loss percentage to provide some additional risk management to help with the drawdown percentage.
In this backtest, the strategy was not taking the 'Take Profit' signals into account, or when I tried to include them in the logic, they weren't firing properly, so I kept it simple with just the BUY and SELL signals with a stop loss. If you used the built in take profit signals, you can do even better than these results.
On the 5 minute time frame, the most profitable settings ended up being:
ATR Multiple: 3
ATR Length: 1
Basis Length: 15 EMA
Long Period Moving Average: 50 SMA
These settings yielded over 100% profit for the backtesting period, which is about a year.
For the 1 HR time frame, the winning settings were:
ATR Multiple: 3
ATR Length: 6
Basis Length: 20 EMA
Long Period Moving Average: 100 SMA
These settings yielded over 200% profit for the backtesting period with almost 60% win rate! Again, you could maximize this even more by utilizing the take profit signals and using short trades when the trend is right and if you are trading on a futures exchange. I have been doing more spot trading on DEXs lately, so I have been trading long only lately.
The Importance of Backtesting
I cannot stress this enough, you have to back test your strategies to make sure they are going to be profitable. This can be done manually by going back in time on the charts and finding all of your signals and seeing if it was profitable, or you can create your own strategy like this using TradingView's Pinescript and let the program do the backtesting for you.
However you do your backtesting, just make sure it gets done! You don't want to just think an indicator or a strategy works, you want to KNOW it works! If not, you could be throwing your money down the drain.
This is Only A Test- But Great For Info Gathering
I am only using this strategy for my own backtesting purposes, not publishing it. I simply used one part of the strategy that is built into the Logical Trading Indicator, and it honestly doesn't properly utilize multiple options for exits as far as the automated strategy goes. I know that if I use these settings, but also use my built in take profit signals, I can do much better than these results are showing.
What is great about this is you can see the performance and find trades that you wouldn't have taken in the first place, or entries and exits that could have been done better by trading manually. For example, after looking at the list of trades, I saw several trades I would have either gotten out of for better profit using the take profit signals, or trades I wouldn't have taken in the first place due to consolidation or accounting for the larger trend.
When trying to program some of the other functions from the main indicator, TradingView would freak out on me a bit and not want to provide any results, or results that just didn't make any sense. But that is all a part of the process. It helps you figure out that the machines don't always have it right, and that having just a bit of 'human' in your trades can make your performance even better than the strategy suggests!
Living That Trader Life
This is the life of a good trader, at least in my opinion. Based on my trading plan, I do not trade on the weekends, even though the crypto markets are open, it isn't always the best time to trade. I like to take this time to go over my trading journal to see where I can improve, perfect my strategies, and hone in on the things I need to work on to get better.
What this development work does for me is show me that automated trading is great, but with the combination of a great indicator that can produce trading alerts, and my own trader's intuition, I can give the markets a serious beating and come out with some amazing gains, as long as I stick to the plan, as well as trade manually with the signals! This helps me keep the emotions out of the game and let's me use the data with the correct settings to make the best decisions possible in my trades for the biggest gains! So get out there and do some backtesting on your favorite strategies to see if you really are trading logically!

NZDJPY - LONGHello all! The big bullish divergence combined with demand zone on the 1H Timeframe. After closing a big bullish candle we could have a look for a entry. Please consider this only like an idea.

GBPCHF SHORT postionAfter reaching a supply zone for the GBP may be it is time for correction. There is bearish divergence on the RSI 1H timeframe which I am thinking is going to happen. The TP zone could be the eclipse which is on the resistance zone. The other important thing is that the 200MA could be support zone which is not sure that the price will break. Do your own reasearch and please share you thoughts.

NVIDIA: Time for a breather 😮💨Let's take a closer look at Nvidia NASDAQ:NVDA – a stock generating a lot of buzz.
On the two-day chart, we observe a potential completion of Waves (3) and (4) between November 2021 and October 2022. As an alternative, we could see Waves (1) and (2), leading to the upcoming Wave (3). The targets are ambitious, and time will reveal the accuracy of these projections.
Following Wave (4) or alt. (2), we've formed a 1, 2, 3, and 4 pattern. Now, Wave 5 is on the horizon, and our price target is positioned at the 161.8 % fibonacci extension.
Zooming in, since our sub-wave 4 in red, we've constructed a Wave ((i)) and ((ii)) at $450. We're now in the process of building Wave ((iii)). A brief corrective move may follow before reaching the circled Wave ((iii)) at 161.8, around $662.
After we reach our targets, we'll be on the lookout for an entry point for the next big Wave 5 movement.

24-01-25 GBPUSD Long Entry Signal24-01-25
GBPUSD Long Entry
Entry Price: 1.26850
Stop Loss Price : 1.26450/ 40 Pips
Take Profit: 1.27450 / 60 Pips
Risk To Reward : 1 for 1.5
Trade Grade: B
Risk Entry with a wider stop loss

Mastering Stop-Loss with ATR IndicatorMastering Stop-Loss and Take-Profit with ATR Indicator
What is the ATR Indicator?
The Average True Range (ATR) indicator is a nifty tool that helps traders gauge the market's volatility. Simply, it tells you how much an asset typically moves in a given timeframe.
Placing Stop Loss to Avoid Getting Stopped Out
Step 1: Identify ATR Value
Look at the ATR indicator on your chart; it's usually at the bottom or top of your screen.
Note the ATR value; the higher it is, the more volatile the market.
Step 2: Setting Stop Loss
Set your stop loss beyond the ATR value to avoid getting prematurely stopped due to regular market fluctuations.
For instance, if the ATR is 50, consider placing your stop loss at least 60 points away to give your trade room to breathe.
Understand ATR's Role
ATR not only helps with stopping losses but also guides in setting realistic take-profit levels.
It gives you an idea of how much the asset can move in a given time, assisting you in capturing profits before a potential reversal.
Final Tips for Beginners
Adapt to Market Changes: ATR values change as market conditions shift. Stay adaptable and reassess your stop-loss and take-profit levels accordingly.
Practice on Demo Accounts: Before diving into live trading, practice using the ATR indicator on demo accounts. Gain confidence and refine your strategy without risking real money.
In essence, the ATR indicator is your ally in navigating market volatility. By using it wisely, you can enhance your risk management, safeguarding your trades from unnecessary stop-outs while optimizing your profit potential. Happy trading! 📈✨

DOTUSD LONG, entry 7.64Daily timeframe, using volume profile shows a drop to 7.6 is likely a 1.7 R:R trade seems reasonable

Taking the Guesswork Out of Take Profit: A Fibonacci Approach
In the world of trading, one of the most influential factors that can either make or break a trader is the mind. How often have we found ourselves saying, "I should have done this" or "I would have done that" after a trade has unfolded? Yet, when we were in the heat of the moment, those seemingly obvious solutions never crossed our minds. To overcome this common pitfall and make more calculated decisions when it comes to setting take profit levels, we can turn to the Fibonacci tool.
Utilizing Fibonacci retracement levels can help traders establish mechanical and consistent take profit points. This is especially crucial for mechanical traders who rely on predetermined parameters for their trading strategies. Let's delve into how you can use Fibonacci step by step to set your take profit levels, taking into consideration a buying scenario (though the process remains the same for selling, but in reverse).
**Step 1: Add -0.272 and -0.618 Levels to Your Fibonacci Tool**
Begin by adding the -0.272 and -0.618 Fibonacci retracement levels to your Fibonacci tool. These negative levels will be instrumental in creating mechanical take profit points.
**Step 2: Place Your Fibonacci Tool from Low to High**
Next, take your Fibonacci tool and place it from the low point to the high point of the relative price movement you're analyzing. This essentially helps you identify potential retracement levels within the price action.
**Step 3: Identify Negative Levels**
As you apply the Fibonacci tool, you'll notice the negative levels (-0.272 and -0.618) on your chart. These levels will suggest specific price points that you can consider for setting your take profit. Interestingly, you'll often find that prices tend to react near these negative Fibonacci levels because they represent strong psychological levels in the market.
By following these steps, you can establish a mechanical and objective approach to determine your take profit levels. This approach not only reduces the influence of emotions in your trading decisions but also provides you with a systematic way to lock in profits. Remember that while the example here focuses on buying, the process remains the same for selling, with the Fibonacci levels adjusted accordingly.
Incorporating Fibonacci retracement levels into your trading strategy can be a game-changer, helping you trade with greater discipline and consistency. The key is to trust the numbers and your predetermined plan, allowing you to make more informed trading decisions and ultimately enhance your overall trading performance.

Get Ready For A Pop Up There is a Re-Test In Progress For A Long Position…..Quick Trade And Take Profits Asap

Lookback into a Yield Seeking Analytics: EUR Hit TargetDear Investors,
Goal
I often hear: "... but I learned from my mistakes." This phrase might be a kind emote of forgiving yourself, but you can learn much more from your successes. Today, I want to write more about an example of a success because I learned from it. I want to explain what I learned from this take profit and conclude the analytics because I know most of you never return to how an analytics you read concluded. In this follow-up analytics, I'll extend the chart of the previous setup and communicate the original data I didn't specify in that analytics. I also want to have this written because some of you prefer reading over watching my videos. In the meantime, I've released an open-source indicator on TradingView, and you'll see how this indicator could have extended or contradicted the analytics.
News & Sentiment Analytics
The initial analytics started with news analytics. I believe news can overwrite technical indicators. So, I usually begin my analytics with the news. For this purpose, I wrote some natural language processing algorithms. Some of you wrote to me, that you don't believe AI can outperform humans in supply/demand location and liquidity detection. Perhaps, that's true, but the fact is, while you commit your attention to one market and limited news, AI simultaneously processes hundreds of thousands of news from thousands of news agencies. From all these data, I emphasized the following in the analytics:
"Beyond technicals, the European Central Bank (ECB) has been cautious in raising interest rates to combat inflation, in contrast to the US Federal Reserve's more aggressive tightening cycle. This divergence in monetary policies has made the USD more attractive to yield-seeking investors."
I often extend news analytics with sentiment analytics. I could have written any combination of news, but I gave one as an example where sentiment analytics estimated a heavyweight.
Technical Analytics & Chart Patterns
In the video analytics, I used daily candles because I wanted to protect your attention from intraday noise. Nevertheless, the price action happens to be smooth. So, in this idea, I used 4-hour candles to better show the projection of how the price went into the take profit area.
Once I got an idea about a possible bearish trend from news and sentiment, I added my humble technical analytics knowledge to the setup. I noted the rising channel chart pattern that statistically, often breaks downward. You find the dotted purple trendlines on the chart. Furthermore, I calculated a demand zone between the two blue trendlines. I guessed the price could seek demand somewhere in this area. That's why you saw a falling arrow in the analytics. The trendlines themselves are the results of candle analytics, which is part of my technical analytics.
Indicators
In the signal idea, you couldn't see my Adaptive MFT Extremum Pivots indicator because I released this TradingView script after my video analytics. However, this script wasn't necessary to get a profitable vision. I added it to the update to note how the level where the price managed to fall aligns with the S3 support level, and the demand zone news-sentiment-pattern estimated aligns with the zone where the supports (S1-S3) are located. You can read the precise values in the indicator's table in the bottom right corner of the chart.
Results: +2.64% ROI, -0.18% drawdown, Trail Profit
Eventually, I added date and range computing arrows to the chart to show the results. It says a +2.64% profit over 45 bars (9 days, 12 hours). You can see the timestamp of the sentiment analytics above the candles: 01 December. You can also read the sentiment analytics idea in TradingView. See the relevant ideas. I used a stop loss at $1.102. In the worst-case scenario, I'd book a -0.18% drawdown, but the price never hit the negative limit. I don't specify the future price in this idea because I moved my stop loss down to act as a trail profit until the price decides to reverse, and I booked my profit.
It's not an investment advice. I don't claim mine was the only possible setup to take a profit from the price action. Historic results don't guarantee future returns. No indicator or analytics is inherently more superb than the others. Do your research. I only hope you learned a few practices from this idea you can use in your analytics, too.
Kind regards,
Ely

BTC Price Target: $48kHow high could this COINBASE:BTCUSD pump go? FWB:48K is a solid level to exit.
There was a local low at FWB:48K in March of 2022.
The Fib retracement level .618 between the ATH of SWB:69K and cycle low of $16k is at FWB:48K
Many traders are talking about exiting at this level, which will bring selling pressure
I can understand HODLing through the ups and downs, but if you're long with leverage, 48k seems like a great place to exit a trade.
I know I just made a price prediction for $136k for Bitcoin, but I think a temporary retrace is likely. Especially if the ETF is announced, and many traders exit to take profits.
"Buy the rumor, sell the news." We are in the rumor stage, people.


AUDCAD LONG Trade ManagementI am currently long AUDCAD with +480 pips across two lots. Price has reached an untested supply zone and is also up against a 78.6 fib extension and 50.0 fib retracement level. I am going to go ahead and scale down my positions, take profit and move my stops to trail from break even. Short, medium, and long term indicators support both a strengthening Aussie and Canadian dollar, which can be a little tricky to navigate. In a perfect world you want to see one strong and/or strengthening currency against a weak and/or weakening. Thus I think it prudent to go ahead and take some dinero off the table.

1INCHUSDT.P 1H long trade at resistance5M chart allowed to enter early
Aggressive trend trade 8R
- short impulse
+ resistance level
+ biggest level T1
+ biggest level 2Sp-
+ weak test
+ below first bullish bar closed entry
Calculated affordable stop
1 to take profit (can extend to 1 to 2 of 1H if closes volumed Sp)
1H chart situation
+ long balance
+ resistance level
- expanding ICE level
1D chart context
+ long impulse
+ significant bar level

What a clear gbpusd followed our tradeHelllooooo traders I hope you are doing great we almost covered a large number of pips on our gbpusd trade enjoyyyy!

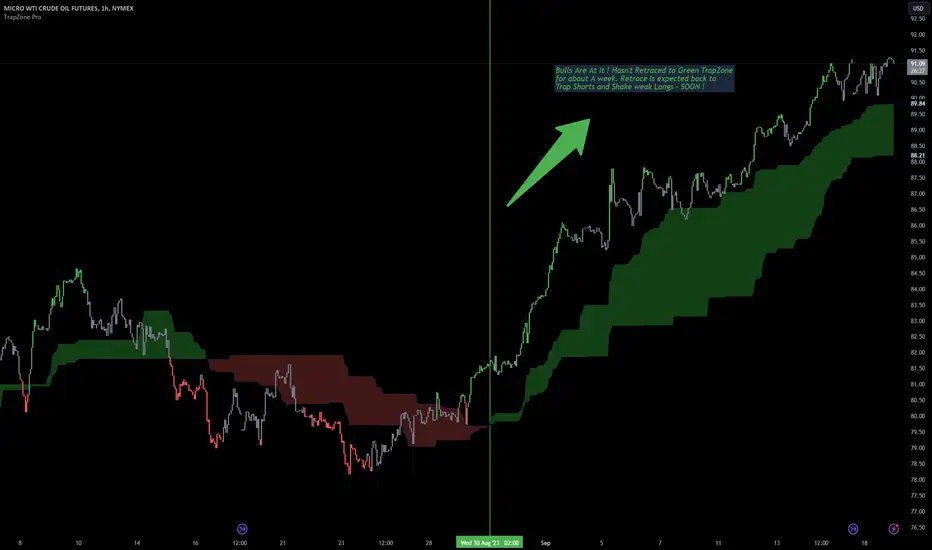
No retrace to the TrapZone ? How long is this LONG move?Bulls Are At It, Offcourse. When do you take Profits though ? Trap Bars are forming Now.
price Hasn't Retraced to Green TrapZone for about A week. Retrace Is expected back to Trap Shorts and Shake weak Longs - SOON !
Hourly Candlestick Chart of MCL/ Crude Futures with TrapZone Pro
🔹 #XAUUSD Trade Analysis Condition 1: Bearish Movement
If the price movement indicates a bearish trend, we can consider entering a short position between the entry points of 1940-1939 after a pullback. Our first take profit level (TP1) could be set between 1910-1905, while TP2, which serves as a target rather than a fixed TP, could be in the range of 1865-1860. It is crucial to identify a logical level as the stop loss (SL) to manage risk effectively.
Condition 2: Bullish Breakout
In the event of a bullish breakout above the 1905-1910 level, we should exercise caution and wait for a retracement before considering a short position. Once the price retraces to the range of 1953-1951, we can enter a short position. The same set of take profit levels mentioned earlier (TP1 and TP2) can be employed. It's important to adhere to a logical SL level to protect against potential losses.
Please note that given the current downtrend, it is advisable to avoid initiating long (buy) positions during these days. Corrections in a downtrend may provide opportunities for short positions.
Remember to conduct your own analysis and adapt the strategy based on market conditions. Trade wisely and use proper risk management techniques.
#XAUUSD #ShortPosition #BearishTrend #TakeProfit #StopLoss #TradingView

4hr BTC Seems as though we’ve broken through a few resistances. The buyers show up to support on the 4hr uptrend.
TP ~26100
SL ~25700

Bitcoin's Dance- AI's PredictionFor Bitcoin's 1hr chart, the close price surpasses the 20-period EMA, suggesting a short-term uptrend. However, it lingers below the 50-period SMA, signaling medium-term bearishness. Interestingly, the long-term outlook seems bullish with the close price above the 200-period SMA. The daily chart contrasts this: Bitcoin's close price is under all EMAs and SMAs, indicating overall bearishness. Still, both charts have an ADX above 20, hinting at a strong trend, and the CCI remains bullish. This blend of indicators presents a complex scenario.
Trade Recommendation:
Considering the indicators, a trend-following LONG trade on a 1hr timeframe seems apt:
Entry: Wait for a slight pullback and enter around 29351.96.
Take Profit (TP): Aim for the 1hr resistance at 29459.77.
Exit (Stop-Loss): Set just below the 1hr medium-term support at 29045.81.
Given the proximity of the resistance, a fixed take profit is recommended rather than a dynamic trailing stop.
Confidence Score and Explanation:
Confidence: 3/5
The trade suggestion is moderate in confidence due to the mixed signals. The 1hr chart leans towards a bullish momentum, while the daily suggests bearishness. The approach is trend-following, banking on the short-term bullish signs in the 1hr chart. Still, traders should remain alert and adhere to the set stop-loss.
