Hail Mary moment for BittensorBittensor about to enter a bear market of its own, breaking down key support levels. If it doesn't quickly reverse from here, which unfortunately seems unlikely, as it has had 2 chances to bounce,
then we are likely to go much lower.
Possible levels of interest are below.
Sad day for TAO, as just a month ago the set-up seemed bullish... how much can change over a month
TAO

TAO: Two Scenarios, One Goal.#Bittensor is a leading AI coin. Despite lagging in the recent AI rallies, I see two paths for it:
Yellow: #TAO is in its 5th wave, heading for a new ATH soon.
White: #TAO is forming a 4th wave triangle, which needs more time to stabilize before targeting a new ATH.

TAO Breakout Imminent? Watch These Crucial Levels Closely!Yello, Paradisers! Is #TAO gearing up for a powerful breakout, or are the bulls about to hit a wall? Let’s break this down step by step because this could be the turning point for TAO!
💎#TAOUSDT has reversed strongly after grabbing liquidity at lower levels, and it’s now shaping into an inverse head-and-shoulders pattern—one of the most promising bullish structures. If the breakout confirms, TAO could target the unfilled inefficiencies above. But will the bulls carry this momentum all the way?
💎Currently, TAO is testing the neckline of this pattern, with resistance sitting at the $460–$470 zone. A clean breakout and successful retest of this level as support could ignite further bullish momentum, pushing TAO toward $540–$550. This zone is critical as it holds the 61.8% Fibonacci retracement and aligns with the descending resistance, making it a significant hurdle for the bulls to conquer.
💎Should TAO break through $550, the next target lies at $620–$640—a region where the pattern target completes. However, be cautious here. This level could trigger aggressive profit-taking, and we know how markets react when the herd gets too excited.
💎On the flip side, TAO’s immediate goal is to flip the $460–$470 range into support. If this happens, it could act as a major catalyst for continued bullish momentum. If the bulls fail to hold this level, strong support lies below at the $430–$415 zone—a key area with the strength to absorb short-term selling pressure.
Patience and discipline are key here, Paradisers. The market often tests both bulls and bears before making decisive moves, so stay vigilant.
MyCryptoParadise
iFeel the success🌴

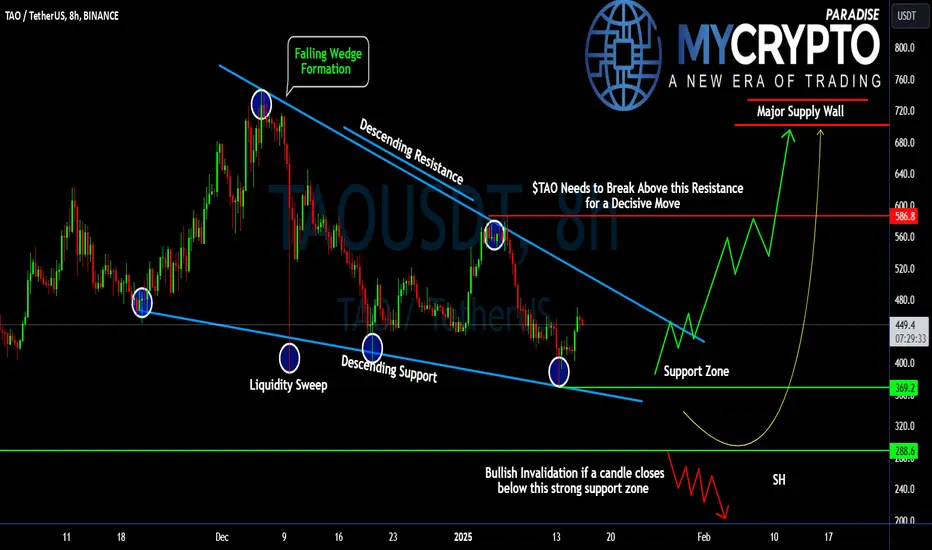
#TAO Getting Ready For a Major Bullish Move | Are You Ready?Yello, Paradisers! Will #TAOUSDT Ignite a Bullish Rally or Collapse into a Bearish Trap? Here’s What You Need to Know about the latest setup of #Bittensor:
💎#TAO is currently trading within a Falling Wedge, a classic reversal pattern that often signals a potential breakout. The price is testing critical resistance levels, and what happens next could define #TAO's trajectory for the coming weeks. Notice the recent liquidity sweeps at lower levels, where weak hands were shaken out. This is often a precursor to a significant move. However, without confirmation of a breakout above resistance, patience is key.
💎#TAOUSD must break above the descending resistance near $586.8 for a decisive bullish move. A strong close above this level on the 8H chart could propel the price toward the major supply zone at $680–$720. These levels will be critical for profit-taking or managing risk.
💎On the downside, the current support sits between $369.2 and $288, offering a strong demand area where buyers have consistently stepped in. The Bulls have defended these levels many times and a lot of liquidity rests between these two levels.
💎A candle close below $288 would signal that the bears are firmly in control. This breakdown could open the door to a deeper correction, targeting $200 in extreme bearish scenarios.
Stay focused, patient, and disciplined, Paradisers🥂
MyCryptoParadise
iFeel the success🌴
TAO Bittensor Bullish Chart prediction 2025TAO Bittensor
TAO is the safest high-cap AI gem out there. Any price below $430 is good for the long term if you missed 220 train.
Future Potential: Bittensor's TAO leverages artificial intelligence (AI) to enhance blockchain efficiency and scalability. As AI technology advances, TAO could revolutionize how data is processed and managed on the blockchain.
Latest News: Bittensor's TAO Recognized for Groundbreaking AI Integration
Grayscale Investments has rebalanced its Digital Large Cap Fund, now allocating 90% to Bitcoin and Ethereum, with the remaining 10% divided among XRP, Solana, and newly added Cardano, replacing Avalanche.
The reshuffle was influenced by the CoinDesk Large Cap Select Index, reflecting Cardano's 75% rally over the past year compared to Avalanche's stagnant performance.
In the GSCPxE Fund, which excludes Ethereum, Solana and Cardano dominate with a 75% weighting, while Sui has been introduced with an 8% allocation, alongside Avalanche, NEAR Protocol, and Polkadot.
The AI Fund has diversified its holdings, with NEAR Protocol at 30%, followed by Render, Bittensor, Filecoin, and The Graph, and a new 2.8% allocation to Livepeer.
Grayscale's Decentralized Finance Fund has replaced Synthetix with Curve, maintaining a strong focus on Uniswap and Aave.
The company aims to convert its Digital Large Cap Fund and Solana Trust into ETFs, anticipating a favorable regulatory environment under the SEC.

TAO roadmap (12H)It seems that TAO is forming an expanding triangle, currently in wave D of this triangle.
Wave D appears to have itself formed an expanding triangle (inverse expanding triangle).
It is expected that wave e of D will complete within the green zone.
From the green zone, it can move towards its targets.
A daily candle closing below the invalidation level would invalidate this analysis.
For risk management, please don't forget stop loss and capital management
Comment if you have any questions
Thank You

cheaper TAO soon? Short timeframe bearish scenarioThat thing is too long for a bull flag now
and therefore a bearish scenario is forming (medium confidence)
support lines are complicated
therefore a box
with its higher and lower levels of interest
marked in white lines
mild bearish shows us visiting 480s levels
mid bearish maybe around 440s levels
good places to grab some cheap TAO
as Long term scenario we are very bullish as per analysis

#TAO/USDT Ready to go up#TAO
The price is moving in a descending channel on the 1-hour frame and sticking to it well
We have a bounce from the lower limit of the descending channel, this support is at 435
We have a downtrend on the RSI indicator that is about to break, which supports the rise
We have a trend to stabilize above the moving average 100
Entry price 447
First target 469
Second target 482
Third target 500

TAO SWING LONG IDEA I know everyone is fearful in the crypto market right now.
People are scared to buy at these lows because they believe Bitcoin will likely continue to decline. And yes, that could happen. But guess what?
BTC is sitting on daily support.
BTC dominance hit 60% and is possibly forming lower highs (check my BTC DOM analysis).
The Fear Index is at 54—people are scared.
Funding rates are extremely negative.
Most assets' RSI levels are oversold (in a bull market!).
All these factors tell me it’s the perfect time to open swing long positions while everyone else is panicking and selling their coins at the lows.
Let’s take TAO as an example:
We’ve hit a key SR level.
The election swing lows have been raided.
A 4H bullish HTF shift has occurred—this is my confirmation.
Entry: $455
SL: $355 (closing daily below)
TP: ATH - $750
Good luck! And remember: buy when they’re scared, and sell when they’re greedy.
-AS ALWAYS, MANAGE YOUR RISK-

TAOUSDT, The only setup you need. TAOUSDT / 1D
Hello Traders, welcome back to another market breakdown.
The utility coins market shows strong bullish momentum in the current Crypto cycle, breaking through key resistance levels and signaling a potential continuation to the upside. However, instead of jumping in at current levels, I recommend waiting for confirmation into the breakout zone for a more strategic entry.
If the pullback holds and buying confirms, the next leg higher could target:
1- Mid of the range
2- Higher quarter
3- New all-time high
Stay disciplined, wait for the market to come to you, and trade with confidence!
Trade safely,
Trader Leo.

TAOBOT bouncing from my boxTAOBOT bouncing from my box. This coin can fly once TAO reaches new all time high

TAOBOT - Flip this and higher!TAOBOT flip this and it will go higher. Im already in. This coin has lots of potential once TAO starts pumping. 5x from here is fud.

TAO USD breakdown confirmed. Bad days ahead for BittensorKey support line broken for TAO and onward movement has a lot of thin air from prior rapid price up movement. Good opportunity to short TAO. The only thing that could invalidate it would be big buy-in by whales. If that fails to happen, TAO is likely awaiting a big downward move for the foreseeable future

TAO - Don't Underestimate it!Hello TradingView Family / Fellow Traders. This is Richard, also known as theSignalyst.
📈TAO has been bullish , trading within the wedge pattern in blue.
Currently, TAO is in a correction phase approaching the lower bound of the wedge.
Moreover, the $500 is a strong round number!
🏹 Thus, the highlighted blue circle is a strong area to look for buy setups as it is the intersection of support and lower trendline acting as non-horizontal support.
📚 As per my trading style:
As #TAO is around the blue circle, I will be looking for bullish reversal setups (like a double bottom pattern, trendline break , and so on...)
📚 Always follow your trading plan regarding entry, risk management, and trade management.
Good luck!
All Strategies Are Good; If Managed Properly!
~Rich

TAOUSDT Cup And Handle PatternTAOUSDT Technical analysis update
BINANCE:TAOUSDT has formed a cup and handle pattern on the daily chart. With high volume, the price has broken above the neckline resistance, signaling a potential strong bullish move in the coming days.
Buy zone : Below $720
Stop loss : $560
Take Profit 1: $855
Take Profit 2: $1100
Take Profit 3: $1500

Alikze »» Rose | Ascending corner pattern🔍 Technical analysis: Ascending corner pattern
- In the daily time frame, in an ascending channel, according to the predicted path, it has grown up to 1.618 fibo of the previous wave, a range of 0.17.
- In the last analysis presented in the 4H time frame in an ascending channel, after breaking the channel and exiting it and breaking the zone, it experienced a correction.
- In the daily time frame, it has had a complete upward cycle, and wave 3 has grown as much as 1.618 of the previous wave.
- At the moment, correction is done as much as 0.23 fibo of the whole structure.
- A corner pattern has been formed which can grow up to the supply area by breaking the 0.072 area.
🛑 The most important resistance: ~ 0.072
💎 NOTE: In addition, if the 0.23 area breaks and stabilizes below it, the bullish scenario will be invalidated.
»»»«««»»»«««»»»«««
Please support this idea with a LIKE and COMMENT if you find it useful and Click "Follow" on our profile if you'd like these trade ideas delivered straight to your email in the future.
Thanks for your continued support.
Best Regards,❤️
Alikze.
»»»«««»»»«««»»»«««
BINANCE:ROSEUSDT

IHS for TAO USD bullish continuationthis chart which shows a H&S pattern on Bittensor TAO suggests further downward movement on the inverse (i.e. growth of TAO in USD terms)

TAO/USDT: Potential 2x Move in the Making!🌟 Hey everyone! 👋
If you’re finding value in this analysis, don’t forget to smash that 👍 and follow for more high-value trade setups! 💹
🔍 Technical Overview:
TAO is looking incredibly strong! It’s breaking out of a cup and handle-like pattern on the daily time frame, and the current retest of the neckline makes it a prime opportunity for entry. This setup suggests a high probability of a 2x move, making it a must-watch! 📈
💡 Entry Strategy:
Entry Range: CMP (Current Market Price) and add more up to $600.
Targets: $900 / $1,200 / $1,600 / $2,000
Stop-Loss: $540 (Set tight for risk management).
Leverage: Spot or low leverage (Max 3x for risk control).
📖 Fundamentals of TAO Token:
TAO is the native token of the Lamina1 blockchain, a project co-founded by Neal Stephenson, the creator of the term "Metaverse." Lamina1 is purpose-built to power the Open Metaverse economy, providing developers and creators with the tools to build decentralized, immersive experiences.
Key Use Cases of TAO:
1️⃣ Powering the Lamina1 ecosystem.
2️⃣ Facilitating transactions and smart contracts within the Open Metaverse.
3️⃣ Incentivizing developers and creators on the blockchain.
💬 What’s your take on TAO’s setup? Are you spotting the same breakout potential, or do you have a different perspective? Drop your thoughts and analysis in the comments below, and let’s crush this trade together! 🚀🔥

#TAO/USDT Ready to go up#TAO
The price is moving in a descending channel on the 1-hour frame and sticking to it well
We have a bounce from the lower limit of the descending channel, this support is at 638
We have a downtrend on the RSI indicator that is about to break, which supports the rise
We have a trend to stabilize above the moving average 100
Entry price 651
First target 661
Second target 673
Third target 686

Is TAOUSDT Ready to Skyrocket? The 250% Opportunity Awaits!The big picture is coming together for TAOUSDT, and it’s looking explosive! Let’s break down this visually stunning setup that could catapult this asset by an incredible 250%. Are you ready to ride this wave? Here’s why this could be a game-changing breakout:
1️⃣ The Perfect Rounded Bottom Formation
The chart paints a classic rounded bottom, a powerful bullish reversal pattern.
Key Support Zone : TAOUSDT built a solid foundation within the support area, tested multiple times for strength.
Steady Volume Accumulation: The increasing volume during the base formation hints at smart money quietly entering the market.
This setup signals that momentum is building, and the next leg up is in sight.
2️⃣ Breakout from the Bullish Flag
After the rounded bottom, the market formed a bullish flag, a textbook continuation pattern. This flag represents a brief consolidation phase, preparing for the next explosive move upward.
Volume Surge : Notice how volume spiked at the breakout point? That’s confirmation of buyer interest stepping in.
Momentum Reset : The consolidation allowed TAOUSDT to cool off, priming for a much bigger move ahead.
3️⃣ The Target: A Staggering 250% Move
The measured move projection for this breakout is 1,800$, representing a massive 250% gain from current levels. With the pattern's precision and volume confirmation, this target becomes a realistic possibility.
Here’s why this move could be the real deal:
✅ Rounded bottom = trend reversal signal.
✅ Bullish flag = continuation of momentum.
✅ Exceptional volume = confirmation of strength.
4️⃣ What Traders Should Watch For
💡 Key Support Zone: If the price retests the green support area around 470-500, it could offer a golden entry opportunity.
💡 Breakout Continuation: A clean break above the recent highs of around 640 will confirm that the momentum is intact.
💡 Volume Spike: Sustained volume will fuel this potential 250% rally.
Conclusion: A Bullish Wave is Loading! 🌊
The TAOUSDT chart is screaming opportunity, with a rounded bottom, a bullish flag, and exceptional volume setting the stage for a parabolic move. With a 250% target on the horizon, now is the time to stay sharp and capitalize on this explosive setup.
🚨 Don’t just watch the move – position yourself for it. TAOUSDT is ready to make history. Are you? 🚨

$TAO AI SEASON LEADAI will lead the crypto to new level of adaption as it is given since the first run.
all tech integrates A.I soon and its inevitable.
everything will run on it.

TAOUSD - Bullish Temporary Chart shows a sort of inverted H&S structure
I see the right shoulder providing an escape from this bear point out of an inverted H&S
We are in a bull market regardless
First time ive looked at this coin but I do think all coins will pump during this alt run
Daily chart

Bittensor (TAO)📊 General Overview of the Analysis
TAO coin, after being listed, initially moved downward within a descending channel. Upon breaking out above the channel, the price experienced an upward rally to its previous peak but then entered another descending channel.
🕰 Daily Timeframe Analysis
🔸 Current Status: After the upward movement, the price has entered a consolidation range (yellow zone).
🔸 Fake Move: The drop below this range suggests seller weakness.
🔸 Forecast: Breaking above the yellow zone could propel TAO to higher levels.
⏰ 4-Hour Timeframe Analysis
🔹 After rebounding from the top of the descending channel, the price responded positively to the midline and rose again.
🔹 Expected Movement: There’s potential for breaking out of the descending channel from the top.
🔹 Suggested Entry Point:
A confirmed price stabilization above the red zone can signal a secure entry.
🎯 Price Targets (Fibonacci Levels)
🔹 1.618
🔹 2.618
📈 RSI Indicator Analysis
🔸 On the daily timeframe, RSI is positioned in an ascending channel.
🔸 Forecast: A breakout above the midline of this ascending RSI channel could offer an early entry signal for TAO.
📝 Conclusion and Final Note
Technical analysis indicates that TAO has significant potential for further upward movement. Stabilization above the red zone and movement toward Fibonacci targets highlight the coin's appeal for long-term trades.
💡 Advice: Always employ risk management and incorporate your personal analysis into decision-making.
💡 Reminder: This analysis is for educational purposes only and should not be considered as financial advice.
