AUDCAD: Will Start Falling! Here is Why:
Looking at the chart of AUDCAD right now we are seeing some interesting price action on the lower timeframes. Thus a local move down seems to be quite likely.
Disclosure: I am part of Trade Nation's Influencer program and receive a monthly fee for using their TradingView charts in my analysis.
❤️ Please, support our work with like & comment! ❤️
Target

GOLD: Long Signal Explained
GOLD
- Classic bullish formation
- Our team expects pullback
SUGGESTED TRADE:
Swing Trade
Long GOLD
Entry - 3396.6
Sl - 3389.4
Tp - 3413.3
Our Risk - 1%
Start protection of your profits from lower levels
Disclosure: I am part of Trade Nation's Influencer program and receive a monthly fee for using their TradingView charts in my analysis.
❤️ Please, support our work with like & comment! ❤️

APPLE: Long Signal with Entry/SL/TP
APPLE
- Classic bullish pattern
- Our team expects retracement
SUGGESTED TRADE:
Swing Trade
Buy APPLE
Entry - 196.46
Stop - 192.63
Take - 203.97
Our Risk - 1%
Start protection of your profits from lower levels
Disclosure: I am part of Trade Nation's Influencer program and receive a monthly fee for using their TradingView charts in my analysis.
❤️ Please, support our work with like & comment! ❤️

USDCHF: Bullish Continuation & Long Signal
USDCHF
- Classic bullish setup
- Our team expects bullish continuation
SUGGESTED TRADE:
Swing Trade
Long USDCHF
Entry Point - 0.8113
Stop Loss - 0.8074
Take Profit - 0.8182
Our Risk - 1%
Start protection of your profits from lower levels
Disclosure: I am part of Trade Nation's Influencer program and receive a monthly fee for using their TradingView charts in my analysis.
❤️ Please, support our work with like & comment! ❤️

EURUSD: Bearish Continuation is Highly Probable! Here is Why:
Remember that we can not, and should not impose our will on the market but rather listen to its whims and make profit by following it. And thus shall be done today on the EURUSD pair which is likely to be pushed down by the bears so we will sell!
Disclosure: I am part of Trade Nation's Influencer program and receive a monthly fee for using their TradingView charts in my analysis.
❤️ Please, support our work with like & comment! ❤️

NATGAS: Market of Sellers
Balance of buyers and sellers on the NATGAS pair, that is best felt when all the timeframes are analyzed properly is shifting in favor of the sellers, therefore is it only natural that we go short on the pair.
Disclosure: I am part of Trade Nation's Influencer program and receive a monthly fee for using their TradingView charts in my analysis.
❤️ Please, support our work with like & comment! ❤️

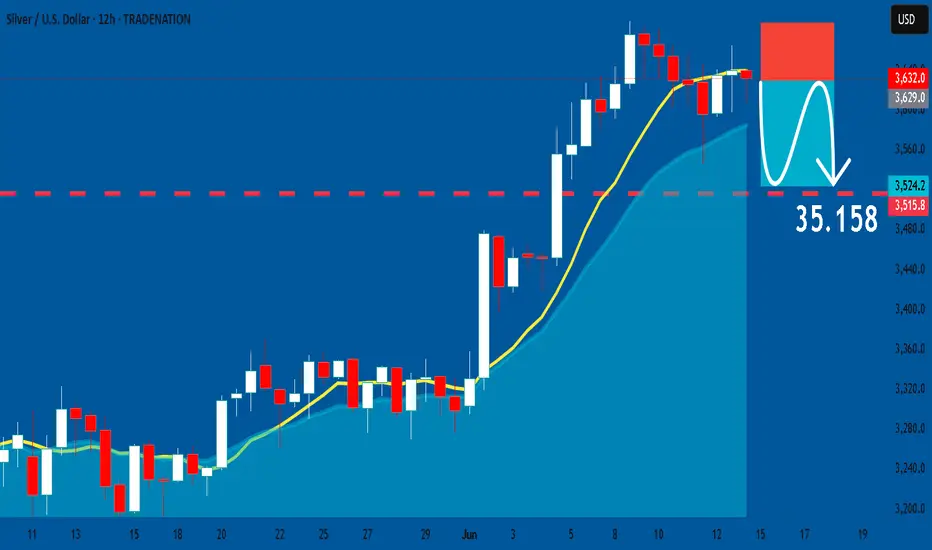
SILVER: Short Trade Explained
SILVER
- Classic bearish setup
- Our team expects bearish continuation
SUGGESTED TRADE:
Swing Trade
Short SILVER
Entry Point - 36.320
Stop Loss - 36.874
Take Profit - 35.158
Our Risk - 1%
Start protection of your profits from lower levels
Disclosure: I am part of Trade Nation's Influencer program and receive a monthly fee for using their TradingView charts in my analysis.
❤️ Please, support our work with like & comment! ❤️
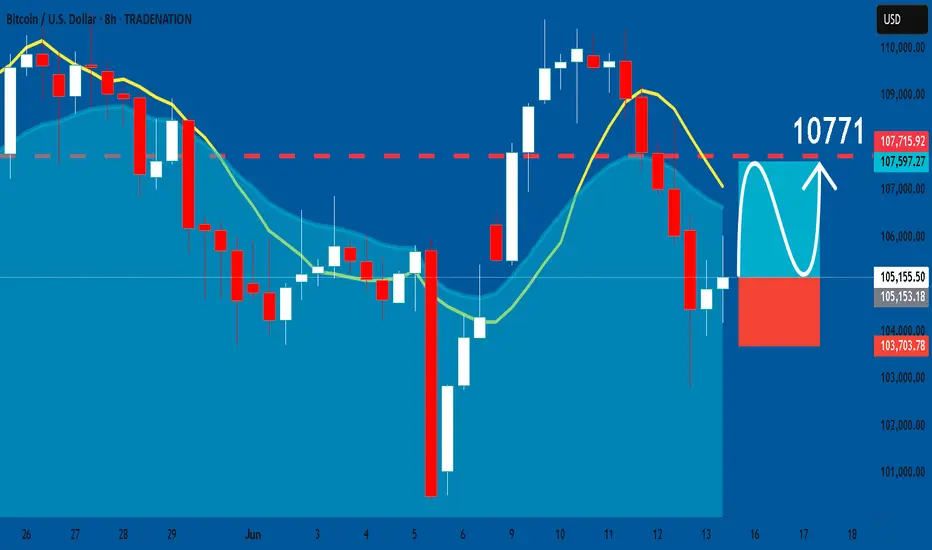
BTCUSD: Long Trading Opportunity
BTCUSD
- Classic bullish formation
- Our team expects growth
SUGGESTED TRADE:
Swing Trade
Buy BTCUSD
Entry Level - 10515
Sl - 10370
Tp - 10771
Our Risk - 1%
Start protection of your profits from lower levels
Disclosure: I am part of Trade Nation's Influencer program and receive a monthly fee for using their TradingView charts in my analysis.
❤️ Please, support our work with like & comment! ❤️
GBPNZD: Bears Will Push Lower
The charts are full of distraction, disturbance and are a graveyard of fear and greed which shall not cloud our judgement on the current state of affairs in the GBPNZD pair price action which suggests a high likelihood of a coming move down.
Disclosure: I am part of Trade Nation's Influencer program and receive a monthly fee for using their TradingView charts in my analysis.
❤️ Please, support our work with like & comment! ❤️

SPY: Expecting Bullish Movement! Here is Why:
The analysis of the SPY chart clearly shows us that the pair is finally about to go up due to the rising pressure from the buyers.
Disclosure: I am part of Trade Nation's Influencer program and receive a monthly fee for using their TradingView charts in my analysis.
❤️ Please, support our work with like & comment! ❤️

GBPCHF: Long Trade Explained
GBPCHF
- Classic bullish formation
- Our team expects pullback
SUGGESTED TRADE:
Swing Trade
Long GBPCHF
Entry - 1.1005
Sl - 1.0971
Tp - 1.1064
Our Risk - 1%
Start protection of your profits from lower levels
Disclosure: I am part of Trade Nation's Influencer program and receive a monthly fee for using their TradingView charts in my analysis.
❤️ Please, support our work with like & comment! ❤️

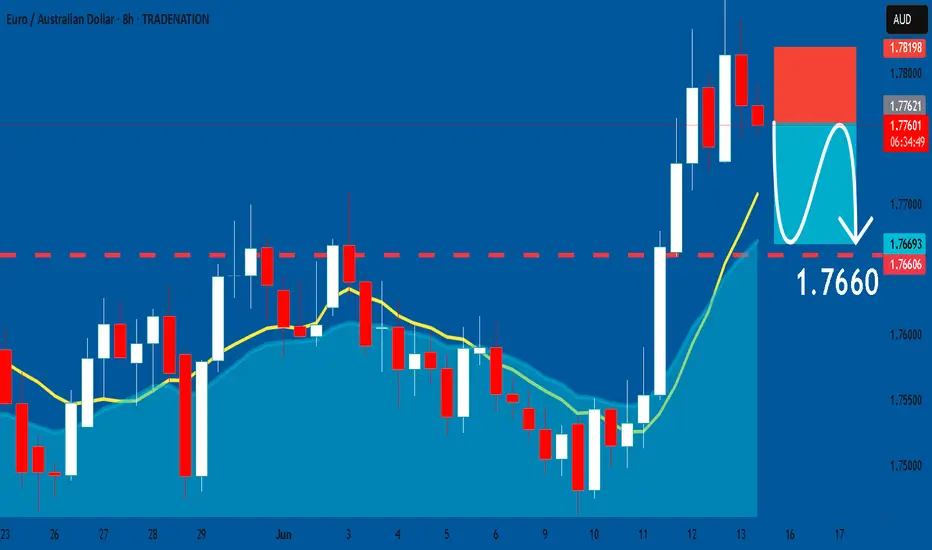
EURAUD: Bearish Continuation & Short Trade
EURAUD
- Classic bearish formation
- Our team expects fall
SUGGESTED TRADE:
Swing Trade
Sell EURAUD
Entry Level - 1.7760
Sl - 1.7819
Tp - 1.7660
Our Risk - 1%
Start protection of your profits from lower levels
Disclosure: I am part of Trade Nation's Influencer program and receive a monthly fee for using their TradingView charts in my analysis.
❤️ Please, support our work with like & comment! ❤️
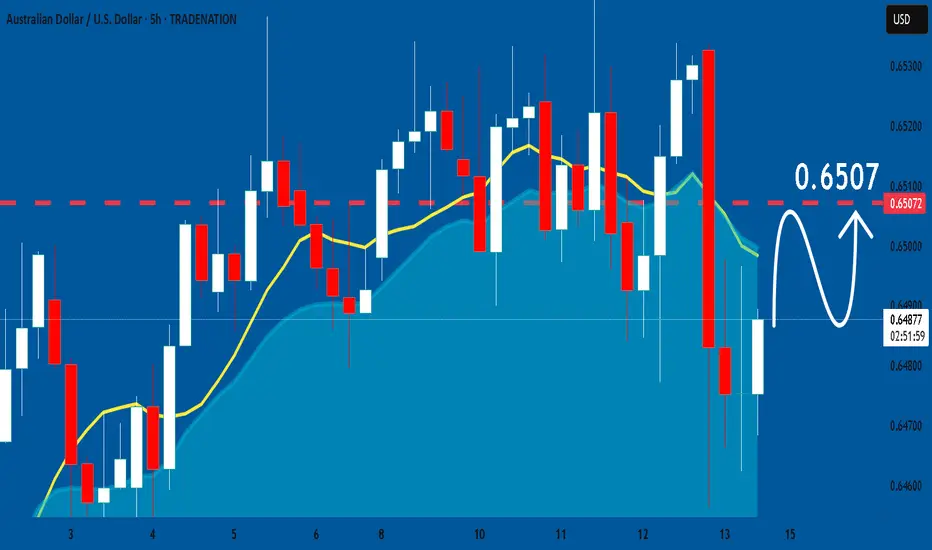
AUDUSD: Market Sentiment & Price Action
Looking at the chart of AUDUSD right now we are seeing some interesting price action on the lower timeframes. Thus a local move up seems to be quite likely.
Disclosure: I am part of Trade Nation's Influencer program and receive a monthly fee for using their TradingView charts in my analysis.
❤️ Please, support our work with like & comment! ❤️
EURUSD: Bulls Will Push Higher
Remember that we can not, and should not impose our will on the market but rather listen to its whims and make profit by following it. And thus shall be done today on the EURUSD pair which is likely to be pushed up by the bulls so we will buy!
Disclosure: I am part of Trade Nation's Influencer program and receive a monthly fee for using their TradingView charts in my analysis.
❤️ Please, support our work with like & comment! ❤️

EURNZD: Short Signal with Entry/SL/TP
EURNZD
- Classic bearish formation
- Our team expects pullback
SUGGESTED TRADE:
Swing Trade
Short EURNZD
Entry - 1.9145
Sl - 1.9218
Tp - 1.9021
Our Risk - 1%
Start protection of your profits from lower levels
Disclosure: I am part of Trade Nation's Influencer program and receive a monthly fee for using their TradingView charts in my analysis.
❤️ Please, support our work with like & comment! ❤️

AUDCHF: Growth & Bullish Forecast
Balance of buyers and sellers on the AUDCHF pair, that is best felt when all the timeframes are analyzed properly is shifting in favor of the buyers, therefore is it only natural that we go long on the pair.
Disclosure: I am part of Trade Nation's Influencer program and receive a monthly fee for using their TradingView charts in my analysis.
❤️ Please, support our work with like & comment! ❤️

NZDUSD: Bearish Forecast & Outlook
The price of NZDUSD will most likely collapse soon enough, due to the supply beginning to exceed demand which we can see by looking at the chart of the pair.
Disclosure: I am part of Trade Nation's Influencer program and receive a monthly fee for using their TradingView charts in my analysis.
❤️ Please, support our work with like & comment! ❤️

GOLD: Short Signal Explained
GOLD
- Classic bearish pattern
- Our team expects retracement
SUGGESTED TRADE:
Swing Trade
Sell GOLD
Entry - 3384.7
Stop - 3393.2
Take - 3368.8
Our Risk - 1%
Start protection of your profits from lower levels
Disclosure: I am part of Trade Nation's Influencer program and receive a monthly fee for using their TradingView charts in my analysis.
❤️ Please, support our work with like & comment! ❤️

USDJPY: Short Trade with Entry/SL/TP
USDJPY
- Classic bearish setup
- Our team expects bearish continuation
SUGGESTED TRADE:
Swing Trade
Short USDJPY
Entry Point - 145.34
Stop Loss - 146.15
Take Profit - 144.07
Our Risk - 1%
Start protection of your profits from lower levels
Disclosure: I am part of Trade Nation's Influencer program and receive a monthly fee for using their TradingView charts in my analysis.
❤️ Please, support our work with like & comment! ❤️

GBPAUD: Bullish Continuation & Long Trade
GBPAUD
- Classic bullish setup
- Our team expects bullish continuation
SUGGESTED TRADE:
Swing Trade
Long GBPAUD
Entry Point - 2.0740
Stop Loss - 2.0699
Take Profit - 2.0833
Our Risk - 1%
Start protection of your profits from lower levels
Disclosure: I am part of Trade Nation's Influencer program and receive a monthly fee for using their TradingView charts in my analysis.
❤️ Please, support our work with like & comment! ❤️

CADJPY: Expecting Bearish Movement! Here is Why:
Our strategy, polished by years of trial and error has helped us identify what seems to be a great trading opportunity and we are here to share it with you as the time is ripe for us to sell CADJPY.
Disclosure: I am part of Trade Nation's Influencer program and receive a monthly fee for using their TradingView charts in my analysis.
❤️ Please, support our work with like & comment! ❤️

EURUSD: Bears Will Push
The recent price action on the EURUSD pair was keeping me on the fence, however, my bias is slowly but surely changing into the bearish one and I think we will see the price go down.
Disclosure: I am part of Trade Nation's Influencer program and receive a monthly fee for using their TradingView charts in my analysis.
❤️ Please, support our work with like & comment! ❤️

$Eth Breaks Key Resistance! Is $4100 Coming Next? Ethereum has officially broken above its previous resistance at $2900 and is now aiming for the critical $3000 psychological level. Here's a step-by-step breakdown of what to expect next, including MACD, RSI signals, and CPI data impact.
🔹 Step 1: Breakout Confirmation
Ethereum has successfully broken above the $2900 resistance level — this area is now acting as immediate support.
🔹 Step 2: Next Short-Term Target – $3000
ETH is expected to hit the round number resistance at $3000, which is the next major level to watch. This is the first price target.
🔹 Step 3: MACD & Stochastic RSI Support Bullish Move
MACD is crossing to the bullish side, showing increasing momentum.
Stochastic RSI is also favoring bullish continuation — indicating a likely move to $3000 and beyond.
🔹 Step 4: Possible Rejection Zones
If ETH faces rejection near $3000 or $3500, especially if Bitcoin shows weakness or stalls, expect a pullback.
🔹 Step 5: Target 2 – $4100 if Breakout Continues
If ETH convincingly breaks above $3000 and sustains momentum, $4100 becomes the next major target. This level aligns with the previous high and potential macro continuation.
🔹 Step 6: Watch CPI Data Impact
A positive CPI reading will strengthen bullish sentiment and help ETH push toward $4100.
A negative CPI surprise might trigger a reversal — but even in that case, a short-term hit of $3000 remains likely.
Key Levels to Watch:
Support: $2900, $2800
Resistance: $3000 (Target 1), $3500 (Interim), $4100 (Target 2)
Ethereum's price structure looks bullish above $2900, supported by technical indicators and macro optimism. The $3000 level is within reach, and if momentum continues, $4100 is the next upside target. Keep an eye on BTC behavior and CPI release for confirmation or reversal signals.
