BTC / USDT 15M SHORTHello everyone, let's take a look at the BTC to USDT chart over the 15 minute timeframe. As you can see, the price is moving below the local uptrend line.
Let's start with the designation of the support line and as you can see the first support in the near future is $ 24,325, if the support breaks down, the next support is $ 24,203 and $ 24,091.
Now let's move from the resistance line as you can see the first resistance is $ 24,412, if you can break it the next resistance will be $ 24,464, $ 24,511 and $ 24,554.
Looking at the CHOP indicator, we can see that we have a lot of energy in the 15-minute interval, while the MACD indicator shows a local downward trend.
Targets

BNB/USDT targets and stoploss - SHORTHello everyone, let's take a look at the 15M BNB to USDT chart as you can see the price is moving above the local uptrend line.
Let's start by setting goals for the near future that we can consider:
T1 - $ 266
T2 - $ 267
T3 - $ 268
T4 - $ 270
and
T5 - $ 271
Now let's move on to the stop loss in case of further market declines:
SL1 - $ 261
SL2 - $ 257
SL3 - $ 253
SL4 - $ 247
and
SL5 - $ 240
Looking at the CHOP indicator, we can see that in the 15-minute interval we are gaining more and more energy, and the MACD indicator indicates a change in the trend.

15M Interwal - SOL/USDT - Targets and StoplossHello everyone, let's take a look at the 15M SOL to USDT chart as you can see the price has broken the local downtrend line and is now back right on top of it.
Let's start by setting goals for the near future that we can consider:
T1 - $ 39.58
T2 - $ 41.05
T3 - $ 42.58
T4 - $ 44.65
and
T5 - $ 47.40
Now let's move on to the stop loss in case of further market declines:
SL1 - $ 39.01
SL2 - $ 38.16
SL3 - $ 37.52
SL4 - $ 36.79
and
SL5 - $ 35.91
Looking at the CHOP indicator, we can see that the energy has been used up on the 15-minute interval, and the MACD indicator shows a local upward trend.

ETH rebounds after the last correction!Hello everyone, let's take a look at the 4H ETH to USDT chart as you can see the price is moving in the uptrend channel.
Let's start by setting goals for the near future that we can consider:
T1 - $ 1,679
T2 - $ 1,898
and
T3 - $ 2,175
Now let's move on to the stop loss in case of further market declines:
SL1 - $ 1,478
SL2 - $ 1,366
SL3 - $ 1272
SL4 - $ 1178
and
SL5 - $ 1,049
Looking at the CHOP indicator, we can see that in the 4H range, the energy we recovered was used for growth, while the MACD indicator clearly confirmed the change in the local trend.

GST is falling after the last huge spike!Hello everyone, let's take a look at the 1H GST to USDT chart as you can see the price is moving below the local downtrend line.
Let's start by setting goals for the near future that we can consider:
T1 - $ 0.0783
T2 - $ 0.0895
T3 - $ 0.0989
T4 - $ 0.1078
and
T5 - $ 0.1205
Now let's move on to the stop loss in case of further market declines:
SL1 - $ 0.0552
SL2 - $ 0.0523
SL3 - $ 0.0450
SL4 - $ 0.0370
and
SL5 - $ 0.0330
Looking at the CHOP indicator, we can see that in the 1H range most of the energy has been used, while the MACD indicator shows that we are continuing the downward trend.

Will CAKE in pair BTC beat its goals?Hello everyone, let's take a look at the 1D CAKE to BTC chart as you can see the price is moving in the local uptrend channel.
Let's start by setting goals for the near future that we can consider:
T1 - 0.0001561
T2 - 0.0001664
T3 - 0.0001768
and
T4 - 0.0001915
Now let's move on to the stop loss in case of further market declines:
SL1 - 0.0001463
SL2 - 0.0001407
SL3 - 0.0001326
and
SL4 - 0.0001225
Looking at the CHOP indicator, we can see that we have a lot of energy in the 1-day interval, and in the MACD indicator we see that the blue line is approaching the red cross from below, which would confirm the upward trend.

ETH just ahead of the $ 1,679 target!Hello everyone, let's take a look at the 1D ETH to USDT chart as you can see the price is moving above the local downtrend line.
Let's start by setting goals for the near future that we can consider:
T1 - 1679$
T2 - 1898$
and
T3 - 2175$
Now let's move on to the stop loss in case of further market declines:
SL1 - $ 1,452
SL2 - $ 1,345
SL3 - $ 1,257
SL4 - $ 1167
and
SL5 - $ 1,038
Looking at the CHOP indicator, we can see that in the 1D range, energy has been used and the MACD indicator shows the local upward trend.

BITCOIN Analysis - Targets and critical areas Okay, so when markets are undecided it's okay to be unsure yourself, in terms of direction. I think this is a great example of to plan for either direction based on what the chart is telling us. All we can do is have scenario A and B, all the while marking critical points of interest.
Scenario A - My TA here may look messy but is simple, there is a range that formed from June 18th and we have broken out to the upside of it's high at 21,685 and should now act as support. Further, we've temporarily broken a lower time frame order block (big green box) that gives a larger area of interest. Personally I'm fine if we play around in here as long as we hold the range high level. If we achieve this, I see Bitcoin reaching as far as 28k and possibly 30-31k.
Scenario B - We lose the range high and come back inside to, likely, the low at 19.5k area where if we hold that, would be a good area to long back up to the range high at 22k. If we lose the range low and lower green order block at 19.5k (wicks are okay), then I think we visit new lows.
I do not know which scenario will happen (nobody does, don't be fooled), but as far as what the chart currently tells us, it's that we have found fresh support at 21,685 area and if we hold it there's no reason to be bearish. Tomorrow we could wake up and see a power move up or down, perhaps you're long and want to hedge with a short or vice versa. Trick is to wait until we get into an area of support or resistance to do so, not in-between where you can easily be stopped out.
Adam and Eve formation is on the chart as well that I shared some time ago, but as we move away from it on the timeline the less significant it becomes. It's neckline is really close to our range high, so I've kept it on the chart for the time being but I'm really paying attention to the levels of the range.
Be fine with either direction by planning for both, don't bet more than you're willing to lose, use stop losses or hedge your positions and you will sleep much better at night.
Stay frosty folks.
V
BTC Bitcoin

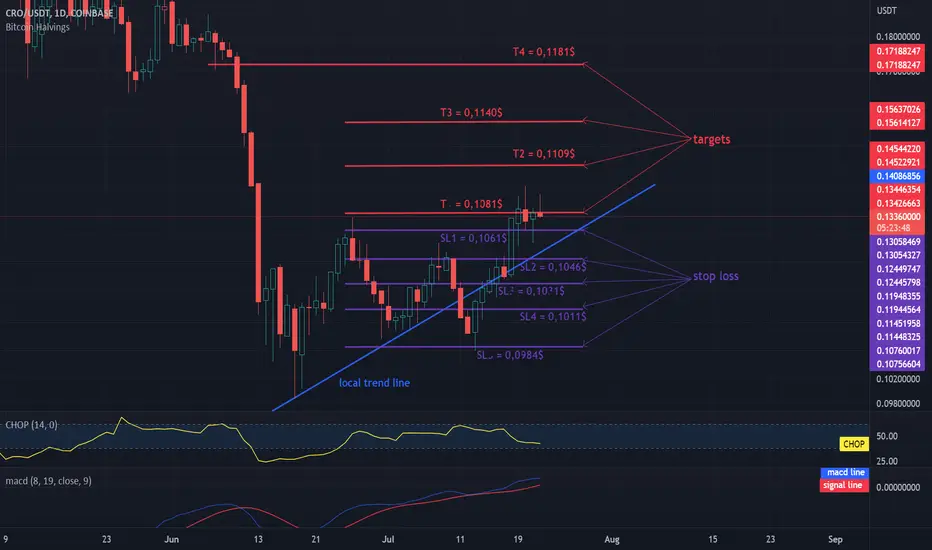
FTM continues the local uptrend.Hello everyone, let's take a look at the 1D CRO to USDT chart as you can see that the price has returned above the local uptrend despite its decline.
Let's start by setting goals for the near future that we can consider:
T1 = $ 0.1081
T2 = $ 0.1109
T3 = $ 0.1140
and
TT4 = $ 0.1181
Now let's move on to the stop loss in case of further market declines:
SL1 = $ 0.1061
SL2 = $ 0.1046
SL3 = $ 0.1031
SL4 = $ 0.1011
and
SL5 = $ 0.0984
Looking at the CHOP indicator, we can see that in the 1D range most of the energy has been used, while the MACD indicator shows a local upward trend.
The FTM fights the resistance on the 1 day interval.Hello everyone, let's take a look at the 1D FTM to USDT chart as you can see the price is moving above the local uptrend line.
Let's start by setting goals for the near future that we can consider:
T1 - $ 0.3208
T2 - $ 0.3589
T3 - $ 0.3985
and
T4 - $ 0.4529
Now let's move on to the stop loss in case of further market declines:
SL1 - $ 0.2952
SL2 - $ 0.2769
SL3 - $ 0.2573
and
SL4 - $ 0.2295
Looking at the CHOP indicator, we can see that in the 1D range the energy has been used, while the MACD indicator shows a local upward trend.

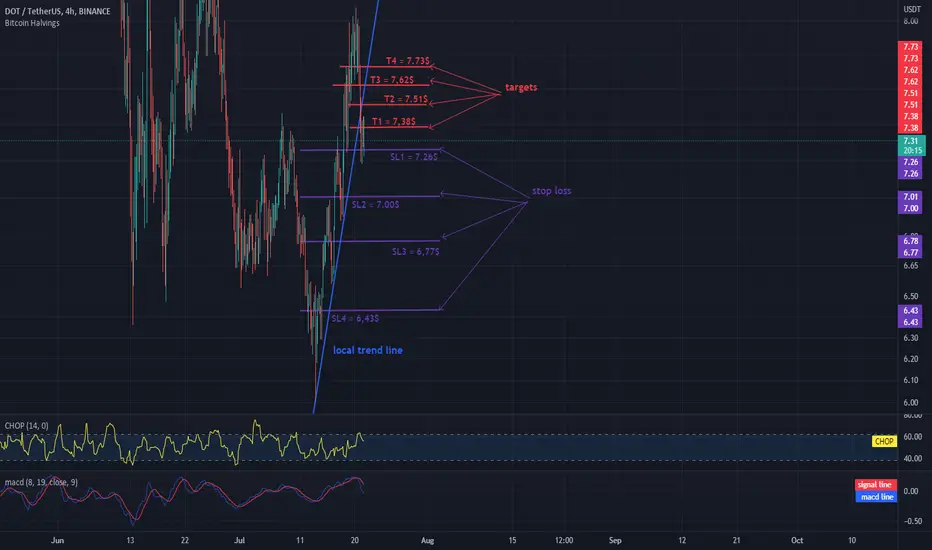
DOT SHORT 4H INTERVALHello everyone, let's take a look at the 4H DOT vs. USDT chart. As you can see, the price has dropped below the local uptrend line.
Let's start by setting goals for the near future that we can consider:
T1 = $ 7.38
T2 = $ 7.51
T3 = $ 7.62
and
T4 = $ 7.73
Now let's move on to the stop loss in case of further market declines:
SL1 = $ 7.26
SL2 = $ 7.00
SL3 = $ 6.77
and
SL4 = $ 6.43
Looking at the CHOP indicator, we can see that in the 4H range we still have a lot of energy, while the MACD indicator shows a local downward trend.
Bitcoin Pump to 28kVery simple Analysis here. When Btc closes above the bottom double bolinger band, it pumps to either the basis line (mid-line) or all the way to the upper band. The basis is currently at 28000. Simple as bb's are, it is more often accurate than not. I guess we'll find out soon enough.

ETH / USDT 4HChart - Targets And StopLossHello everyone, let's take a look at the 4H ETH to USDT chart as you can see the price is moving above the local downtrend line.
Let's start by setting goals for the near future that we can consider:
T1 - $ 1,405
T2 - $ 1,527
and
T3 - $ 1704
Now let's move on to the stop loss in case of further market declines:
SL1 - $ 1,452
SL2 - $ 1,345
SL3 - $ 1,257
SL4 - $ 1167
and
SL5 - $ 1,038
Looking at the CHOP indicator, we can see that in the 4H range we have a lot of energy and the MACD indicator indicates entering a local downward trend.

ADA/USDT TARGETS AND STOPLOSS 4HHello everyone, let's take a look at the 4H ADA to USDT chart as you can see the price is moving above the local downtrend line.
Let's start by setting goals for the near future that we can consider:
T1 - $ 0.5362
T2 - $ 0.5672
T3 - $ 0.6126
and
T4 - $ 0.6695
Now let's move on to the stop loss in case of further market declines:
SL1 - $ 0.5151
SL2 - $ 0.4939
SL3 - $ 0.4763
SL4 - $ 0.4587
and
SL5 - $ 0.4333
Looking at the CHOP indicator, we can see that in the 4H range most of the energy has been used, and the MACD indicator shows a local upward trend.

DOT / USDT 4H CHART - fight the resistance!Hello everyone, let's take a look at the 4H DOT to USDT chart as you can see the price broke above the local downtrend channel and started a local uptrend.
Let's start by setting goals for the near future that we can consider:
T1 = $ 7.96
T2 = $ 8.49
T3 = $ 9.10
and
T4 = $ 9.94
Now let's move on to the stop loss in case of further market declines:
SL1 = $ 7.55
SL2 = $ 7.26
SL3 = $ 7.00
SL4 = $ 6.77
and
SL5 = $ 6.43
Looking at the CHOP indicator, we can see that in the 4H range we still have energy to continue the movement and the MACD indicator confirms the local upward trend.

BNB / USDT 1D INTERVAL, STOPLOSS AND TARGETSHello everyone, let's take a look at the 1D BNB to USDT chart as you can see the price is moving above the local uptrend line.
Let's start by setting goals for the near future that we can consider:
T1 - $ 278
T2 - $ 304
and
T3 - $ 337
Now let's move on to the stop loss in case of further market declines:
SL1 - $ 251
SL2 - $ 238
SL3 - $ 228
SL4 - $ 217
and
SL5 - $ 202
Looking at the CHOP indicator, we can see that in the 1D interval most of the energy has been used, while the MACD indicator shows that we are in an upward trend.

Xrp short term targets 2022 Bear I have a couple of xrp targets if we break through this descending triangle which is a bearish continuation pattern. I have targets ranging between $0.22 and $0.25. We still have negative overall market news on recession and inflation fears along with insolvent cefi platforms that are plaguing the crypto markets. We will most likely find a bottom in crypto during this bear in 2022. I am using the 4 hourly chart with the MA and EMA 200 and 210. We have great current news with the Xrp vs Sec court case but equity and crypto market factors will affect Xrp in short term then a settlemnt will eventually move Xrp into a bull run.

SOL / USDT - 1daychartHello everyone, let's take a look at the 1D SOL to USDT chart as you can see the price is moving above the local downtrend line.
Let's start by setting goals for the near future that we can consider:
T1 - $ 42.71
T2 - $ 46.73
and
T3 - $ 52.33
Now let's move on to the stop loss in case of further market declines:
SL1 - $ 38.91
SL2 - $ 36.42
SL3 - $ 34.41
and
SL4 - $ 32.41
Looking at the CHOP indicator, we can see that we still have a lot of energy in the 1D range, while the MACD indicator shows a local upward trend.

MATIC/USDT - Targets and StoplossHello everyone, let's take a look at the 1D MATIC to USDT chart as you can see the price is moving above the local uptrend line.
Let's start by setting goals for the near future that we can consider:
T1 - $ 1.0378
T2 - $ 1,2003
T3 - $ 1.4368
and
T4 - $ 1.7495
Now let's move on to the stop loss in case of further market declines:
SL1 - $ 0.8365
SL2 - $ 0.7357
SL3 - $ 0.6584
and
SL4 - $ 0.5766
Looking at the CHOP indicator, we can see that in the 1D range most of the energy has been used, and the MACD indicator indicates a local upward trend.

BNB is climbing the local uptrend lineHello everyone, let's take a look at the 1D BNB to USDT chart as you can see the price is moving above the local uptrend line.
Let's start by setting goals for the near future that we can consider:
T1 - $ 260
T2 - $ 278
T3 - $ 304
and
T4 - $ 337
Now let's move on to the stop loss in case of further market declines:
SL1 - $ 238
SL2 - $ 228
SL3 - $ 219
SL4 - $ 210
and
SL5 - $ 198
Looking at the CHOP indicator, we can see that some energy was consumed in the 1D range and the MACD indicator shows the local uptrend.

ETH / USDT 1DChart - Targets And StopLossHello everyone, let's take a look at the 1D ETH to USDT chart as you can see the price is moving above the local downtrend line.
Let's start by setting goals for the near future that we can consider:
T1 - $ 1,405
T2 - $ 1,527
T3 - $ 1704
and
T4 - $ 1,928
Now let's move on to the stop loss in case of further market declines:
SL1 - $ 1297
SL2 - $ 1,220
SL3 - $ 1154
SL4 - $ 1090
and
SL5 - $ 999
Looking at the CHOP indicator, we can see that in the 1D interval some energy was used, and the MACD indicator shows a local upward trend.

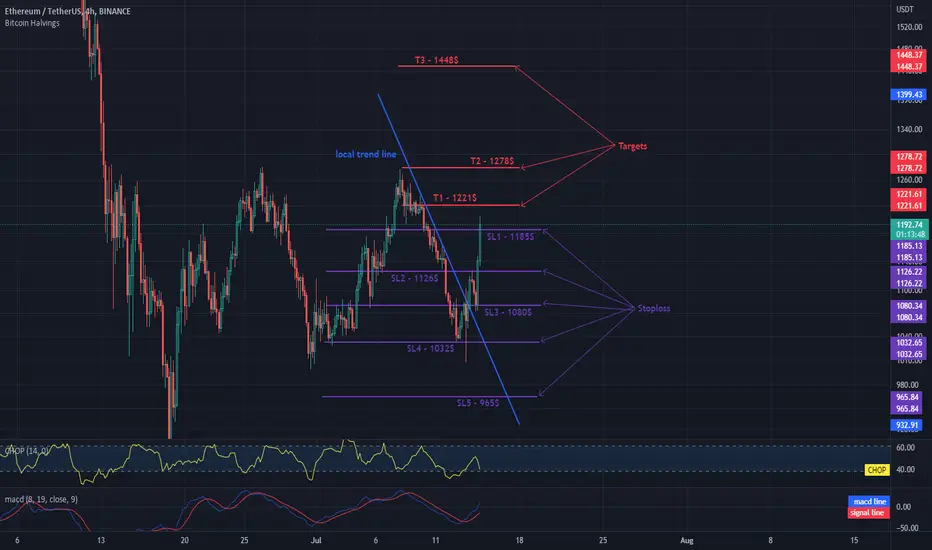
ETH 4HChart - Targets And StopLossHello everyone, let's take a look at the 4H ETH to USDT chart as you can see the price has moved above the local downtrend line.
Let's start by setting goals for the near future that we can consider:
T1 - $ 1,221
T2 - $ 1,278
and
T3 - $ 1,448
Now let's move on to the stop loss in case of further market declines:
SL1 - $ 1185
SL2 - $ 1126
SL3 - $ 1080
SL4 - $ 1032
and
SL5 - $ 965
Looking at the CHOP indicator, we can see that in the 4H range most of the energy has been surpassed and the MACD indicator shows that we are in a local uptrend.
NIFTY - Possible Trade for Today- 14-07-2022As discussed in our study yesterday, the index was not able to sustain above 16120 and the witnessed a move to lower levels and close below 16000 yesterday. Options OI build up in the weekly expiry suggest 15800 -15700 to be a support area. On the upside move towards 16100 could see fresh shorts getting added. For the day the market can remain range bound and trade between 16100 and 15800. We maintain a mild negative bias and hence any upmove towards 16100 levels can be used for building short positions. Shorts will need to be squared off if the market starts trading consistently above 16100.
Important levels for the day are given below
Bullish Above 16100
Possible Upside Targets - 16180/16230/16280/16310
Bearish Below 16080
Possible Downside Targets - 16000/15920/15880/15840/15800.
Disclaimer:
The analysis provided is for educational purpose and the author does not assume any responsibility for the trades initiated based on the analysis. Consult your financial advisor before making any trades
