BTCUSD - Bitcoin short-term recovery and correction 20210910The BTC market is indecisive. If it recovers the short-term price recovery may be around $46,400. However, if it fails to defend the support of around $46400 it may correct to $40200.
Both the recovery target and the correction target have support and in consideration the data from the volume profile , recovery target in the 1h chart and correction target in the 1d chart.
Targets

Long Visa - a pullback created a buying opportunityHealthy pullbacks in companies like Visa are fairly hard to come by. Wave trend points toward oversold. 200sma nearby for support, but historically cant always hold up so I've adjusted my stop accordingly. This is a long term idea for me, maybe selling 40 percent at the target and letting the rest ride. Not financial advice

QIUSDTpossible targets are shown by Fibonacci levels for QIUSDT. we do not have enough history to show the resistances and supports so Fibo could be a good choice.

NASDAQ MAY MAKE A HISTORICAL RESISTANCENasdaq is in a very strong upward trend and has built a new historic resistance.
If the price become supported on trend line and can not be broken, there is a possibility of going up to a higher goal and building another new resistance.
But if the trend line breaks, we will have a fall to the desired target.

DOGE-USD possible targets (Update)This is an update from a previous post👇 because we seem to be gaining support above 30 cents again.
I do not own the rights to meme image above.
Let's see and always remember ⏬⏬
🛑This is not financial advice🛑 Above are approximate targets based on fibs and major trend-lines etc. I always recommend looking at multiple charts when making a big investment, thank you!
Always have a stop loss ✋🛑💲 set
Any thoughts 💭💡, questions 🙋♀️🙋♂️❓, good 👍, bad👎, happy 😄 or sad 😥, in the comments always welcome.
Thank you so much!!!!
Jazerbay
⭐

Bitcoin BearishAs what was expected in my last idea we went up from 30k to exactly hit my last target and now i think nothing is changed that means we are going down 30K again
at 30K lvl we have 2 choices :
1- we will have anogther xxz correction to end the wave 4 before going deeper to 20K lvls and it must be a triangle because we can not have 2kind of same correction in one wave i can not exactly say where the xx wave will end and the triangle will starts but i think it will be the 36k lvl or the 30k it depends on the price action at these levels
2- we do finished the wave 4 as my last Idea and now we are going down to around 20K to finish the wave A from the Main ABC corection we can decide when we see the price action at that lvls but it seems that we still need the xxz correctopn because untill now we did not see enough bearsh power
please see my last idea to understand what i mean

BTC Possible directionBTC USDT: Update,
The ascending triangle formed inside of the big rising wedge
A rising wedge is bearish, the ascending triangle is bullish, which one will be stronger?
Now it looks like we broke down from this big rising wedge, but the lower support line of this triangle still holds...
Breaking support of triangle would also be bearish, so we would have double confirmation of reversal to downside coming.
We talking about chances here, but we should always have in mind that BTC knows to ignore this and to do something totally opposite...

MY XRP PROJECTION FOR THE COMING MONTHSYellow Boxes - Targets
Purple Boxes - Key Support Levels
Black Lines - Key Levels
Channel Structure In Play
TAKE PROFIT LEVELS @ $2.4/$3

ETHLooks like ETH want's to test $2,750-$2,800 IMO and from the look of the stoch RSI that could be strong resistance.

Video How to Set the PERFECT Target Every Time (yeah, right...) Educational video on the different approaches to setting targets & the importance of having a certain mindset when looking to take profits

Alice could have nice run up if BTD do not roll over againIf the king does not roll over again, ALICE could have a nice run... A formed nice descending wedge which is by default bullish pattern. All we can do is to be ready and wait...

Head and Shoulders on Daily with Entry Levels and TargetsWe have somewhat of a Head and Shoulders pattern at the 50-61.8% Fibonacci Retracement Level.
Upon Market Open I will be entering a Short Position with my stoploss above the highs
ETH - Falling into Support - Analysis / Strategy ETH continues to trade inside its bearish trend setting lower lows/highs. As ETH prepares to enter the support zone short-term buying potential increases.
Analysis:
Per the conditions of a bear trend, we can fully expect ETH to continue to trade lower and lower. However, utilizing indicators and knowledge of previous support zones we see that ETH is burning a lot of "Strength" as it heads toward the 1500-1700 support zone. This suggests a potential bounce within the trend and potentially beyond.
Strategy:
I will look for buy setups when ETH is in two positions. A. inside the support zone and B. near the bottom end of the trend.
Best of luck, Like/Follow for more.

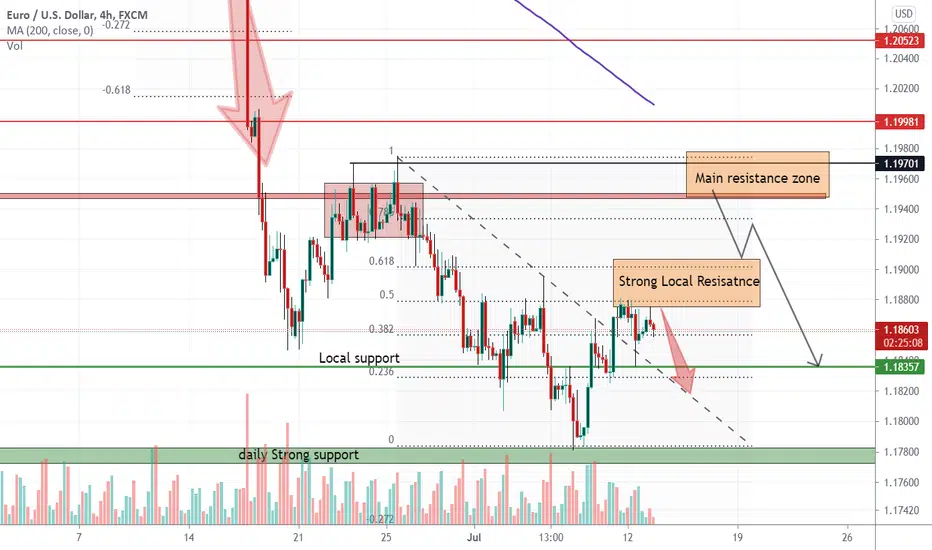
EURUSD Strong Resistance zones are ahead once again After previous successful long that we had, now price is hitting our resistance zones and targets on the previous chart :
so we are looking for opening some short positions in best place available now :
The first resistance zone that is strong once too is now 0.5% and 0.61% of the Fibonacci and the second one is the daily local resistance zone
that both marked on the chart with orange zones.
Targets and supports ahead :
A. 1.1820
B. 1.1780
DISCLAIMER: ((trade based on your own decision ))
<>
My targets for today NANO | USDT that good ol Zig zagHello!
Yesterday both my targets hit and now I`m (4.8 and 4.35) Now I`m interested in selling it again at 4.81.
I have to go to work today so I`ll let this plan run its course until I get back home in about 7 hours.
Then I will revisit the plan and see what's up.
Thanks for the support y`all

$BTC #Bitcoin Head & ShouldersPossible Pattern Forming on the 2hr time frame. Target of this possible H&S pattern is in the region of $35,000.00 and $34,500.00. Estimated time of the H&S pattern to complete it's formation if it is in fact one is 19.06.2021. This date coincides with my Death Cross which is on the Daily time frame. To have a look at the Death Cross chart please follow the link here:
#Bitcoin Head & Shoulders Possible Pattern Forming Bitcoin-Death-Cross-Countdown to follow the actual live Death Cross with estimated time of crossing.
For the H&S to become invalidated the price must reach the previous high or above the Head of the H&S. If this plays out then I will be opening a trade in the direction of the pattern which is a bearish pattern on confirmation of the breakout to the down side.

BTCUSD 4 Hour Flat ?Possible flat pattern in current sideways price action on the 4 hour chart. I take a deeper dive to see what is going on from an Elliott Wave Analysis.

BTCUSD - Weekly OutlookBitcoin closed a couple of weeks ago above 33000 and since which has not looked back at that area and continues to look upward. The next bullish weekly target is in the region of 44500 and possibly up to our projected Elliot Wave d Fibonacci levels between 47000 and 48000. Should price break down from its current upward trend we could see a retest of the 33000 area and lower. Please see BTC Monthly Outlook for reference.

Possible inverted H&SH on BTC/USDT 2Has you see we are now at right shoulder and we have multiple +RD in head + R.Sh on MACD ,
Target measured from the base of the Head

My first trade goes to the target !!Although it was my first analysis, I trusted my analysis on Lina and set my goals. Since it was my first analysis, I may have mistakes in the zones, but I think it will reach the targets !!

USDCHF Long, 1:6 availableGood morning ladies & gents,
I believe USDCHF is ready for its bullish cycle going up, although there are many significant targets to the upside, I will trade this pair in chunks as its better for capital efficiency.
After moving out of its low yesterday, USDCHF is sat in Level 1 Long.
Price has traded down into the H1 Mitigation Block which overlays with the M30 Bullish Orderblock, from here I'm anticipating a lower timeframe break of market structure to the upside, followed by a retest where I'll be looking to take it long with these 3 objectives above as my targets.
Let's see how it plays out!
- AmplaFX

Small Timeframe - Fractal Wyckoff - BTCI've noticed several small timeframe Wyckoff distribution schematics unfold during this downtrend for Bitcoin., basically after every major impulse down.
Wyckoff schematics, like most things in charting markets, tend to have a fractal nature. See attached article for reference. So it is no wonder when you have a large timeframe Wyckoff schematic playout, you will see similar schematics playout on smaller timeframes.
This schematic is still premature, imo, and will have to monitor volume. Will it play out?
Confluence factors:
1. FIB time lines up very nicely with the impulse moves and corrections thus far.
2. FIB speed fan has the current local trend bending into a equal triangle along the top for resistance (golden pocket 0.618 / 0.66)
3. Possible UT at the 8 FIB time where it meets the FIB fan at 0.5.
4. Possible UTAD at 0.786 resistance of the Trend-based Fib extension. This was a major support flipped into resistance level previously, and caught a major wick almost to the dollar just about 2 weeks ago around 45500.
5. The 1.618 Fib extension is also acting as support at the base of the triangle (around $31K).
6. First target based on a simple 1:1 from the height of the triangle gives us about 19873, and is right around the 2.272 Fib on the same extension.

Dollar 90.00 Tapped!Please don't forget to give us a like and follow if you find our analysis useful.
Prior chart:
The dollar appears to be getting a second wind after big beats in US headline and core US inflation, even allowing for base effects that implied an upside bias to market expectations, but initial gains were swiftly erased and reversed to leave the index languishing below pre-data levels at one stage.
Perhaps the Dollar took heed of the Fed’s view that spikes in CPI and other price metrics will prove to be transitory, though the reaction in US Treasuries and other global bonds has been more consistent with the reflation story.
Back to the DXY, and a slow grind higher following comments from Fed’s Clarida who is equally surprised by the CPI prints as he was with last Friday’s NFP upset kept the index above 90.000 from a marginal new 90.153 low and seemingly refreshed for a another rebound to notch a 90.718 high. Overall further downside is expected over the next couple of weeks.
