Now it’s an EU trade war Trump wantsDonald Trump has threatened to impose 25% tariffs on the European Union, bizarrely stating that the 27-member bloc was “formed to screw the United States.”
Without providing further details, he hinted at targeting carmakers, saying, “We have made a decision and we’ll be announcing it very soon.” The EU has vowed to retaliate immediately if the tariffs take effect.
EUR/USD tested resistance around 1.0536 before sellers stepped in around the time of Trump's announcement. The pair remains under pressure, trading below the 50-day EMA, while the 200-day EMA is flattening, offering a potential target besides the 38 and 50% Fibonacci levels on the chart.
Tariffs

EURUSD 26 Feb 2025 W9 - Intraday AnalysisThis is my Intraday analysis on EURUSD for 26 Feb 2025 W9 based on Smart Money Concept (SMC) which includes the following:
Market Sentiment
4H Chart Analysis
15m Chart Analysis
Market Sentiment
Today economic news:
No Major economic news scheduled today.
The market still in the same sentiment detailed in my Weekly Analysis . Below a summary:
Short-Term Bias: Cautiously bullish for EUR/USD, driven by optimism over delayed tariffs, geopolitical progress, and hopes for softer inflation.
Key Risks:
A hot PCE report reviving Fed hawkishness.
Sudden tariff escalations or breakdowns in peace talks.
4H Chart Analysis
1️⃣
🔹Swing Bullish (Reached Swing Extreme Demand)
🔹INT Bearish (Reached Extreme Supply)
🔹INT-INT Bullish (Reached EQ (50%)
🔹Swing Continuation
2️⃣
🔹With the deep pullback to the Bullish Swing extreme discount and mitigating the 4H/Daily demand zones, price turned Bullish forming a Bullish CHoCH.
🔹The current Bullish move from Swing extreme discount to current price level having 2 scenarios (Previously I’d the following 2 scenarios where now I favors the 2nd scenario due to the impulsive nature of the move):
Scenario 1: Pullback for Bearish INT Structure and with the recent Bearish CHoCK and Minor Demand zones are failing, I expect Bearish continuation to target the Weak INT Low which aligns with the Daily/Weekly Bearish Structure/Move. (Counter Swing – Pro Internal)
Scenario 2: Bullish Swing continuation to target the Weak Swing High. Which requires to have Demand holding and Supply failing. The first sign required to confirm this scenario will be the current Demand which price is currently at to hold and we form a Bullish CHoCH. (Pro Swing – Counter Internal)
🔹With this week open, price continued Bullish as expected and created another ii-BOS after which price started PB for the ii-BOS and reached the recent Demand which we could see the next Bullish move from.
3️⃣
🔹Still expectation is set to continue Bullish targeting the Weak Swing High as long LTFs holds Bullish structures. Also, In my mind I’m not neglecting the current Bearish 4H INT structure and we already reached that structure extreme.
15m Chart Analysis
1️⃣
🔹Swing Bullish
🔹INT Bullish
🔹Reached Swing EQ (50%)/Discount
🔹Swing Continuation Phase
2️⃣
🔹After the 15m Bullish BOS, price initiated the Swing PB Phase.
🔹Price reached the 15m Swing EQ (50%) and turned Bullish after the INT structure changed to Bullish iBOS indicating that the Swing PB maybe over and we are currently starting the Swing Bullish continuation Phase.
🔹As price continued Bullish yesterday with Bullish iBOS. Currently with the recent iBOS we started the pullback and reached the INT structure extreme Demand where price can start the INT structure Bullish continuation and target the Weak INT High and ultimately the Weak 15m Swing High.
🔹If price failed to hold the INT structure Bullish and Turned Bearish, there is a high probability that we will continue Bearish based on the DXY PB Phase on 4H (PB after Bearish iBOS) and price may target the Strong 15m Swing Low.
3️⃣
🔹Expectations is set to continue Bullish with the 15m / 4H INT & Swing are all Bullish while also cautious about the possibility of price to turn Bearish iBOS.

EURUSD 25 Feb 2025 W9 -Intraday Analysis- US Consumer ConfidenceThis is my Intraday analysis on EURUSD for 25 Feb 2025 W9 based on Smart Money Concept (SMC) which includes the following:
Market Sentiment
4H Chart Analysis
15m Chart Analysis
Market Sentiment
Today economic news:
US : Consumer Confidence
The market still in the same sentiment detailed in my Weekly Analysis . Below a summary:
Short-Term Bias: Cautiously bullish for EUR/USD, driven by optimism over delayed tariffs, geopolitical progress, and hopes for softer inflation.
Key Risks:
A hot PCE report reviving Fed hawkishness.
Sudden tariff escalations or breakdowns in peace talks.
4H Chart Analysis
1️⃣
🔹Swing Bullish (Reached Swing Extreme Demand)
🔹INT Bearish (Reached Extreme Supply)
🔹INT-INT Bullish (Reached EQ (50%)
🔹Swing Continuation
2️⃣
🔹With the deep pullback to the Bullish Swing extreme discount and mitigating the 4H/Daily demand zones, price turned Bullish forming a Bullish CHoCH.
🔹The current Bullish move from Swing extreme discount to current price level having 2 scenarios (Previously I’d the following 2 scenarios where now I favors the 2nd scenario due to the impulsive nature of the move):
Scenario 1: Pullback for Bearish INT Structure and with the recent Bearish CHoCK and Minor Demand zones are failing, I expect Bearish continuation to target the Weak INT Low which aligns with the Daily/Weekly Bearish Structure/Move. (Counter Swing – Pro Internal)
Scenario 2: Bullish Swing continuation to target the Weak Swing High. Which requires to have Demand holding and Supply failing. The first sign required to confirm this scenario will be the current Demand which price is currently at to hold and we form a Bullish CHoCH. (Pro Swing – Counter Internal)
🔹With this week open, price continued Bullish as expected and created another ii-BOS after which price started PB for the ii-BOS and reached the recent Demand which we could see the next Bullish move from.
3️⃣
🔹Still expectation is set to continue Bullish targeting the Weak Swing High as long LTFs holds Bullish structures. Also, In my mind I’m not neglecting the current Bearish 4H INT structure and we already reached that structure extreme.
15m Chart Analysis
1️⃣
🔹Swing Bullish
🔹INT Bullish
🔹Reached Swing EQ (50%)/Discount
🔹Swing Continuation Phase
2️⃣
🔹After the 15m Bullish BOS, price initiated the Swing PB Phase.
🔹Price reached the 15m Swing EQ (50%) and turned Bullish after the INT structure changed to Bullish iBOS indicating that the Swing PB maybe over and we are currently starting the Swing Bullish continuation Phase.
3️⃣
🔹Expectations is set to continue Bullish with the 15m / 4H INT & Swing are all Bullish.
🔹Price targets are 15m Weak INT High and ultimately 15m Weak Swing High.

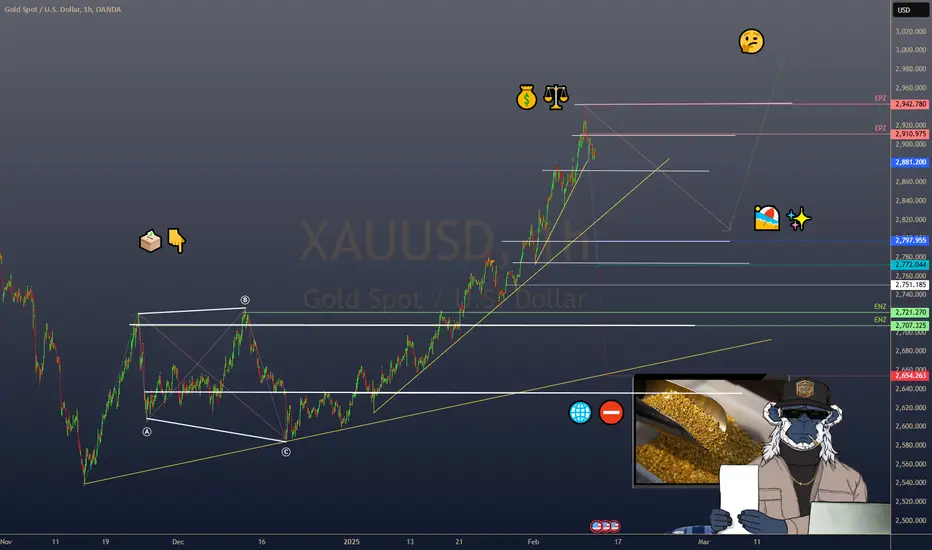
Gold NEW ATH to $2,954?! (1H UPDATE)Gold on the 4H TF is within its final Wave 5 bullish move, there’s no arguing with that. The only thing to debate is how high can Wave 5 push up before reversing?
While it’s possible that Wave 5 has now peaked at $2,942 & ready for a major correction, on the 1H TF I see a small possibly of it creating a new ATH toward $2,954. HIGH RISK TRADE.
Confluences👇🏻
⭕️Distribution Schematic Taking Place Between Wave 3 High, Wave 4 Low & Wave 5 High.
⭕️Wave E Rejected From Psychological Number Of $2,940 (LQ Trap).
⭕️No Strong Sell Off Yet To Indicate A Reversal Has Started.

EURUSD 20 Feb 2025 W8 - Intraday - US Unemployment ClaimsThis is my Intraday analysis on EURUSD for 20 Feb 2025 W8 based on Smart Money Concept (SMC) which includes the following:
Market Sentiment
4H Chart Analysis
15m Chart Analysis
Market Sentiment
Some USA economic news today:
US : Unemployment Claims & Philly Fed Manufacturing Index
The market still in the same sentiment detailed in my Weekly Analysis . Below a summary:
Short-Term Bias: Cautiously bullish for EUR/USD, driven by optimism over delayed tariffs, geopolitical progress, and hopes for softer inflation.
Key Risks:
A hot PCE report reviving Fed hawkishness.
Sudden tariff escalations or breakdowns in peace talks.
4H Chart Analysis
1️⃣
🔹Swing Bullish (Reached Swing Extreme Demand)
🔹INT Bearish (Reached Extreme Supply)
🔹INT-INT Bullish (Reached EQ (50%)
🔹Swing Continuation
2️⃣
🔹With the deep pullback to the Bullish Swing extreme discount and mitigating the 4H/Daily demand zones, price turned Bullish forming a Bullish CHoCH.
🔹The current Bullish move from Swing extreme discount to current price level having 2 scenarios (Previously I’d the following 2 scenarios where now I favors the 2nd scenario due to the impulsive nature of the move):
Scenario 1: Pullback for Bearish INT Structure and with the recent Bearish CHoCK and Minor Demand zones are failing, I expect Bearish continuation to target the Weak INT Low which aligns with the Daily/Weekly Bearish Structure/Move. (Counter Swing – Pro Internal)
Scenario 2: Bullish Swing continuation to target the Weak Swing High. Which requires to have Demand holding and Supply failing. The first sign required to confirm this scenario will be the current Demand which price is currently at to hold and we form a Bullish CHoCH. (Pro Swing – Counter Internal)
🔹With the recent moves, Minor Supply is holding and demand is failing to facilitate the INT-INT Bullish structure Pullback which reached the structure EQ (50%).
3️⃣
🔹After the Bullish ii-BOS, price pulled in a corrective PA to the structure EQ (50%) and currently within the Daily Demand.
🔹Still expectation is set to continue Bullish targeting the Weak Swing High as long LTFs holds Bullish structures. Also, In my mind I’m not neglecting the current Bearish 4H INT structure and we already reached that structure extreme where we are getting the current corrective Bearish OF.
15m Chart Analysis
1️⃣
🔹Swing Bullish
🔹INT Bearish
🔹Reached Swing EQ (50%)/Discount
🔹Swing Pullback Phase
2️⃣
🔹The 15m Bullish Swing pullback phase is still intact with continues Bearish INT structures.
🔹Price had reached Swing extreme demand in Swing Discount.
🔹With the recent Bearish iBOS, price had formed Liq. above the 15m Demand which was sept with the break of the Weak INT Low, mitigating the 15m Demand and forming a Bullish CHoCH to initiate the Bearish INT Structure Pullback.
🔹Technically Shorts is the straight forward play (Played very well yesterday as per expectations and executions), but keep in mind that the Bearish INT structures task is to facilitate the 15m Swing Pullback and we are currently in the Swing Discount Zone and if the Swing is going to continue Bullish, there is a high probability that the INT Structure is going to shift Bullish.
3️⃣
🔹It’s a crossroads! Expectations is for price to turn Bullish and create a Bullish INT structure to confirm the Swing Pullback is over and the start of the Swing Bullish continuation Phase (Bullish iBOS for confirmation).
🔹Will be looking for longs after Bullish iBOS. As for Shorts, not in my interest currently based on where we are within the 115m Swing (Discount)/15m & 4H Demand even with the INT structure is Bearish.

EURUSD 18 Feb 2025 W8 - Intraday - EU ZEW /US ManufacturingThis is my Intraday analysis on EURUSD for 18 Feb 2025 W8 based on Smart Money Concept (SMC) which includes the following:
Market Sentiment
4H Chart Analysis
15m Chart Analysis
Market Sentiment
Some light economic news today along with the US Markets are back after long weekend.
EUR : ZEW Economic Sentiment
US : Empire State Manufacturing Index
The market still in the same sentiment detailed in my Weekly Analysis. Below a summary:
Short-Term Bias: Cautiously bullish for EUR/USD, driven by optimism over delayed tariffs, geopolitical progress, and hopes for softer inflation.
Key Risks:
A hot PCE report reviving Fed hawkishness.
Sudden tariff escalations or breakdowns in peace talks.
4H Chart Analysis
1️⃣
🔹Swing Bullish
🔹INT Bearish
🔹Reached Swing Extreme Demand
🔹Swing Continuation
2️⃣
🔹With the deep pullback to the Bullish Swing extreme discount and mitigating the 4H/Daily demand zones, price turned Bullish forming a Bullish CHoCH.
🔹The current Bullish move from Swing extreme discount to current price level having 2 scenarios (Previously I’d the following 2 scenarios where now I favors the 2nd scenario due to the impulsive nature of the move):
Scenario 1: Pullback for Bearish INT Structure and with the recent Bearish CHoCK and Minor Demand zones are failing, I expect Bearish continuation to target the Weak INT Low which aligns with the Daily/Weekly Bearish Structure/Move. (Counter Swing – Pro Internal)
Scenario 2: Bullish Swing continuation to target the Weak Swing High. Which requires to have Demand holding and Supply failing. The first sign required to confirm this scenario will be the current Demand which price is currently at to hold and we form a Bullish CHoCH. (Pro Swing – Counter Internal)
🔹With the recent moves, Supply is failing and Demand is holding solidifying the scenario that the Bullish 4H Swing continuation in play.
🔹Price swept Liq. above 30 Jan on 4H and Daily where I’d noted in the previous days analysis which can provide a decent pullback. (Bearish CHoCH is required to confirm the Sweep of Liquidity. Otherwise, it’s not enough and price will continue from the recent 4H Demand formed).
3️⃣
🔹Currently price is targeting the Liq. (Bearish CHoCK) above the recent demand which could provide Bullish continuation.
🔹Expectations is set to continue Bullish to target the Weak 4H Swing High to facilitate to the Daily and Weekly expected Bullish move.
15m Chart Analysis
1️⃣
🔹Swing Bullish
🔹INT Bearish
🔹Swing Pullback Phase
2️⃣
🔹Bullish Swing structure continuing bullish aligning with the 4H Bullish Swing continuation phase.
🔹After the recent Swing BOS, we expect a pullback which is confirmed with the 15m Bearish iBOS today.
🔹With the Bearish iBOS we confirm the 15m pullback phase to Swing EQ (50%)/ Discount.
3️⃣
🔹As price on the 4H is currently targeting the Liq. (Bearish CHoCH), expectations today is to continue Bearish to facilitate the 15m Swing Pullback to Swing Discount and mitigate the 4H/15m Demand before continuing Bullish.

2025 Market Outlook - Cautiously Bullish (Important Bar Counts)Hey Everybody,
Thanks for checking out the video. I'm reviewing all major instruments, US and Non US.
US has carried the financial markets since 2020 and 2022 and this year out of the gate we're seeing big runs in "uninvestable" spaces like Europe and China. I say that jokingly because of how bad everything thought non US assets were, but here we are watching DAX, FTSE, and HSI running to double digit gains while the US lags behind.
Will the US catch up and the global economy tide rise to lift all boats or are we truly seeing a catch up trade that will have headwinds uncertainties a plenty? Time will tell.
This week is a holiday shortened trading week, RBA and RBNZ expected to cut rates, Europe and US printing PMI on Friday. BABA and BIDU earnings this week (China related), and NVDA earnings next week (#2 market cap in US).
I discuss the big bar counts that I'm watching closely on SPY, SPX, XSP, RSP, NDX, QQQ, DIA, NVDA, META, NFLX, and others that I believe technically will matter for limited upside momentum without a bigger pause, snapback or correction ahead.
Cautiously optimistic is a perfect play for 2025. I'm off to a good start for the year and intend to keep that way without chasing or doing anything silly.
Thank for watching.

Can Soybeans Survive the Global Trade Chessboard?In the intricate game of international trade politics, soybeans have emerged as pivotal pieces on the global economic chessboard. The soybean industry faces a critical juncture as nations like the European Union and China implement protectionist strategies in response to US policies. This article delves into how these geopolitical moves are reshaping the future of one of America's most significant agricultural exports, challenging readers to consider the resilience and adaptability required in today's volatile trade environment.
The European Union's decision to restrict US soybean imports due to the use of banned pesticides highlights a growing trend towards sustainability and consumer health in global trade. This move impacts American farmers and invites us to ponder the broader implications of agricultural practices on international commerce. As we witness these shifts, the question arises: How can the soybean industry innovate to meet global standards while maintaining its economic stronghold?
China's strategic response, which targets influential American companies like PVH Corp., adds complexity to the global trade narrative. The placement of a major U.S. brand on China's 'unreliable entity' list highlights the power dynamics involved in international commerce. This situation prompts us to consider the interconnectedness of economies and the potential for unforeseen alliances or conflicts. What strategies can businesses implement to navigate these challenging circumstances?
Ultimately, the soybean saga is more than a tale of trade disputes; it's a call to action for innovation, sustainability, and strategic foresight in the agricultural sector. As we watch this unfold, we are inspired to question not just the survival of soybeans but the very nature of global economic relationships in an era where every move on the trade chessboard can alter the game. How will the soybean industry, and indeed, international trade, evolve in response to these challenges?

EURUSD 17 Feb 2025 W8 - Intraday AnalysisThis is my Intraday analysis on EURUSD for 17 Feb 2025 W8 based on Smart Money Concept (SMC) which includes the following:
Market Sentiment
4H Chart Analysis
15m Chart Analysis
Market Sentiment
No major economic news for today and market sentiment still continuing as per my Weekly Analysis
4H Chart Analysis
1️⃣
🔹Swing Bullish
🔹INT Bearish
🔹Reached Swing Extreme Demand
🔹Swing Continuation
2️⃣
🔹With the deep pullback to the Bullish Swing extreme discount and mitigating the 4H/Daily demand zones, price turned Bullish forming a Bullish CHoCH.
🔹The current Bullish move from Swing extreme discount to current price level having 2 scenarios (Previously I’d the following 2 scenarios where now I favors the 2nd scenario due to the impulsive nature of the move):
Scenario 1: Pullback for Bearish INT Structure and with the recent Bearish CHoCK and Minor Demand zones are failing, I expect Bearish continuation to target the Weak INT Low which aligns with the Daily/Weekly Bearish Structure/Move. (Counter Swing – Pro Internal)
Scenario 2: Bullish Swing continuation to target the Weak Swing High. Which requires to have Demand holding and Supply failing. The first sign required to confirm this scenario will be the current Demand which price is currently at to hold and we form a Bullish CHoCH. (Pro Swing – Counter Internal)
🔹With the recent moves, Supply is failing and Demand is holding solidifying the scenario that the Bullish 4H Swing continuation in play.
🔹Price swept Liq. above 30 Jan on 4H and Daily where I’d noted in the previous days analysis which can provide a decent pullback. (Bearish CHoCH is required to confirm the Sweep of Liquidity. Otherwise, it’s not enough and price will continue from the recent 4H Demand formed).
3️⃣
🔹Expectations is set to continue Bullish to target the Weak 4H Swing High to facilitate to the Daily and Weekly expected Bullish move.
15m Chart Analysis
1️⃣
🔹Swing Bullish
🔹INT Bullish
🔹Swing continuation after BOS, Waiting Swing pullback phase.
2️⃣
🔹Bullish Swing structure continuing bullish aligning with the 4H Bullish Swing continuation phase.
🔹After the recent Swing BOS, INT structures continuing bullish and I’m expecting the 15m BOS pullback to start soon with Bearish iBOS.
🔹Current INT structures could be treated as Swing structures, but I prefer to have the 15m Swing Bullish even when we have a deep pullback.
🔹INT Structure still can hold bullish to facilitate the 4H target the Weak Swing High (Bullish BOS on 4H before pullback).
3️⃣
🔹As it’s Monday and no much catalyst Today, I prefer longs from the INT structure demand following the bullish structures on 15m and 4H while knowing that pullback can start at any time soon where I can shift to Intraday Bearish after confirmation (Bearish iBOS).

EURUSD 17-21 Feb 2025 W8 - Weekly Analysis -EU ZEW - US FOMC/PMIThis is my Weekly analysis on EURUSD for 17-21 Feb 2025 W8 based on Smart Money Concept (SMC) which includes the following:
Market Sentiment Weekly Chart AnalysisDaily Chart Analysis4H Chart AnalysisEconomic Events for the WeekRelated PostsLatest Weekly Analysis
Market Sentiment
Inflation Data Mix
U.S. CPI and PPI came in hotter than expected, signaling lingering inflation pressures.
However, softer underlying PPI components linked to the Fed’s preferred PCE metric raised hopes for a moderation in inflation next week.
Fed Policy Expectations
Investors are cautiously optimistic about potential Fed rate cuts later in 2025, despite the Fed’s current "wait-and-see" stance.
A softer PCE report next week could solidify bets on easing monetary policy, supporting risk assets like the Euro.
Trump’s Tariff Strategy
Markets dismissed Trump’s reciprocal tariff threats as negotiation tactics rather than a prelude to a trade war.
Investors expect delays in implementation, reducing immediate fears of economic disruption.
Geopolitical Optimism
Progress in Ukraine-Russia peace talks (e.g., territory swap discussions) eased global risk aversion, weakening the USD’s safe-haven appeal.
Reduced geopolitical tensions benefit the Eurozone economy, indirectly lifting the Euro.
Central Bank Divergence
The ECB may cut rates further in 2025, but improving Eurozone data and reduced trade-war risks provide short-term EUR support.
The Fed’s cautious tone limits USD upside, creating a balanced tug-of-war.
Short-Term Bias
Cautiously bullish for EUR/USD, driven by optimism over delayed tariffs, geopolitical progress, and hopes for softer inflation.
Key Risks:
A hot PCE report reviving Fed hawkishness.
Sudden tariff escalations or breakdowns in peace talks.
This balance of factors suggests choppy but upward-leaning trading for EUR/USD.
Weekly Chart Analysis
1️⃣
🔹Swing Bearish
🔹Internal Bearish
🔹In Swing Discount
🔹Swing Continuation Phase (Pro Swing + Pro Internal)
2️⃣
🔹INT structure continuing bearish with iBOS following the Bearish Swing. (End of 2023 till end of 2024 was a pullback phase after the first bearish iBOS)
3️⃣
🔹After the bearish iBOS we expect a pullback, price tapped into Monthly Demand and the liquidity below Nov 2022 which is above the weekly demand formed with the initiation of the bearish iBOS pullback phase.
🔹Price made a bullish CHoCH which indicated that the liquidity was enough as per previous weeks analysis to initiate a pullback phase for the bearish iBOS.
🔹Price pulled back after the Bullish CHoCH to the Weekly Demand formed and showed reaction after volatile week.
🔹With the previous week solid Bullish close, the Demand did hold and there is a high probability that price could continue Bullish to facilitate the INT structure pullback phase.
🔹If price to continue Bullish, price will be targeting the liquidity above Dec 2024, INT Structure EQ (50%) at 1.06933 to target the Weekly Supply in premium before continuing down to target the Weak INT Low.
🔹Expectations is for price to continue Bullish if it managed to break 1.05333 27 Jan High to facilitate the INT structure pullback.
Daily Chart Analysis
1️⃣
🔹Swing Bearish
🔹INT Bearish
🔹Swing Continuation Phase (Pro Swing + Pro Internal)
2️⃣
🔹Following the Bearish Swing BOS, INT Structure continuing bearish tapping the weekly demand zone.
3️⃣
🔹After the failure to close below the Weak INT Low, price continued bullish sweeping the liquidity above Dec 30 and mitigating a Daily supply zone within the INT Structure Premium Zone.
🔹With the mitigation of the Daily supply, price created a Bearish CHoCH signaling the end of the Pullback Phase of the INT structure and the start of the Bearish move targeting the Weak INT Low.
🔹Price failed for the 2nd time to close below the Weak INT Low after mitigating the Daily Demand formed from the failure to close below the Weak INT Low which triggered aggressive Bullish reaction and mitigating the Daily Supply Zone formed from the recent Bearish CHoCH.
🔹After Supply mitigation, price continued Bearish following the Bearish INT Structure continuation phase.
🔹Previous week I mentioned “if the Daily formed a Bullish CHoCH (Currently above the recent mitigated Supply) this will shift my outlook to the Weekly Scenario of a deep pullback of the Weekly INT Structure to at least the Structure EQ (50%). MTF required to shift Bullish to confirm”. And with that happened I’d shifted to Bullish expectation and there is expectations of a deep pullback within the Daily Bearish INT structure.
🔹The expected targets for the current bullish move is 1st to sweep the liquidity above the equal highs (17 Dec & 27 Jan) 2nd Break of the Strong INT High to facilitate the Daily Bearish Swing pullback and the Weekly Bearish INT pullback.
🔹Currently Supply is failing and Demand is holding confirms the short-term Bullish scenario and setting my expectations for continuing Bullish. Price could pullback to the recent Daily Demand before continuing Bullish.
4H Chart Analysis
1️⃣
🔹Swing Bullish
🔹INT Bearish
🔹Reached Swing Extreme Demand
🔹Swing Continuation
2️⃣
🔹With the deep pullback to the Bullish Swing extreme discount and mitigating the 4H/Daily demand zones, price turned Bullish forming a Bullish CHoCH.
🔹The current Bullish move from Swing extreme discount to current price level having 2 scenarios (Previously I’d the following 2 scenarios where now I favors the 2nd scenario due to the impulsive nature of the move):
Scenario 1: Pullback for Bearish INT Structure and with the recent Bearish CHoCK and Minor Demand zones are failing, I expect Bearish continuation to target the Weak INT Low which aligns with the Daily/Weekly Bearish Structure/Move. (Counter Swing – Pro Internal)
Scenario 2: Bullish Swing continuation to target the Weak Swing High. Which requires to have Demand holding and Supply failing. The first sign required to confirm this scenario will be the current Demand which price is currently at to hold and we form a Bullish CHoCH. (Pro Swing – Counter Internal)
🔹With the recent moves, Supply is failing and Demand is holding solidifying the scenario that the Bullish 4H Swing continuation in play.
🔹Price swept Liq. above 30 Jan on 4H and Daily where I’d noted in the previous days analysis which can provide a decent pullback. (Bearish CHoCH is required to confirm the Sweep of Liquidity. Otherwise, it’s not enough and price will continue from the recent 4H Demand formed).
3️⃣
🔹Expectations is set to continue Bullish to target the Weak 4H Swing High to facilitate to the Daily and Weekly expected Bullish move.
Economic Events for the Week

EURUSD 14 Feb 2025 W7 - Intraday - EU GDP - US Retail SalesThis is my Intraday analysis on EURUSD for 14 Feb 2025 W7 based on Smart Money Concept (SMC) which includes the following:
Market Sentiment
4H Chart Analysis
15m Chart Analysis
Market Sentiment
1. Impact of CPI and PPI on Inflation Expectations
CPI Outcome: The headline CPI rose to 3.0% YoY (vs. 2.9% forecast), while core CPI increased to 3.3% YoY, signaling persistent inflationary pressures 10. However, the market reaction was muted due to mixed signals.
PPI Analysis: The headline PPI exceeded forecasts (3.5% YoY), but key components linked to core PCE inflation (the Fed’s preferred metric) suggested a potential moderation. Analysts noted that softer PCE data next week could ease Fed tightening fears, supporting risk assets like the Euro.
Investor Positioning: Futures traders now price in 33 basis points of Fed cuts in 2025, up from 29 basis points pre-PPI, indicating growing optimism about disinflation.
2. Trump’s Reciprocal Tariffs: Negotiation vs. Trade War
Tariff Announcement: Trump’s directive to formulate reciprocal tariffs (e.g., 25% on steel/aluminum) was not immediately implemented, with a delayed enforcement timeline (potentially April). Markets interpreted this as a negotiation tactic rather than an escalation into a trade war.
Market Reaction: The USD weakened (DXY fell to 107.25) as investors focused on the negotiation window and avoided panic-driven safe-haven flows. The Euro benefited from reduced trade-war fears, rising to $1.0469 in early Asian trade.
3. Geopolitical Optimism and Risk Sentiment
Ukraine-Russia Peace Talks: Reports of potential territory swaps and Trump’s mediation efforts bolstered risk appetite. A resolution could alleviate Eurozone energy and supply-chain pressures, supporting EUR/USD.
Equity Market Stability: European stocks (e.g., Euro STOXX 50) pared losses, with sectors like utilities and healthcare outperforming. This resilience reduced demand for the USD as a safe haven.
4. Central Bank Dynamics
The ECB is expected to cut rates further (market pricing in 3 cuts in 2025), while the Fed maintains a cautious "higher-for-longer" stance. However, softer PCE expectations may narrow this divergence, favoring EUR/USD.
5. Key Risks and Catalysts Today
U.S. Retail Sales & Industrial Production:
Forecasts suggest a 0.2% MoM decline in retail sales (first drop in 5 months) and slower industrial production growth. Weak data could amplify USD selling.
Tariff Negotiation Updates: Any hints of tariff implementation timelines or retaliatory measures from the EU/China may reignite volatility.
Final Sentiment Summary
Short-Term Bias: Cautiously Bullish for EUR/USD.
Support Factors: Soft PCE expectations, delayed tariffs, and geopolitical optimism.
Investors will monitor retail sales data and tariff rhetoric for intraday momentum shifts. A softer PCE print next week could solidify bullish sentiment, while tariff escalation remains the primary risks.
4H Chart Analysis
1️⃣
🔹Swing Bullish
🔹INT Bearish
🔹Reached Swing Extreme Demand
🔹Swing Continuation
2️⃣
🔹With the deep pullback to the Bullish Swing extreme discount and mitigating the 4H/Daily demand zones, price turned Bullish forming a Bullish CHoCH.
🔹The current Bullish move from Swing extreme discount to current price level having 2 scenarios (Previously I’d the following 2 scenarios where now I favors the 2nd scenario due to the impulsive nature of the move):
Scenario 1: Pullback for Bearish INT Structure and with the recent Bearish CHoCK and Minor Demand zones are failing, I expect Bearish continuation to target the Weak INT Low which aligns with the Daily/Weekly Bearish Structure/Move. (Counter Swing – Pro Internal)
Scenario 2: Bullish Swing continuation to target the Weak Swing High. Which requires to have Demand holding and Supply failing. The first sign required to confirm this scenario will be the current Demand which price is currently at to hold and we form a Bullish CHoCH. (Pro Swing – Counter Internal)
🔹With the recent moves, Supply is failing and Demand is holding solidifying the scenario that the Bullish 4H Swing continuation in play.
🔹Currently price is sweeping Liq. above 30 Jan on 4H and Daily where I’d noted in the previous days analysis which can provide a decent pullback. (Bearish CHoCH is required to confirm the Sweep of Liquidity. Otherwise, it’s not enough and price will continue from the recent 4H Demand formed).
3️⃣
🔹Expectations is set to continue Bullish to target the Weak 4H Swing High. A decent pullback is also expected if the Liq. is enough and market sentiment is aligning with the pullback (Requires market Fear/ Risk-Off).
15m Chart Analysis
1️⃣
🔹Swing Bullish
🔹INT Bullish
🔹Swing Pullback
2️⃣
🔹Swing structures continued Bullish with 2 Bullish BOS yesterday (High Volatility).
🔹The current 15m Bullish structures confirms for me the 4H Bullish Swing continuation and we are targeting high.
🔹After the recent 15m Swing BOS, we expect a pullback.
Current structure doesn’t have much clear demand zone (the 70% of the structure is a 4H Demand zone).
🔹Price expected to have a pullback to the recent demand identified (Not well positioned as it’s in premium) or to structure EQ (50%)/Discount to continue Bullish and target the Weak Swing High.
🔹I want to note that the 4H had swept Liq. above 30 Jan High which could initiate a decent pullback on price after that aggressive move up.
3️⃣
🔹Expectation of price to continue Bullish as long the Swing Low hold and pullbacks are contained within the structure.

Reciprocal tariffs teased, markets react President Donald Trump has just signed a sweeping reciprocal tariff plan. The directive instructs the U.S. to develop new levies on a country-by-country basis but stopped short of implementing any immediate levies.
The Dow reached an intraday high after the market realized the reciprocal tariff process could take weeks or months. In forex, the biggest gainers have been the Japanese yen and the Swiss franc, although the British pound is performing well too.
Wells Fargo predict that the tariffs could slow economic growth this year, describing them as a “modest stagflationary shock”. A study from the Peterson Institute estimates that existing import tariffs on Chinese, Mexican, and Canadian goods already cost the average American household over $1,200 annually, with reciprocal tariffs likely adding to that burden.

$GOLD EASES FROM RECORD HIGHS AHEAD OF U.S. INFLATION DATAGOLD EASES FROM RECORD HIGHS AHEAD OF U.S. INFLATION DATA
1/7
Gold hit a record high of $2,942.70/oz on Feb 11, fueled by safe-haven demand amid fresh U.S. tariffs. Today, it’s dipped 0.2% to $2,892.50 as investors take profits and watch U.S. inflation data. Let’s dig in! 💰⚖️
2/7 – RECENT PRICE ACTION
• All-time high at $2,942.70/oz—sparked by President Trump’s 25% tariffs on steel & aluminum
• Spot gold now at $2,892.50 (↓0.2%), with futures at $2,931.40 (↓0.1%)
• The rally’s paused—are we in for a short breather or a bigger correction? 🤔
3/7 – TARIFF TENSIONS
• 25% tariffs raise global trade war fears, boosting gold’s safe-haven appeal
• Markets worried about inflation, as import costs could climb
• Gold remains a hedge against economic uncertainty and currency devaluation 🌐⛔️
4/7 – MACROECONOMIC DRIVERS
• Fed Chair Powell’s hawkish comments on rate policy sent gold lower—higher rates often weigh on non-yielding assets
• U.S. inflation data (due soon) could shape the Fed’s next move—any upside surprise might strengthen the dollar, pressuring gold further
5/7 – INVESTOR SENTIMENT
• Profit-taking: After a massive run-up, traders might lock in gains
• Safe Haven: Still an underlying bullish sentiment if tariffs escalate
• The $2,900–$2,950 range is in focus—will gold consolidate or stage another breakout?
6/7 Where’s gold heading next?
1️⃣ Above $3,000—safe haven demand remains strong ✨
2️⃣ Sideways around $2,900—pausing for data 🏖️
3️⃣ Back under $2,850—hawkish Fed sinks gold ⬇️
Vote below! 🗳️👇
7/7 – STRATEGY WATCH
• Short-Term: Watch U.S. inflation data & dollar moves—gold typically moves opposite the greenback
• Long-Term: If tariffs stoke inflationary pressure, gold may shine even brighter. Keep an eye on geopolitical developments! 🌎
Gold Wave 5 Bull Complete?! (UPDATE)Gold has been absolutely crazy since market open last night! With a huge 350 PIPS move up on market open, price crashed back down 600 PIPS overnight. This impulse move down is a strong indication the top for Wave 5 could be in.
Time for market structure to form its corrective phase now📉

DeepSeek Is Not What the Market FearsWith the emergence of DeepSeek, tech stocks have generally dropped by 6% over these few short days across all US indices, but from the peak in late November to December, we saw a much more massive drop among all of them.
The Russell 2000, representing small and medium-sized enterprises in the U.S., declined by 12%,
What triggered this sell-off in the tech giants (Nasdaq), the old guards (Dow Jones), the suite of blue-chip stocks (S&P 500), and the medium-sized firms (Russell 2000)?
Markets are inter-connected. What should we be looking out for, and how should we navigate if the market break below this recent all-time low?
E-mini S&P 500 Futures & Options
Ticker: ES
Minimum fluctuation:
0.25 index points = $12.50
Micro E-mini S&P 500 Futures & Options
Ticker: MES
Minimum fluctuation:
0.25 index points = $1.25
Disclaimer:
• What presented here is not a recommendation, please consult your licensed broker.
• Our mission is to create lateral thinking skills for every investor and trader, knowing when to take a calculated risk with market uncertainty and a bolder risk when opportunity arises.
Trading competition: www.tradingview.com
Trading the Micro: www.cmegroup.com
CME Real-time Market Data help identify trading set-ups in real-time and express my market views. If you have futures in your trading portfolio, you can check out on CME Group data plans available that suit your trading needs www.tradingview.com

Gold's Parabolic Momentum After the FOMC CrashGold has entered full acceleration mode, displaying a textbook parabolic move following the recent FOMC-induced volatility. After an initial shakeout that saw weak hands liquidated, price has rebounded with unrelenting bullish momentum, carving out higher highs with surgical precision.
This parabolic curve reflects strong institutional demand, as each shallow dip is aggressively bought up, confirming that buyers remain firmly in control. The angle of ascent is steepening, signaling that we may be entering the euphoric phase of this trend.
Key levels to watch:
📈 If momentum sustains, the next logical targets could be previous key resistance zones or Fibonacci extension levels.
📉 A break of the parabolic curve could signal exhaustion and bring a deeper correction before the next leg up.
Is gold setting up for a blow-off top, or does this rally have more fuel left? Drop your thoughts below! 👇🔥 #Gold #Momentum #FOMC #Trading

Dollar Index Bullish to $111.350 (UPDATE)The Dollar bulls have started this week bullish, alongside Gold. Both markets currently are moving with a positive correlation, which don't happen very often.
We are still within our 'Wave 5' bullish move & we expect this move to carry on towards $111.350✈️

Australia dollar eyes confidence dataThe Australian dollar has started the week with gains. In the North American session, AUD/USD is trading at 0.6275, up 0.60% on the day.
Australia releases business and consumer confidence on Tuesday, with the markets expecting some improvement. Westpac Consumer Sentiment is expected to rebound and gain 0.4% in February after a 0.7% decline in January. The National Australian Bank business confidence index is projected to improve to zero in January, after a -2 reading in December.
China's inflation was a mix, as consumer inflation rose to a five-month high while producer inflation continued to decline. CPI jumped 0.5% y/y in January, up from 0.1% in December and above the market estimate of 0.4%. This was the highest level since August. Monthly CPI rose 0.7%, up sharply from zero in December and an 11-month high, but shy of the market estimate of 0.8%
The producer price index fell 2.3% y/y in January unchanged from December and deeper than the market estimate of 2.1%. This points to deflation which is likely to worsen if the trade war between the US and China continues. On Monday, China's retaliatory tariffs kicked in after the US hit China with tariffs last week.
US nonfarm payrolls decelerate, unemployment falls
US nonfarm payrolls eased to 143 thousand in January, shy of the market estimate of 175 thousand. Still, there weres signs of strength in the labor market - nonfarm payrolls were revised by 100 thousand in the previous two months and the unemployment rate ticked lower to 4% from 4.1%, below the market estimate of 4.1%.
Average hourly earnings rose 0.5%, up from 0.3% in December and above the market estimate of 0.5%. Annually, average hourly earnings rose 4.1%, unchanged from the revised December reading and above the market estimate of 3.8%. The generally positive employment report supports the case for the Federal Reserve continuing to hold rates, possibly until the third quarter. Just a few months ago, it appeared that the Fed would stay aggressive and continue lowering rates into 2025, but with the economy purring along we might see only one or two rate cuts this year.
There is resistance at 0.6351 and 0.6430
There is support at 0.6220 and 0.6141

Gold NEW ATH to $2,912?! (1H UPDATE)ABSOLUTELY BEAUTIFUL move on Gold overnight! Price has pumped up from our supply zone & so far running 370 PIPS in profit. Close to hitting ATH of $2,900🔥
Called this live, so you should all be in this trade & in profit!

$SPY: Three timeframe analysis, One Chart Pattern, Sentiment📢!Hey there!
#Tariffs negative news drives bearish sentiment. Is it just mass media noise? And Mr. Market will continue up?
WHY?
Let's have a look at the charts:
1. 📈We are in a bullish trend on a weekly and monthly basis, meaning long-term and mid-term, yet in a bearish on a daily one, a ka short-term
2. 🤓The bullish Flag pattern has formed. Yeah, I know; how do you qualify it? For this theoretical exercise only visually, but for anything more serious, Bukowski starts, or you may want to run your own tests.
3. 🍒And the cherry on top: Bearish sentiment is significantly higher than the historical average, standing at 42.9% (2/5/2025) compared to 31.0%. On my side, it means that we might be in for a heavy short squeeze for a couple of days.👋Just observations, not advice
For now, enjoy Super Bowl Sunday! 🏈
S ource of the screenshot: AAII Investor Sentiment Survey, www.aaii.com

China - U.S. Tariff Trade War!🩸China has slapped the U.S. with 10% tariffs on Energy products & automobiles as a retaliation🩸
China’s tariffs on U.S. energy & cars will hurt American exporters by reducing demand & pushing down prices, affecting profitability. Energy producers may struggle with oversupply, while automakers like Tesla and Ford face declining sales in China.
The move escalates U.S.-China trade tensions, discouraging investment and increasing market volatility. While lower energy prices could help inflation, job losses in key industries may offset any benefits.
U.S. policymakers might respond with countermeasures. If tensions rise further, a broader trade conflict could emerge, increasing risks for the global economy.

EURUSD 10-14 Feb 2025 W7 - Weekly Analysis - US CPI/PPI/PowellThis is my Weekly analysis on EURUSD for 10-14 Feb 2025 W7 based on Smart Money Concept (SMC) which includes the following:
Market Sentiment
Weekly Chart Analysis
Daily Chart Analysis
4H Chart Analysis
Economic Events for the Week
Market Sentiment
Mixed Labor Market Signals
The February 7 NFP report showed 143K new jobs (below expectations of 170K), signaling potential cooling in the labor market. However, strong wage growth (0.5% MoM, 4.1% YoY) and a 4% unemployment rate (down from 4.1%) suggest lingering inflationary pressures.
Markets may interpret this as a "Goldilocks" scenario: cooling job growth could delay Fed rate hikes, but elevated wage inflation keeps stagflation risks alive.
Tariff Volatility and Trade Uncertainty
Trump’s tariffs (10% on China, delayed 25% on Canada/Mexico) dominate market psychology. While tariffs are a negotiation tool, their sudden implementation and reversal create uncertainty. For example:
Automotive and energy sectors face direct risks due to integrated North American supply chains.
Consumer goods (e.g., electronics, produce) may see price hikes, amplifying inflation fears.
Retaliatory measures from China add to global trade tensions.
Week major news events
Fed’s Powell testifies
ECB Lagarde Speech
US CPI, PPI and Retail Sales
EU GDP
Given the forecasts and the recent NFP report showing slower job growth, market sentiment could be cautious. If the CPI and PPI readings come in higher than expected, it could reinforce concerns about inflation and lead to USD Strength. Investors might seek safe-haven assets.
Conversely, if the CPI and PPI readings are in line with or lower than expectations, it could provide some relief to the markets and support a more positive sentiment which will lead to Weaker USD.
Weekly Chart Analysis
1️⃣
🔹Swing Bearish
🔹Internal Bearish
🔹In Swing Discount
🔹Swing Continuation Phase (Pro Swing + Pro Internal)
2️⃣
🔹INT structure continuing bearish with iBOS following the Bearish Swing. (End of 2023 till end of 2024 was a pullback phase after the first bearish iBOS)
3️⃣
🔹After the bearish iBOS we expect a pullback, price tapped into Monthly Demand and the liquidity below Nov 2022 which is above the weekly demand formed with the initiation of the bearish iBOS pullback phase.
🔹Price made a bullish CHoCH which indicated that the liquidity was enough as per previous week analysis to initiate a pullback phase for the bearish iBOS.
🔹Price pulled back after the Bullish CHoCH to the Weekly Demand formed and showed reaction after a volatile week.
🔹Price still looking bearish to target the Weak INT low to target the Weekly unmitigated demand. Ultimately targeting the Swing Weak Low.
🔹Noticing that the Bearish INT Low didn’t pullback to at least the INT Structure EQ (50%) so there is a chance that price could hold the current Weekly Demand to fulfil the i-BOS pullback phase which will require MTF to confirm this scenario.
🔹Expectation is set to Bearish continuation targeting the Weak INT Low and the unmitigated Weekly Demand.
Daily Chart Analysis
1️⃣
🔹Swing Bearish
🔹INT Bearish
🔹Swing Continuation Phase (Pro Swing + Pro Internal)
2️⃣
🔹Following the Bearish Swing BOS, INT Structure continuing bearish tapping the weekly demand zone.
3️⃣
🔹After the failure to close below the Weak INT Low, price continued bullish sweeping the liquidity above Dec 30 and mitigating a Daily supply zone within the INT Structure Premium Zone.
🔹With the mitigation of the Daily supply, price created a Bearish CHoCH signaling the end of the Pullback Phase of the INT structure and the start of the Bearish move targeting the Weak INT Low.
🔹Price failed for the 2nd time to close below the Weak INT Low after mitigating the Daily Demand formed from the failure to close below the Weak INT Low which triggered aggressive Bullish reaction and mitigating the Daily Supply Zone formed from the recent Bearish CHoCH.
🔹After Supply mitigation, price continued Bearish following the Bearish INT Structure continuation phase.
🔹Expectations is price to continue Bearish to target the Weak INT Low and hopefully we get a confirmed close which is fulfilling the Weekly target of continuing Bearish.
🔹Notice that if the Daily formed a Bullish CHoCH (Currently above the recent mitigated Supply) this will shift my outlook to the Weekly Scenario of a deep pullback of the Weekly INT Structure to at least the Structure EQ (50%). MTF required to shift Bullish to confirm.
4H Chart Analysis
1️⃣
🔹Swing Bullish
🔹INT Bearish
🔹Reached Swing Extreme Demand
🔹Swing Continuation
2️⃣
🔹With the deep pullback to the Bullish Swing extreme discount and mitigating the 4H/Daily demand zones, price turned Bullish forming a Bullish CHoCH.
🔹The current Bullish move from Swing extreme discount to current price level having 2 scenarios:
Scenario 1: Pullback for Bearish INT Structure and with the recent Bearish CHoCK and Minor Demand zones are failing, I expect Bearish continuation to target the Weak INT Low which aligns with the Daily/Weekly Bearish Structure/Move. (Counter Swing – Pro Internal)
Scenario 2: Bullish Swing continuation to target the Weak Swing High. Which requires to have Demand holding and Supply failing. The first sign required to confirm this scenario will be the current Demand which price is currently at to hold and we form a Bullish CHoCH. (Pro Swing – Counter Internal)
3️⃣
🔹Expectations is set to Bearish to target the Weak INT Low as long LTFs are staying Bearish.
Economic Events for the Week

USoil is at right spot to go long !!!Level 70.50 going to be crucial
70-71 being the area which was long before a resistance on higher time frame now could be acting as support which has good probabililty along the way price also tapped into unmitigated demand zone which might be clearing the leftover supply that came from top
on the long side we can aim at the target of 74.50 which is almost 5%
and 77.50 which is 10%
so USOIL could be good bet for swing trade
