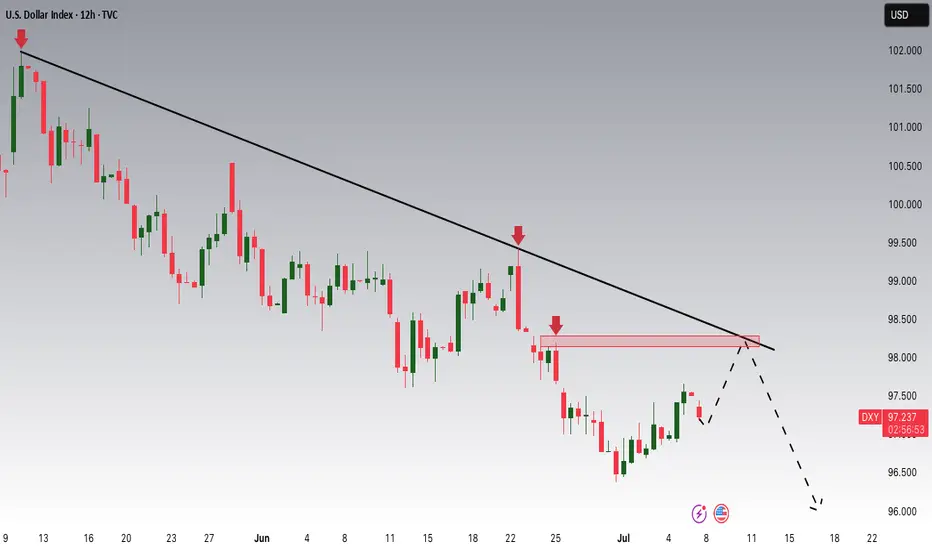
DXY Potential DownsidesHey Traders, in today's trading session we are monitoring DXY for a selling opportunity around 98 zone, DXY is trading in a downtrend and currently is in a correction phase in which it is approaching the trend at 98 support and resistance area.
Trade safe, Joe.
Tariffs
China's PPI slides, Australian dollar steadyThe Australian dollar is almost unchanged on Wednesday. In the European session, AUD/USD is trading at 0.6532, up 0.03% on the day.
China's producer price index surprised on the downside in June, with a steep 3.6% y/y decline. TThe soft PPI report was driven by weak domestic demand and the continuing uncertainty over US tariffs. The lack of consumer demand was reflected in the weak CPI reading of 0.1% y /y, the first gain in four months. Monthly, CPI declined by 0.1%, following a 0.2% drop in May. There was a silver lining as core CPI rose 0.7% y/y, the fastest pace in 14 months.
The uncertainty over US President Trump's tariff policy continues to perplex the financial markets. Trump had promised a new round of tariffs against a host of countries on July 9 but he has delayed that deadline until August 1.
China, the world's second-largest economy after the US, has taken a hit from US tariffs, as China's exports to the US are down 9.7% this year, However, China has mitigated much of the damage as China's exports to the rest of the world are up 6%. There is a trade truce in effect between the two countries but the bruising trade war will continue to dampen US-China trade.
With no tier-1 events out of the US today, the FOMC minutes of the June meeting will be on center stage. The Fed held rates at that meeting and Fed Chair Powell, who has taken a lot of heat from Donald Trump to cut rates, defended his wait-and-see-attitude, citing the uncertainty that Trump's tariffs are having on US growth and inflation forecasts.his was below the May decline of 3.3% and the consensus of -3.2%. China has posted producer deflation for 33 successive months and the June figure marked the steepest slide since July 2023. Monthly, PPI declined by 0.4%, unchanged over the past three months.

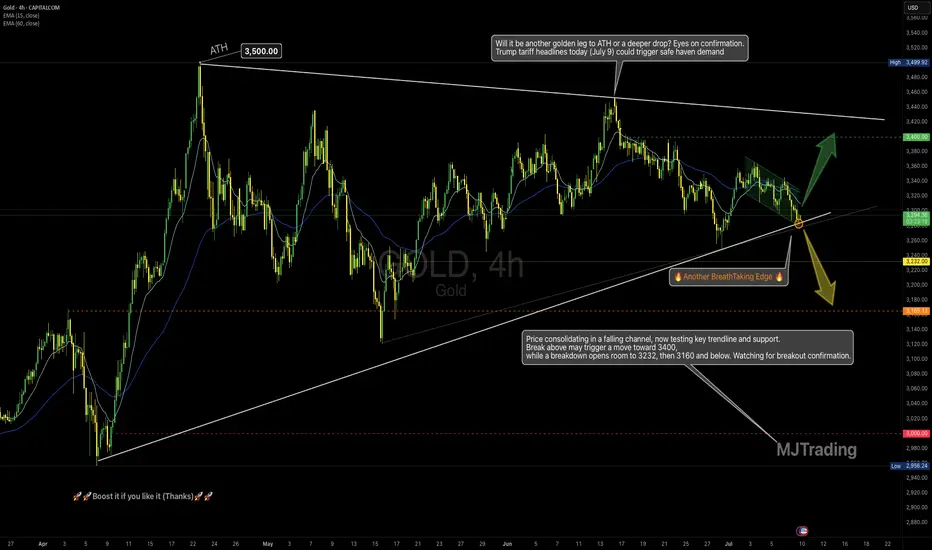
Gold at a Decision Point-Just as Tariff Headlines Return(July 9)📌
4H Technical Outlook by MJTrading
Price is compressing inside a falling channel, nested within a large symmetrical triangle, and now sits right at a high-stakes confluence zone — a perfect intersection of dynamic EMAs, rising trendline support, and local structure.
This could be a pivot point for the next major leg.
🧭 Key Scenarios:
🟢 Bullish Breakout Potential:
If price breaks above the falling channel and holds above $3,310–$3,320:
🎯 Target: $3,400, and eventually upper triangle resistance near $3,480–$3,500
✅ Watch for impulsive breakout + retest confirmation
🟡 Bearish Breakdown Risk:
If the rising trendline gives way and price closes below $3,275 (High Risk) and $3,245(Low Risk):
🎯 Targets: First $3,232, then key level $3,166
⚠️ Further weakness may expose $3,000 psychological support
🔍 Why It Matters:
• Symmetry + compression = potential volatility expansion
• Trump tariff headlines today (July 9) could trigger safe haven demand
• Strong historical respect of these trendlines
• EMAs aligning around decision zone
“Another BreathTaking Edge” — because this is one of those moments where market structure whispers louder than words.
🗣 Boost if you find value, and follow MJTrading for more clean setups.🚀🚀
#XAUUSD #Gold #TradingView #TechnicalAnalysis #ChartPatterns #PriceAction #BreakoutTrade #Forex #MJTrading
Zoom in to get closer to battlefield:
Zoom out to see where we are:
Review and plan for 9th July 2025Nifty future and banknifty future analysis and intraday plan.
This video is for information/education purpose only. you are 100% responsible for any actions you take by reading/viewing this post.
please consult your financial advisor before taking any action.
----Vinaykumar hiremath, CMT

Quick take on DAXTariffs, no tariffs, tariffs, no tariffs... Let's look at the technical picture...
XETR:DAX
MARKETSCOM:GERMANY40
Let us know what you think in the comments below.
Thank you.
77.3% of retail investor accounts lose money when trading CFDs with this provider. You should consider whether you understand how CFDs work and whether you can afford to take the high risk of losing your money. Past performance is not necessarily indicative of future results. The value of investments may fall as well as rise and the investor may not get back the amount initially invested. This content is not intended for nor applicable to residents of the UK. Cryptocurrency CFDs and spread bets are restricted in the UK for all retail clients.

ES1! S&P500 Might Lose Momentum As Tariffs Deal Not Set...price could probably be testing all time highs. Before plunging....
if the volumes comes with it and reaches the all times high levels, that could be a nice short entry point for potential profits.
Otherwise, it could probably just fill the gap on week open and keep going down in a regular pattern until August as Trumps Tariffs Deals deadline is around that time possiblily...

Tariff and oil volatility converge on July 9 Tuesday, July 9 marks a key deadline for two major market-moving events.
Tuesday is the official deadline for U.S.–EU trade negotiations. While a full deal is off the table, the EU hopes to secure a last-minute "agreement in principle" to avoid a threatened 50% U.S. tariff on some European exports.
President Trump’s history of moving deadlines adds uncertainty. Traders might like to watch for sharp intraday moves in EUR/USD and European equities tied to tariff risk.
OPEC’s International Seminar also kicks off on the 9th in Vienna. Energy ministers and CEOs from BP, Shell, and others will speak on oil supply, investment, and long-term strategy.
Crude has been volatile in July, and any signs of supply shifts or policy changes could drive WTI and Brent in either direction.

DXY Quite IndecisivePrice on TVC:DXY after having broken below the Swing Low on June 12th @ 97.602 has created a lot of Indecision!
Starting with a 5 Day Long Consolidation period as a Rectangle Pattern
Then after the Bearish Breakout on June 30th due to the Federal Reserve mentioning possibly leaning towards Interest Rate Cuts, we see the TVC:DXY form a Expanding Range
Now at the Swing Low and above all the Consolidation or Indecision, we see a Volume Imbalance in the 97.5 - 97.6 area.
Fundamentally, USD has been mostly beating expectations with:
- Manufacturing and Services PMI's showing Expansion
- Job Openings higher then expected
- Unemployment Claims Low
- Unemployment Rate dropping ( 4.1% )
- Factory Orders Rising
Non-Farm Employment however hurt USD with -33K instead of the 99K forecasted
With all the Tariff uncertainties and how they will affect Inflation continues to worry markets with only a few deals having been ironed out, like the 20% Tariff on Vietnam ( down from 46% ) before the July 9th Deadline.
www.tradingview.com
Now with good Employment News out with numbers showing Strong Job Reports, this eases labor fears and could help remove some of the expectations of the amount of Interest Rate cuts this year.
www.tradingview.com
www.tradingview.com

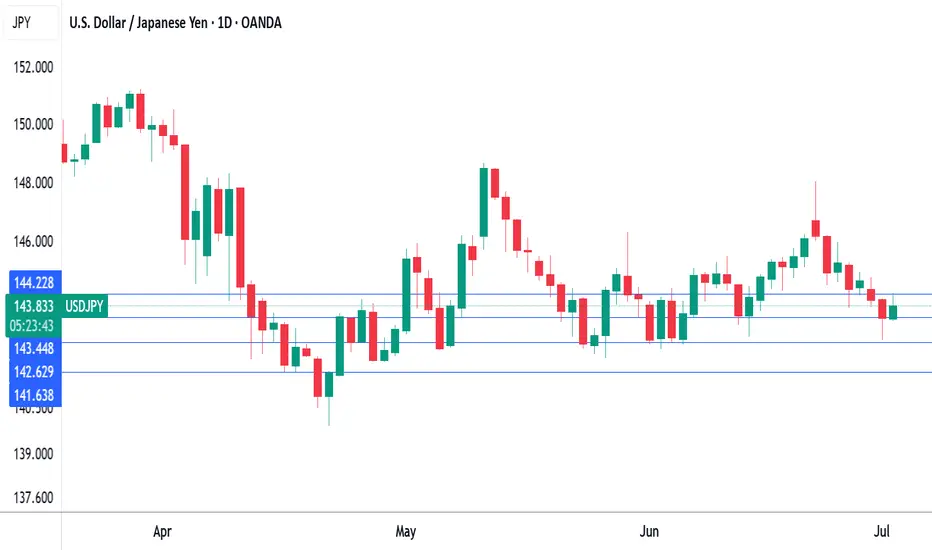
Trump threatens tariff on Japan as deadline looms, yen dipsThe Japanese yen is negative ground on Thursday. In the North American session, USD/JPY is trading at 144.06, up 0.47%.
The US and Japan are racing to reach a trade deal before a deadline of July 9. There are some serious roadblocks to a deal, including the current US tariff of 25% on Japanese cars and opening Japan's agricultural sector, particularly rice. President Trump has insisted that Japan import American-grown rice, but the Japanese government says that is unacceptable.
Japan's Economy Minister Ryosei Akawaza said earlier this week that Japan would not "sacrifice the agricultural sector", while Farm Minister Shinjiro Koizumi said that foreign rice imports would threaten Japan's food security.
It's a shortened week in the US due to the Fourth of July holiday on Friday. The US will release the June employment report on Thursday, with all eyes on nonfarm payrolls.
Nonfarm payrolls eased slightly in May to 137 thousand from 147 thousand and the downward trend is expected to continue, with a consensus of 110 thousand for June. This would mark the weakest pace of job growth since 2020, with the exception of a meltdown in job growth in Oct. 2024.
The Federal Reserve will also be monitoring the nonfarm payroll report. The US labor market has been weakening and the Fed is concerned that the jobs market could show a sharp deterioration. Currently, the most likely date for the next Fed rare cut is September, but a soft NFP reading south of 90 thousand would boost the case for a cut at the July 30 meeting.
The Fed has maintained a wait-and-see stance since Nov. 2024 but that is expected to change in the fourth quarter, where we could see up three rate cuts.
Is Japan's Economic Future at a Tariff Crossroads?The Nikkei 225, Japan's benchmark stock index, stands at a critical juncture, facing significant pressure from potential US tariffs of up to 35% on Japanese imports. This assertive stance by US President Donald Trump has already triggered a notable decline in Japanese equities, with the Nikkei 225 experiencing a 1.1% drop and the broader Topix Index falling 0.6% on Wednesday, marking consecutive days of losses. This immediate market reaction, characterized by a broad-based selloff across all sectors, underscores profound investor concern and a pre-emptive pricing-in of negative outcomes, particularly for the highly vulnerable automotive and agricultural sectors.
The looming July 9 deadline for a trade agreement is pivotal, with President Trump explicitly stating his intention not to extend the current tariff pause. These proposed tariffs would far exceed previous rates, adding substantial financial burdens to industries already facing existing levies. Japan's economy, already struggling with a recent contraction in GDP and persistent declines in real wages, is particularly susceptible to such external shocks. This pre-existing economic fragility implies that the tariffs could amplify existing weaknesses, pushing the nation closer to recession and intensifying domestic discontent.
Beyond immediate trade concerns, Washington appears to be leveraging the tariff threat to compel allies like Japan to increase military spending, aiming for 5% of GDP amidst rising geopolitical tensions. This demand strains the "ironclad" US-Japan military alliance, as evidenced by diplomatic setbacks and Japan's internal political challenges in meeting such ambitious defense targets. The unpredictable nature of US trade policy, coupled with these geopolitical undercurrents, creates a complex environment where Japan's economic stability and strategic autonomy are simultaneously challenged, necessitating significant strategic adjustments in its international relationships.

Yen rises sharply, Tokyo Core CPI nextThe Japanese yen has posted strong gains on Thursday. In the North American session, USD/JPY is trading at 144.14, down 0.55% on the day. Earlier, USD/JPY fell as low as 143.75, its lowest level since June 13.
Tokyo Core CPI, a leading indicator of nationwide inflation trends, will be released early Thursday. Tokyo Core CPI hit 3.6% in May, its highest level in over two years. The market estimate for June stands at 3.3%.
The Bank of Japan has signaled that more rate hikes are on the way, provided that inflation continues to move towards the BoJ's level of a sustainable 2%. However, trade talks between the US and Japan have hit a snag, with Japan saying it can't accept US tariffs of 25% on automobiles. The clock is ticking, as US reciprocal tariffs will take effect on July 9 without a deal.
The markets are eyeing a possible rate hike in July, which would be the first rate hike since January. The BoJ meets next on July 31, and if the two sides can reach a trade deal before then, it could cement a rate hike at that meeting. Even if the BoJ maintains rates at the upcoming meeting, investors will be keen to see the new inflation and growth forecasts.
The BOJ's summary of opinions from the June meeting, released Wednesday, didn't provide much insight into the BoJ's rate path. Board members were divided over whether to raise rates in a period of economic uncertainty over the impact of US tariffs on Japan's economy.
There is support at 144.59 and 143.93
145.27 and 145.93 are the next resistance lines

DXY Ready to Reload? Eyes on 99.100 as Tariff Tensions Ease!!Hey Traders, In tomorrow's trading session, we're closely monitoring the DXY for a potential buying opportunity around the 99.100 zone. After trending lower for a while, the dollar index has successfully broken out of its downtrend and is now entering a corrective phase.
We’re watching the 99.100 support/resistance area closely, as it aligns with a key retracement level making it a strong candidate for a bullish reaction.
On the fundamental side, Friday's NFP data came in slightly above expectations, which is typically USD-positive. In addition, recent Trump-led de-escalation in U.S.-China tariff tensions is another supportive factor for the dollar.
Trade safe, Joe.

Gold: Easing China Tensions Could Weigh on XAUUSD Prices!!!Hey Traders, in the coming week we are monitoring XAUUSD for a selling opportunity around 3,340 zone, Gold was trading in an uptrend and currently is in a correction phase in which it is approaching the retrace area at 3,340 support and resistance area.
Trade safe, Joe.

Can P&G Weather the Economic Storm?Procter & Gamble, a global leader in consumer goods, currently faces significant economic turbulence, exemplified by recent job cuts and a decline in its stock value. The primary catalyst for these challenges stems from the Trump administration's tariff policies, which have directly impacted P&G's supply chain by increasing costs for raw materials and finished goods imported from China. This financial burden, estimated to be hundreds of millions of dollars, compels P&G to reassess sourcing strategies, enhance productivity, and potentially raise product prices, risking a reduction in consumer demand.
In response to these escalating pressures and a noticeable slowdown in category growth rates within the U.S., P&G has initiated a substantial restructuring program. This includes the elimination of up to 7,000 jobs, representing approximately 15% of its non-manufacturing workforce, over the next two years. The company also plans to discontinue sales of certain products in specific markets as part of its broader strategic adjustments. These decisive measures aim to safeguard P&G's long-term financial algorithm, although executives acknowledge they do not alleviate immediate operational hurdles.
Beyond the direct impact of tariffs, a pervasive sense of economic uncertainty and declining consumer confidence in the U.S. further complicates P&G's operating environment. Recent data indicates a sustained drop in consumer sentiment, directly influencing discretionary spending and prompting households to become more cautious with their purchases. This shift, combined with broader negative economic indicators such as rising jobless claims and increased layoffs across various sectors, creates a challenging landscape for companies reliant on robust consumer spending. P&G's immediate future hinges on its strategic agility in mitigating tariff impacts, managing pricing, and adapting to a volatile economic climate.

What is the TACO trade in forex trading? The “TACO trade” – short for “Trump Always Chickens Out” – originated in equity markets but is equally relevant in forex. The pattern is simple: Trump signals aggressive tariffs, markets react and then reverse when the threat is walked back.
One example: In May 2025, the U.S. dollar weakened sharply after Trump announced a 50% tariff on EU imports. EUR/USD rallied to 1.1440 as traders priced in slower U.S. growth. But just days later, the Trump delayed the tariffs to July, and the dollar quickly regained ground.
For forex traders, the TACO trade strategy is about timing: entering on initial panic and exiting on the rollback.
That said, it’s not without risk. If tariffs are actually enforced, the dollar’s decline may be more prolonged. And with markets increasingly aware of this pattern, reactions may become less predictable.

Gold Breakout and Potential RetraceHey Traders, in today's trading session we are monitoring XAUUSD for a buying opportunity around 3,330 zone, Gold was trading an a downtrend and successfully managed to break it out. Currently is in a correction phase in which it is approaching the retrace area at 3,330 support and resistance zone.
Trade safe, Joe.

Do bulls have enough steam to drive gold higher?A lot of things to consider this week, a lot of data and geopolitical tensions. Will the economic uncertainty and potential bad US jobs data drive TVC:GOLD higher? Let's dig in.
FX_IDC:XAUUSD
Let us know what you think in the comments below.
Thank you.
77.3% of retail investor accounts lose money when trading CFDs with this provider. You should consider whether you understand how CFDs work and whether you can afford to take the high risk of losing your money. Past performance is not necessarily indicative of future results. The value of investments may fall as well as rise and the investor may not get back the amount initially invested. This content is not intended for nor applicable to residents of the UK. Cryptocurrency CFDs and spread bets are restricted in the UK for all retail clients.

Japan core inflation hits two-year high, yen gains groundThe yen is higher on Friday. Iin the European session, USD/JPY is trading at 143.63, down 0.37% on the day.
Tokyo core CPI climbed to 3.6% y/y in May, up from 3.4% in April and above the market estimate of 3.5%. This marked the highest level since Jan. 2025. Tokyo core inflation is viewed as the leading indicator of nationwide inflation trends and is closely monitored by the Bank of Japan. Tokyo core CPI, which excludes fresh food, was driven higher due to due higher non-fresh food prices, particularly rice which has soared 93% over the past year.
The jump in core CPI bolsters the case for a BoJ rate hike. The markets had anticipated a rate hike in October but today's strong inflation report could accelerate the timing of the next rate hike. At the same time, the uncertainty caused by US trade policy may force the BoJ to delay any rate hikes until the impact of US tariffs on Japan's economy becomes clearer.
US President Trump's controversial tariffs have sent the financial markets on wild swings. Now, US courts are weighing in on whether Trump exceeded his authority when he imposed the tariffs. A trade court panel ruled this week that most of the tariffs were illegal but on Thursday, an appeals court granted the Trump administration a temporary pause, keeping the tariffs in effect.
The legal fight over the tariffs has just begun and could go all the way to the US Supreme Court. In the meantime, the legal challenge has blown a hole in Trump's tariff policy and is causing even more uncertainty in the financial markets.

The tariff legal zig-zagWith different US courts firing "shots" at each other over the legality of tariffs, the market is taking a bit of a pause from accelerating further. Let's dig in!
DJ:DJI
TVC:SPX
TVC:NDQ
TVC:DXY
Let us know what you think in the comments below.
Thank you.
77.3% of retail investor accounts lose money when trading CFDs with this provider. You should consider whether you understand how CFDs work and whether you can afford to take the high risk of losing your money. Past performance is not necessarily indicative of future results. The value of investments may fall as well as rise and the investor may not get back the amount initially invested. This content is not intended for nor applicable to residents of the UK. Cryptocurrency CFDs and spread bets are restricted in the UK for all retail clients.

New Zealand central bank sees less growth, FOMC says it will remThe New Zealand dollar declined as much as 0.67% earlier but has recovered. In the European session, NZDS/USD is trading at 0.5969, up 0.04% on the day.
A day after the Reserve Bank of New Zealand lowered interest rates, Governor Christian Hawkesby testified before a parliamentary committee on Thursday. Hawkesby said the central bank could hold rates in July and that rate decisions would be data-dependent. The Governor said he expected slower global growth would dampen New Zealand's recovery and there was uncertainty around the impact of the US tariffs.
The RBNZ has been aggressive, chopping 225 basis points in the current easing cycle, which has brought the cash rate down to 3.25%, its lowest level in almost three years. At yesterday's meeting, the RBNZ said that the cash rate was currently in a neutral zone, where it neither stimulates nor curbs economic growth.
FOMC minutes: Increasing uncertainly could mean "difficult tradeoffs"
In the FOMC minutes of the May 7 meeting, members expressed concern about the government's fiscal and trade policy. Members said that "uncertainty about the economic outlook had increased further", making it appropriate to remain cautious until these policies became clearer. Members warned that if inflation remained high and growth and employment weakened, the Fed might have to make "difficult tradeoffs".
There was another twist to the Trump tariffs saga as the US Court of International Trade declared the tariffs illegal. The Court ruled that Trump had exceeded his authority by imposing wide-sweeping tariffs against US trading partners. The decision puts a hold on the tariffs, but that may not last long as the US Justice Department has filed an appeal.

Australian inflation higher than expected, Aussie extends lossesThe Australian dollar has extended its losses on Wednesday. AUD/USD is trading at 0.6415 in the North American session, down 0.44% on the day.
Australia's inflation rate remained unchanged in April at 2.4% y/y for a third straight month, matching the lowest rate since Nov. 2024. The reading was slightly higher than the market estimate of 2.3% but remained within the central bank's inflation target of 2%-3%. Trimmed mean inflation, the central bank's preferred indicator for underlying inflation, edged up to 2.8% from 2.7% in March.
The inflation report was mildly disappointing in that inflation was hotter than expected. Underlying inflation has proven to be persistent which could see the Reserve Bank of Australia delay any rate cuts.
The markets have responded by lowering the probability of a rate cut in July to 62%, compared to 78% a day ago, according to the ASX RBA rate tracker. A key factor in the July decision will be the second-quarter inflation report in late July, ahead of the August meeting.
The Reserve Bank lowered rates last week by a quarter-point to 3.85%, a two-year low. The central bank left the door open to further cuts, as global trade uncertainties are expected to lower domestic growth and inflation.
The Federal Reserve releases the minutes of its May 7 meeting later today. At the meeting, the Fed stressed that it wasn't planning to lower rates anytime soon and the minutes are expected to confirm the Fed's wait-and-see stance.
US President Trump has been zig-zagging on trade policy, imposing and then cancelling tariffs on China and the European Union. Fed Chair Powell said at the May meeting that the economic uncertainty due to tariffs means that the appropriate rate path is unclear and that message could be reiterated in the Fed minutes.

Weekly $SPY / $SPX Scenarios for May 27–30, 2025🔮 Weekly AMEX:SPY / SP:SPX Scenarios for May 27–30, 2025 🔮
🌍 Market-Moving News 🌍
🇺🇸 Tax-and-Debt Debate Rattles Markets
Washington’s push to advance a massive tax-cut and spending bill—projected to add $3.8 trillion to an already $36.2 trillion debt—has investors questioning U.S. fiscal discipline. The dollar weakened further, while Treasury yields remain elevated on credit-rating concerns and deficit fears
⚖️ Trump Delays EU Tariffs, Lifts Sentiment
President Trump pushed back 50% tariffs on EU goods from June 1 to July 9 after talks with EU leaders. U.S. futures jumped, and global markets breathed easier despite lingering trade-policy uncertainty
📈 Bond Yields Spike, Then Stabilize
Both 20- and 30-year Treasury yields jumped above 5.1% before easing slightly as auction demand picked up. Fed officials signaled they expect to hold rates steady for the next two meetings, putting a floor under yields
📊 Key Data Releases 📊
📅 Tuesday, May 28:
9:00 AM ET: Case-Shiller Home Price Index
10:00 AM ET: Consumer Confidence (May)
📅 Wednesday, May 29:
8:30 AM ET: Advance Q1 GDP
8:30 AM ET: Personal Income & Spending (April)
📅 Thursday, May 30:
8:30 AM ET: PCE Price Index (April)
10:00 AM ET: Pending Home Sales (April)
⚠️ Disclaimer:
This information is for educational and informational purposes only and should not be construed as financial advice. Always consult a licensed financial advisor before making investment decisions.
📌 #trading #stockmarket #economy #news #trendtao #charting #technicalanalysis

$ETH - Ethereum enters buy zoneHey traders!
How is your portfolio doing? Trump is shaking us!
After all these months in 2025 I've tried to project a new scenario (bullish/bearish) that clarifies our next outlook.
Not an easy job. As you see day by day, markets are in high volatility due to trade war and (not trying to be pesimistic) could be worse.
However, In my opinion Ethereum (and altcoin markets) are entering into a golden opportunity. that has to be taken 100%. Don't know where is the bottom for CRYPTOCAP:ETH on a short scenario. But, what I can certainly say is that won't fall as a stone for too long.
Ranges between 1400 - 2000 USD are gold prices to make progressives buys. Although it could fall even more ( 900 - 1200 USD) I think this is a high Risk reward buy.
But, timing is not on time. Shouldn't I sell, expecting a bear market( you know Halving and Posthalving ideas). Times have changed as the macro scenario has not been the same as the previous bullruns.
So, it's time to accumulate and expect a possible expansion cycle in 2026.. That could lead Ethereum to prices never seen before. Yes, the range between 8.000 - 15.000 USD.
As I always say. Just my opinion. Stay safe!
