SPX 6300 Highs to 6200 Lows - Watch Key LevelsThis week earnings season kicks off
-Notables include JPM, GS, BAC, WFC, NFLX, KMI, PEP and others
US Inflation (CPI and PPI) this week
-forecasts are showing HIGHER inflation
-consumers care, but markets may not
6300-6350 key resistance area for SPX
6200 key support area for SPX
If we break the 6200 floor, there's room to fall to 6000-5700 to find stronger support
I discuss the 50 day moving averarages on the S&P and Nasdaq as levels to watch
For the remainder of the month...
7/18 July Monthly Expiration
7/30 US FOMC (with Press Conference)
8/1 US Non-Farm
8/1 US Tariff Deadline (per Trump)
Markets will have to really love a slew of good earnings and good news to see more highs and melt-ups through this typically bumpy season (Aug-Sep)
Thanks for watching!!!
Tariffwar

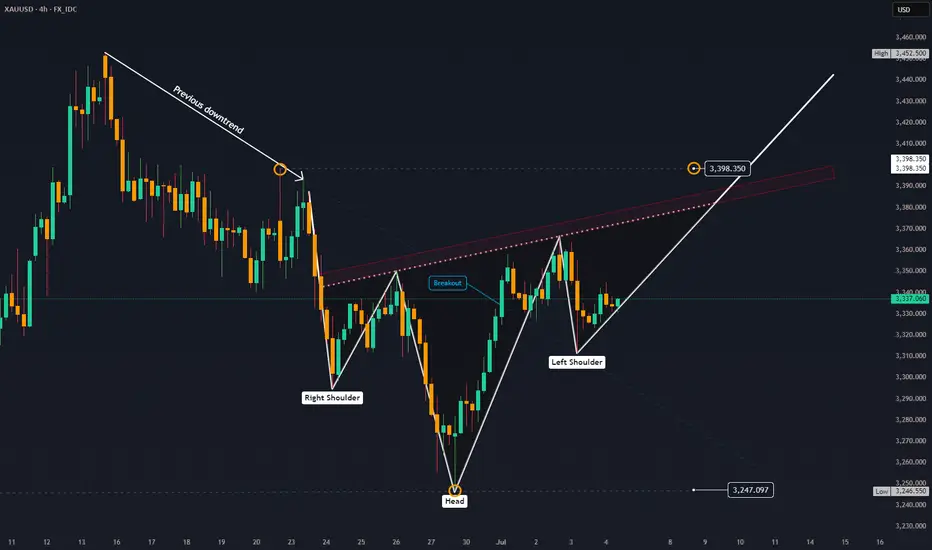
Looking for catalysts - Gold Outlook July 7 - July 11, 2025All about last week you can find here:
FX_IDC:XAUUSD Gold is currently seeking fresh catalysts this week. 🧐
While the economic calendar appears light for this time of year, a lack of economic data doesn't mean nothing is happening. Geopolitical events, especially tariff wars or other flashpoints, remain significant. Are there increasing signs for peace in the Middle East between Israel and Hamas? 🕊️
This week Gold could take advantage from an exisiting reversal head and shoulders pattern and painting pitchfork in the chart shows possibillities for Upside targeting $3400.
## Geopolitical News Landscape 🌍📰
Israel / Iran ⚔️🛑☢️
After fierce clashes in June, a **ceasefire** began June 24. 🇮🇷 Iran's Supreme Leader reappeared July 6, claiming victory 🎤. Tehran has now **banned IAEA inspectors** ❌🔍. Over 900 Iranians reportedly killed ⚰️.
🔮 Outlook: ⚠️ Nuclear tensions growing, diplomacy frozen 🧊. Regional powers remain on high alert 🚨.
India / Pakistan 🗻🔫🕌
Tense calm in Kashmir 😐. India launched its sacred **Amarnath Yatra** 🕉️ under heavy security 🛡️. Pakistan killed 30 militants near the Afghan border ⚔️, while China 🐉 admitted sharing intel 📡.
🔮 Outlook: Diplomatic track stays open 🕊️, but **border flare-ups** and water disputes 💧 remain volatile 🔥.
Gaza Conflict 💣🏘️🕊️
Israel launched deadly airstrikes ✈️, including one on a beach café ☕🏖️ killing 22. Dozens more died 💔. IDF admitted accidental strikes on aid sites 🚚❌. U.S.-led talks seek a **60-day truce** 🤝.
🔮 Outlook: Ceasefire possible 🛑, but **humanitarian crisis** worsening 🚨🩺. Trust remains fragile 💔.
Russia / Ukraine ⚔️
Zelenskyy 🇺🇦 and Trump 📞 discussed new air defense aid 🎯. Russia answered with **massive drone strikes** on Kyiv 🚁🔥. NATO boosts arms shipments 🔫 and backs Ukraine’s domestic weapons production 🏭.
🔮 Outlook: War grinds on ⚙️. No peace in sight, with **global stakes** rising 📈.
U.S. / China Trade War 💼📦🔥
With new tariffs looming 📆💣, Treasury said “multiple deals” are near 🤝. Trump claimed a **partial deal with China** 🐉, though tariffs remain high 📊.
🔮 Outlook: More piecemeal deals 🍰, but a **full-scale trade reset** looks unlikely before elections 🗳️.
🌍 Global Trade War 📉🚢💸
Trump’s shifting tariffs 🎯 hurt global growth 🌐. Markets hit record highs 📈 but investment chills ❄️. The 💵 dollar had its sharpest 6-month drop 📉 in decades.
🔮 Outlook: Businesses remain cautious ⚠️. **Supply chains** reroute 🔄. No global rebound without clarity 🔍.
Trump vs. Powell 💥🏛️📉
Trump demanded Powell’s resignation ❌📉, accusing him of weak rate policy 📊. Powell held firm 🧊, citing inflation risks 📈. Trump eyes replacements 👀🪑.
🔮 Outlook: Fed independence 🏛️ under fire 🔥. **Rate policy** may get politicized ahead of 2025 elections 🗳️.
📈 U.S. Inflation 🛒💰🧾
Inflation slowed to 0.1% 🐢, but tariffs raised prices on appliances 🔌 (+4.3%) and toys 🧸. Fed projects 3% inflation by year-end 📊.
🔮 Outlook: As **tariffs bite** 🦷, inflation likely to climb 📈. Fed stays cautious 🧐 on cuts.
Technical View 📐📈
Analysis Period: May 25 - June 6, 2025 | Forecast: June 7-11, 2025
1. ICT (Inner Circle Trader) Methodology Analysis 🧠
Market Structure
Higher Timeframe Bias: The chart shows a clear bullish market structure with higher highs and higher lows from the major low around 3,250. 🐂
Current Structure: Price is in a consolidation phase after reaching highs near 3,370, showing potential distribution. ⚖️
Key ICT Concepts Identified:
Fair Value Gap (FVG): Multiple gaps visible during the strong rally from 3,250 to 3,370. 💨
Order Blocks: Significant demand zone around 3,250-3,260 level (major accumulation area). 📦
Liquidity Zones:
Buy-side liquidity above 3,370 (recent highs). 💸
Sell-side liquidity below 3,320 (recent consolidation lows). 📉
Market Maker Models: Classic accumulation-manipulation-distribution pattern visible. 🔄
Session Analysis:
London Session: Shows strong directional moves. 🇬🇧
New York Session: Continuation of trends with increased volatility. 🗽
Asian Session: Consolidation and range-bound behavior. 🌏
2. Gann Analysis 🧙♂️
Gann Angles & Time Cycles:
Primary Trend: 1x1 angle supporting the bullish move from 3,250. ↗️
Resistance Angles: 2x1 and 3x1 angles providing resistance around current levels. 🚧
Time Cycles:
7-day cycle showing completion around June 2-3. 🗓️
14-day cycle suggesting potential reversal window June 7-9. ⏳
Gann Price Levels:
Major Support: 3,250 (1/8 level). 🛡️
Current Resistance: 3,370 (7/8 level). 🛑
Next Target: 3,400 (full octave completion). 🎯
Geometric Relationships:
Price squared relationship suggests 3,380-3,400 as natural resistance. 📐
Time-price balance indicates consolidation period before next major move. 🕰️⚖️
3. Fibonacci Analysis ✨
Retracement Levels (from 3,250 low to 3,370 high):
23.6%: 3,341.6
38.2%: 3,324.2
50.0%: 3,310.0
61.8%: 3,295.8
78.6%: 3,265.6
Extension Levels:
127.2%: 3,402.6
161.8%: 3,444.2
200.0%: 3,490.0
Current Analysis:
Price has respected the 23.6% retracement level multiple times. ✅
Strong support confluence at 38.2% level (3,324). 💪
Extension targets suggest potential move to 3,402-3,444 range. 🚀
4. Institutional Levels Analysis 🏦
Psychological Levels:
3,300: Major round number providing support. 💯
3,350: Mid-level resistance. 📊
3,400: Next major psychological target. 🎯
Institutional Order Flow:
Accumulation Zone: 3,250-3,280 (heavy institutional buying). 💰
Distribution Zone: 3,350-3,370 (profit-taking area). 💸
Breakout Target: 3,400+ (next institutional objective). ⬆️
Volume Analysis:
High volume on the initial move up from 3,250. 📈
Decreasing volume during consolidation (typical distribution pattern). 📉
Volume expansion needed for breakout confirmation. 💥
5. Cycle Timing Analysis ⏰
Short-Term Cycles:
3-day cycle: Currently in compression phase. 🤏
7-day cycle: Completed around June 2-3. ✅
14-day cycle: Due for completion June 7-9. ⏳
Medium-Term Cycles:
Monthly cycle: Bullish momentum phase. ⬆️
Quarterly cycle: In expansion phase. 🌟
Cycle Projection:
Next major cycle turn expected June 7-9. 🔄
Potential for either breakout or correction during this window. 🤞
6. FORECAST: June 7-11, 2025 🔮
Primary Scenario (60% probability): Bullish Breakout 🚀
Target 1: 3,400-3,410
Target 2: 3,440-3,450
Catalyst: Break above 3,370 with volume. 💥
Timeline: June 7-9 initial move, June 10-11 extension.
Secondary Scenario (35% probability): Corrective Pullback ⬇️
Target 1: 3,320-3,325 (38.2% Fibonacci)
Target 2: 3,300-3,310 (psychological support)
Catalyst: Failure to break 3,370 resistance. 🚫
Timeline: June 7-8 decline, June 9-11 consolidation.
Low Probability Scenario (5% probability): Deep Correction 📉
Target: 3,280-3,290 (61.8% Fibonacci)
Catalyst: Major risk-off sentiment. 😱
Timeline: Extended throughout the week.
7. Key Assumptions & Risk Factors 🤔
Bullish Assumptions:
Continued institutional accumulation at current levels. 🏦
Breakout above 3,370 with confirming volume. ⬆️
Favorable macroeconomic backdrop for gold. 🌍
Weakness in USD supporting gold prices. 💵
Geopolitical tensions maintaining safe-haven demand. 🕊️
Bearish Risk Factors:
Profit-taking at psychological 3,400 level. 🤝
Stronger USD due to economic data. 💹
Reduced safe-haven demand. 📉
Technical failure at key resistance levels. 🚧
Central bank policy shifts. 🏛️
8. Trading Recommendations 💡
Entry Strategies:
Bullish Setup: Buy on pullback to 3,340-3,345 with stop below 3,320. 🎯
Breakout Play: Buy break above 3,372 with stop below 3,350. 🚀
Conservative: Wait for retest of 3,324 support area. patiently 🧘
Risk Management:
Position Size: Limit to 2-3% of portfolio per trade. 📏
Stop Loss: Always use stops below key support levels. ⛔
Take Profit: Scale out at Fibonacci extension levels. 💰
Key Levels to Watch:
Immediate Resistance: 3,365-3,370 🛑
Support: 3,340-3,345 🛡️
Breakout Level: 3,372 🚀
Major Support: 3,320-3,325 💪
9. Conclusion ✅
The XAUUSD chart presents a constructive bullish setup with multiple confluences supporting higher prices. The completion of various cycles around June 7-9 suggests a potential catalyst for the next major move. While the primary bias remains bullish targeting 3,400+, traders should remain alert to the possibility of a corrective pullback to test lower support levels. 🧐
The institutional accumulation pattern, combined with favorable Gann angles and Fibonacci projections, supports the bullish thesis. However, proper risk management is essential given the potential for volatility around key psychological levels. ⚠️
Please take the time to let me know what you think about this. 💬
-------------------------------------------------------------------------
This is just my personal market idea and not financial advice! 📢 Trading gold and other financial instruments carries risks – only invest what you can afford to lose. Always do your own analysis, use solid risk management, and trade responsibly.
Good luck and safe trading! 🚀📊
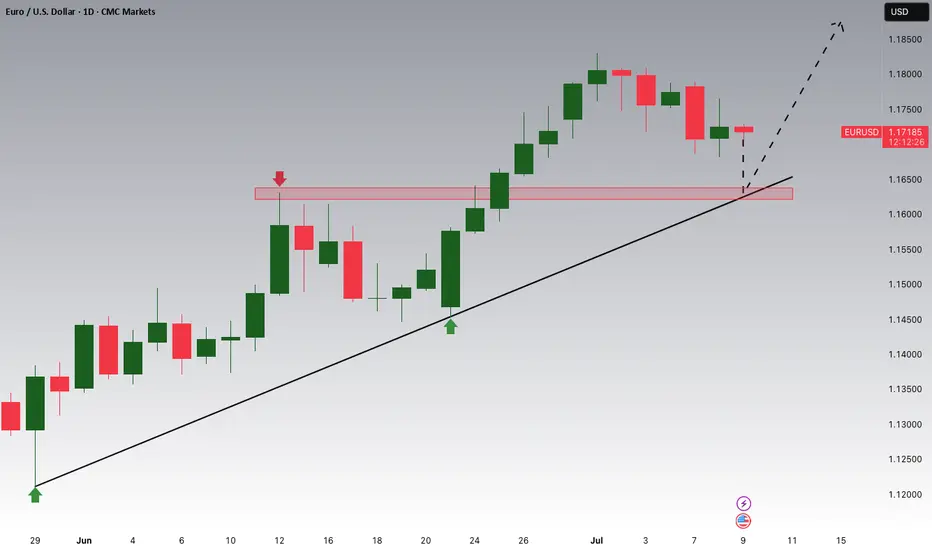
EURUSD is Approaching an Important Support!!Hey Traders, in today's trading session we are monitoring EURUSD for a buying opportunity around 1.16400 zone, EURUSD is trading in an uptrend and currently is in a correction phase in which it is approaching the trend at 1.16400 support and resistance area.
Trade safe, Joe.
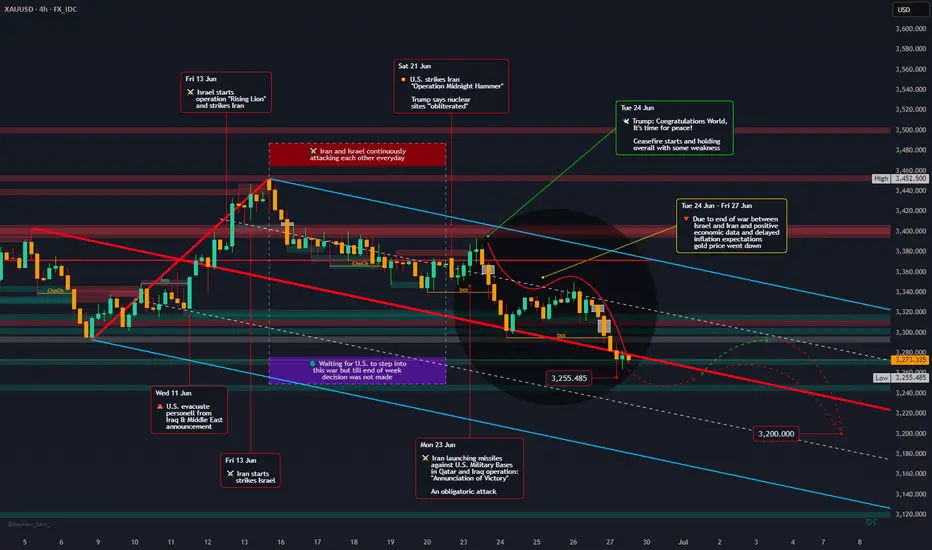
Down the road - Gold Outlook June 30 - July 24, 2025FX_IDC:XAUUSD
📰 The past weeks has been a wild ride for gold prices, caught between the fiery conflict in the Middle East and a deluge of crucial economic data from the U.S. 📈 Adding to this, a detailed technical analysis provides a deeper look into gold's immediate future.
**Geopolitical Drama Unfolds & Peace Prevails!** 🕊️ ceasefire negotiations.
Initially, gold was shrouded in uncertainty 🌫️ due to the Iran-Israel war, with markets bracing for potential U.S. involvement and a full-blown escalation. Daily tit-for-tat attacks between Iran and Israel kept everyone on edge, and the question of U.S. intervention remained a nail-biter 😬, though President Trump did announce a 14-day "timeout".
Then came the dramatic twist on June 21st: "Operation Midnighthammer" saw the U.S. unleash bunker-buster bombs on Iranian uranium enrichment facilities. 💥 Short time later, the U.S. declared mission accomplished, stating their goal of destroying these sites was achieved, and no further attacks would follow.
Iran's response, "Operation Annunciation of Victory," on the following Monday, involved missile strikes on U.S. military bases in Qatar and Iraq. 🚀 Interestingly, these attacks were pre-announced, allowing for safe evacuations and thankfully, no casualties. 🙏
The biggest surprise came from President Trump as he declared, "Congratulations world, it's time for peace!" 🎉 He then brokered a ceasefire between Israel and Iran, which, despite being fragile, largely held, leading to the war's end.🤝 Both nations, as expected, officially claimed victory – a common move to satisfy their citizens. 🏅
Personally, I was genuinely surprised that the U.S.President mediated ceasefire, actually brought the conflict to a close – but it's a welcome outcome! 🙏
**Economic Data & Fed's Steady Hand** 💹🏛️
The cessation of hostilities triggered a steady downward slide in gold prices from June 24th to 27th. ⬇️ This dip initially met some market resistance but it ultimately prevailed, especially with the release of mixed U.S. economic data, which, despite being varied, was generally interpreted positively by the market.
The spotlight also shone on the Federal Reserve, with several representatives speaking and Fed Chair Jerome Powell undergoing a two-day Senate hearing. 🎤👨⚖️ Powell meticulously explained the Fed's rationale for holding interest rates steady, despite market pressures. 🤷 However, recent whispers suggest the Federal Reserve might actually cut rates in September! 😮
## Geopolitical News Landscape 🌍📰
India / Pakistan
Pakistan rejected claims that it supported militant groups active in Indian Kashmir. India issued a formal protest but reported no fresh border clashes during the week.
Outlook 🔮: De-escalation is possible in the short term. However, unresolved disputes over water rights (Indus Treaty) could reignite tensions.
Gaza Conflict
Heavy Israeli airstrikes killed dozens in Gaza, including civilians near aid centers. The UN warned that U.S.-backed aid systems are failing. Humanitarian corridors remain blocked.
Outlook 🔮: Ceasefire talks may resume in July, but success depends on international pressure and safe humanitarian access.
Russia / Ukraine
Russia advanced 36 sq mi in eastern Ukraine, deploying outdated T-62 tanks. Ukraine reinforced defensive lines, aided by Western military packages.
Outlook 🔮: The front remains volatile. Sustained Western support will be key to halting further Russian gains.
U.S. – China Trade War
A breakthrough deal was signed for China to fast-track rare-earth exports to the U.S. Talks on tech transfer and tariffs continue behind closed doors.
Outlook 🔮: A phased de-escalation is possible, but deep trust issues linger, especially over semiconductors and AI.
🌐 Global Trade War
Several countries, including Brazil and Thailand, imposed fresh restrictions on Chinese imports, echoing the U.S. stance. Global supply chains remain fragmented.
Outlook 🔮: Trade blocs like the EU and Mercosur may take on greater importance as countries hedge against rising protectionism.
Trump vs. Powell
Fed Chair Powell resisted political pressure, stating rate cuts are unlikely before September. Trump called him “stubborn” and demanded immediate easing.
Outlook 🔮: The Fed’s independence is under strain. If Trump wins re-election, major policy shifts could follow.
📈 U.S. Inflation
Despite tariffs, core inflation remains elevated. Powell warned of persistent price pressures. Trump insists the Fed should cut rates to boost growth.
Outlook 🔮: A rate cut later in 2025 is possible—if labor market data weakens. Until then, inflation will remain politically explosive.
## Technical View 📐📈
**Current Market Context:** Gold plummeted to $3,273.67 USD/t.oz on June 27, 2025, marking a 1.65% drop from the previous day, which confirms the strong bearish momentum. The price action shows a significant retreat from recent highs around $3,400.
**ICT (Inner Circle Trader) Methodology Analysis:**
* **Market Structure:**
The trend is clearly bearish, with a definitive break of structure (BOS) to the downside.
* **Order Blocks:**
Several bearish order blocks have been identified at prior resistance levels, specifically in the $3,380-$3,400 range.
* **Fair Value Gaps (FVG):**
The aggressive sell-off has created multiple imbalances, particularly in the $3,350-$3,320 range.
* **Liquidity Pools:**
Buy-side liquidity above $3,400 has been swept. Sell-side liquidity is now accumulating below the $3,270 lows, which is the current target zone.
* **Session Analysis:**
The London session showed aggressive selling, followed by a continuation of bearish momentum in the New York session. The Asia session could see consolidation or further declines.
* **Smart Money Concepts:**
Heavy selling pressure suggests "smart money" distribution. There's been strong bearish displacement from $3,380 down to $3,270, indicating the market is currently in a "sell program" phase.
**Gann Analysis:**
* **Gann Angles & Time Cycles:**
The primary 1x1 Gann angle has been broken, pointing to continued weakness. Key price squares indicate resistance at $3,375 (25²) and support at $3,249 (57²). Daily cycles suggest a potential turning point around June 30-July 1, while weekly cycles indicate continued pressure through early July.
* **Gann Levels:**
* Resistance: $3,375, $3,400, $3,481 (59²)
* Support: $3,249, $3,136, $3,025
**Fibonacci Analysis:**
* **Key Retracement Levels (from recent swing high to low):**
* 78.6%: $3,378 (Strong resistance)
* 61.8%: $3,348 (Key resistance zone)
* 50.0%: $3,325 (Psychological level)
* 38.2%: $3,302 (Minor resistance)
* 23.6%: $3,285 (Current area of interest)
* **Fibonacci Extensions (Downside Targets):**
* 127.2%: $3,245
* 161.8%: $3,195
* 261.8%: $3,095
* **Time-Based Fibonacci:**
The next significant time cluster is July 2-3, 2025, with a major cycle completion expected around July 15-17, 2025.
**Institutional Levels & Volume Analysis:**
* **Key Institutional Levels:**
* Major Resistance: $3,400 (psychological + institutional)
* Secondary Resistance: $3,350-$3,375 (order block cluster)
* Primary Support: $3,250-$3,270 (institutional accumulation zone)
* Major Support: $3,200 (monthly pivot area)
* **Volume Profile Analysis:**
* High Volume Node (HVN): $3,320-$3,340 (fair value area)
* Low Volume Node (LVN): $3,280-$3,300 (potential acceleration zone)
* Point of Control (POC): Currently around $3,330
**Central Bank & Hedge Fund Levels:**
Based on recent COT data and institutional positioning, heavy resistance is seen at $3,400-$3,430, where institutions likely distributed. An accumulation zone for "smart money" re-entry is anticipated at $3,200-$3,250.
**Cycle Timing Analysis:**
* **Short-Term Cycles (Intraday):**
Bearish momentum is expected to continue for another 12-18 hours. A daily cycle low is likely between June 29-30, with a potential reversal zone on July 1-2 for the 3-day cycle.
* **Medium-Term Cycles:**
The current weekly cycle is in week 3 of a 4-week decline. The monthly cycle indicates a mid-cycle correction within a larger uptrend. For the quarterly cycle, Q3 2025 could see a major low formation.
* **Seasonal Patterns:**
July-August is typically a weaker period for gold ("Summer Doldrums"). September has historically been strong for precious metals ("September Effect"), setting up for a potential major move higher in Q4 2025 ("Year-End Rally").
**Trading Strategy & Levels:**
* **Bearish Scenario (Primary):**
* Entry: Sell rallies into the $3,320-$3,350 resistance zone.
* Targets: $3,250, $3,200, $3,150.
* Stop Loss: Above $3,380.
* **Bullish Scenario (Secondary):**
* Entry: Buy support at $3,250-$3,270 with confirmation.
* Targets: $3,320, $3,375, $3,400.
* Stop Loss: Below $3,230.
**Key Events to Watch:**
* **US PCE Data:**
Fresh downside risks could emerge ahead of the US Personal Consumption Expenditures (PCE) Price Index data release.
* **Fed Communications:**
Any hawkish rhetoric from the Federal Reserve could further pressure gold.
* **Geopolitical Developments:**
Ongoing global events could trigger safe-haven demand.
**Conclusion:**
The technical picture for gold suggests continued short-term weakness, with the metal testing its 2025 trend line at $3,290 following last week's rejection at the $3,430 resistance. However, the longer-term outlook remains constructive, given gold's robust performance year-to-date. Key support at $3,250-$3,270 will be crucial in determining the next significant price movement.
**Upcoming Week's Economic Calendar (June 29 - July 4, 2025):** 🗓️🌍
🗓️ Get ready for these important economic events (EDT)
* ** Sunday , June 29, 2025**
* 21:30 CNY: Manufacturing PMI (Jun) - Forecast: 49.6, Previous: 49.5
* ** Monday , June 30, 2025**
* 09:45 USD: Chicago PMI (Jun) - Forecast: 42.7, Previous: 40.5
* ** Tuesday , July 1, 2025**
* 05:00 EUR: CPI (YoY) (Jun) - Forecast: 2.0%, Previous: 1.9%
* 09:30 USD: Fed Chair Powell Speaks
* 09:45 USD: S&P Global Manufacturing PMI (Jun) - Forecast: 52.0, Previous: 52.0
* 10:00 USD: ISM Manufacturing PMI (Jun) - Forecast: 48.8, Previous: 48.5
* 10:00 USD: ISM Manufacturing Prices (Jun) - Forecast: 70.2, Previous: 69.4
* 10:00 USD: JOLTS Job Openings (May) - Forecast: 7.450M, Previous: 7.391M
* ** Wednesday , July 2, 2025**
* 08:15 USD: ADP Nonfarm Employment Change (Jun) - Forecast: 80K, Previous: 37K
* 10:30 USD: Crude Oil Inventories - Forecast: -5.836M
* ** Thursday , July 3, 2025**
* Holiday: United States - Independence Day (Early close at 13:00) 🇺🇸⏰
* 08:30 USD: Average Hourly Earnings (MoM) (Jun) - Forecast: 0.3%, Previous: 0.4%
* 08:30 USD: Initial Jobless Claims - Forecast: 239K, Previous: 236K
* 08:30 USD: Nonfarm Payrolls (Jun) - Forecast: 129K, Previous: 139K
* 08:30 USD: Unemployment Rate (Jun) - Forecast: 4.2%, Previous: 4.2%
* 09:45 USD: S&P Global Services PMI (Jun) - Forecast: 53.1, Previous: 53.1
* 10:00 USD: ISM Non-Manufacturing PMI (Jun) - Forecast: 50.3, Previous: 49.9
* 10:00 USD: ISM Non-Manufacturing Prices (Jun) - Forecast: 68.7
* ** Friday , July 4, 2025**
* All Day: Holiday - United States - Independence Day 🎆
**Gold Price Forecast for the Coming Week** 🔮💰
Given last week's market movements, there's a strong likelihood that the downward trend in gold prices will continue.🔽 However, fresh news can always flip the script! 🔄 As of now, I expect gold to dip further to $3255 by mid-next week. Yet, a brief rebound towards $3300 isn't out of the question before a potential drop to $3200 by week's end or early the following week. 🤞
Please take the time to let me know what you think about this. 💬
-------------------------------------------------------------------------
This is just my personal market idea and not financial advice! 📢 Trading gold and other financial instruments carries risks – only invest what you can afford to lose. Always do your own analysis, use solid risk management, and trade responsibly.
Good luck and safe trading! 🚀📊
Turbulent Week Ahead? Gold Outlook June 9-13, 2025Hey fellow traders,
Let's dive into the OANDA:XAUUSD outlook for the upcoming week, June 9-13, 2025. The recent price action has been a rollercoaster 🎢, and the next few days promise even more fireworks 🎇.
Looking back at the 30-minute chart from May 22 to June 6, gold saw an initial consolidation, then a strong rally to multi-week highs near 3,420. However, this was followed by a sharp, dramatic reversal, pushing prices back below 3,300. This "bull trap" 🐂 pattern suggests underlying weakness and potential preemptive market positioning.
Another view on this could be the possibility that a gap on the chart at 3300-3295 of around $5 could get closed. Since strong support is right below this, it could serve as a good launchpad 🚀 for an upward rally. Let's see if the upcoming Asia session on Monday triggers this because its only - $14 from $3309.
Key Drivers for the Week Ahead:
📅 June 9, 2025 (Monday)
US-China High-Level Trade Talks Commence in London
High-level delegations from the United States and China began trade discussions in London. This meeting followed an announcement by President Donald Trump on Friday, June 6, 2025, who described a preceding 90-minute phone call with Chinese President Xi Jinping as "very positive".
The US delegation included Treasury Secretary Scott Bessent, Commerce Secretary Howard
Lutnick, and US Trade Representative Jamieson Greer, reflecting a coordinated approach to addressing complex trade issues. The talks were primarily aimed at resolving the ongoing bilateral trade war, with a particular focus on tariffs and the global supply of critical rare earth minerals.5 While no specific time for the commencement of talks was provided, it is understood they began during London's daytime, approximately (10:12 CEST / 04:12 EDT).
These discussions occurred in the context of a temporary 90-day agreement reached on May 12, 2025, which had seen the US reduce its tariffs on Chinese imports from 145% to 30%, and China reciprocate by lowering its tariffs on US goods from 125% to 10%.9 However, this temporary truce is set to expire in early August, and President Trump had recently accused China of violating the agreement, specifically regarding critical mineral exports. The broader bilateral relationship remains strained by issues extending beyond tariffs, including restrictions on advanced chips, student visas, and concerns over China's state-dominated economic model.
The prompt scheduling of these high-level talks immediately after a leader-to-leader call suggests a tactical move towards de-escalation of immediate trade tensions, aiming to prevent a full-blown trade war. The objective appears to be managing current conflicts rather than achieving a fundamental resolution, especially with the May 12 agreement nearing its expiration. The core disputes, such as control over rare earths and technology, are deeply entrenched and reflect a broader geopolitical competition rather than mere economic disagreements. This pattern of temporary de-escalation followed by persistent underlying tensions indicates a long-term,structural competition. It suggests that trade policy is increasingly intertwined with national security and geopolitical strategy, implying that businesses should anticipate continued volatility and strategic decoupling in certain sectors, rather than a return to pre-trade war normalcy.
Other big movers for gold will be the US inflation reports. 💥
📅 Wednesday, June 11 (14:30 CEST / 08:30 EDT):
We get the crucial US Consumer Price Index (CPI) data.
Watch for Core CPI (YoY) with a forecast of 2.9% and headline CPI (YoY) at 2.5%.
📅 Thursday, June 12 (14:30 CEST / 08:30 EDT):
The US Producer Price Index (PPI) follows.
Forecasts are for Core PPI (YoY) at 3.0% and headline PPI (YoY) at 2.6%.
📊 These numbers are critical. If inflation comes in hotter 🔥 than expected, it will likely strengthen the US Dollar 💵 and push real interest rates higher 📈, making gold less attractive. This could trigger further declines 📉, especially given the current market structure. Conversely, cooler 🧊 inflation could spark a significant rebound 🔄.
Beyond US data, keep an eye 👁️ on speeches from various European Central Bank (ECB) officials throughout the week, including President Lagarde on Tuesday (23:15 CEST / 17:15 EDT). Their collective tone 🎤 could influence EUR/USD dynamics and indirectly impact the US Dollar Index, offering a counterbalance ⚖️ or amplification to gold's movements.
Key Numbers and Technical Levels to Watch:
Gold is currently sitting on a substantial speculative net long position of 187.9K contracts. This is a massive amount of bullish bets 📊🐂, making gold highly vulnerable to rapid liquidation 💣 if the fundamental picture turns sour. A "long squeeze" could amplify any downside move.
Immediate Support: The 3,300 level is paramount. A decisive break below it would signal further weakness. Below that, 3,250 is strong technical support where we saw a bounce previously.
Overhead Resistance: Look for resistance at 3,350-3,360, and then the recent peak of 3,420. Reclaiming these levels would require a significant shift in sentiment.
Expect high volatility ⚡, especially around the US inflation releases. Trade smart 🧠, manage your risk ⚖️, and stay nimble! 🏃
Geopolitical News Landscape 🌍
India / Pakistan
The ceasefire from May 10 is holding, but diplomatic relations remain frosty. India has launched a global image campaign to gain support, while Pakistan insists on dialogue and accountability.
Outlook: Without substantial agreements on border terrorism and water issues, tensions will stay latently high, with potential for new escalation risks. ⚠️
Gaza Conflict
Violence escalated again in early June. Israel intensified attacks, killing civilians seeking aid in Gaza City, and at least six people were killed at a distribution point.
Outlook: The humanitarian situation continues to worsen 🚨, and international mediation efforts are urgently needed. However, an immediate ceasefire seems unrealistic. ❌
Russia / Ukraine
In the first week of June, Russia launched one of its largest series of attacks: hundreds of drones and missiles hit Kharkiv and Kyiv, resulting in civilian casualties. Simultaneously, a planned prisoner exchange has stalled.
Outlook: Strategic air attacks will likely continue 💥, and the prisoner exchange remains deadlocked. Without a diplomatic initiative, the conflict will stay entrenched. 🕳️
U.S.–China Trade War
Following talks between Trump and Xi, new negotiation rounds are expected in London. China has opened up rare earth exports, a sign of cautious de-escalation.
Outlook: If dialogue channels open 🗣️, systemic trust could grow, but genuine reforms remain uncertain. 🤔
🌐 Global Trade War
The OECD has lowered its growth outlook to 2.9%, warning of protectionism 🧱 and delayed investments. The ECB is also maintaining synchronization with the FED.
Outlook: Without de-escalation, the world faces a global economic slowdown 🐌 and permanent fragmentation of supply chains. 🔗
🏛 Trump vs. Powell
Trump has again complained about the FOMC's hesitancy, nicknaming Powell “Too Late,” and demanding a full 1% interest rate cut.
Outlook: Pressure is mounting 📣. Whether the Fed yields depends on if inflation and labor data allow for a loose policy. 🎯
💵 U.S. Inflation – May 2025
Forward-looking data shows a weakening services sector and consumer prices rising again as tariffs pass through. Official CPI data for May 2025 will be released on June 11.
Outlook: Higher inflation could halt the Fed's "dereflexion" course — a dilemma ⚖️ between growth 📈 and price stability. 🛑
Technical View 📐
Regarding the major Head and Shoulders (H&S) reversal pattern on the 4H chart I shared previously, I'd like to explain some new developments that are altering its potential outcome.
Since the price has re-entered and fallen below the neckline, I activated my "second brain cell" 🧠 to guess what could be next. This led me to revise the larger 4-hour chart structure with the adjustments shown in the accompanying image.
As you can also see in the updated version below, a reversed H&S pattern remains a possibility, as the proportions still appear valid. 🔄
Potential Scenarios for Gold 🧩
Under this revised idea, Gold could potentially reach the neckline entry at 3397 (+88) from the current price. This is one plausible scenario. ✅
Alternatively, the price could drop further to the "Head" at 3120 (-191 from the current 3309), which would, of course, invalidate this H&S pattern. ❗
While this is speculative 🔮, given that trading often involves psychological movements and their resulting impacts, I believe this is a favorable approach to forecasting.
Another reason to see it as bullish is the formed standard bull flag 🚩🐂.
Please take the time to let me know what you think about this. 💬
-------------------------------------------------------------------------
This is just my personal market idea and not financial advice! 📢 Trading gold and other financial instruments carries risks – only invest what you can afford to lose. Always do your own analysis, use solid risk management, and trade responsibly.
Good luck and safe trading! 🚀📊

S&P500 is Nearing an Important Support of 5,960!!!Hey Traders, in today's trading session we are monitoring US500 for a buying opportunity around 5,960 zone, US500 is trading in an uptrend and currently is in a correction phase in which it is approaching the trend at 5,960 support and resistance area.
Trade safe, Joe.

With Bullish bias into new Week - 2025/05/26Last week, I published my idea for a whole week with daily updates for the first time. You can read about it here:
🎯 The target of $3348 was reached on Friday due to the announcement of new tariffs against the European Union.
💡 Here is my idea for the week from May 26-30, 2025.
First things first, the Friday session last week ended with bullish momentum. Even though the gold price consolidated more at the $3366 mark, it was obviously to allow time to pass and calm down stressed values like EMA or MACD. This is a very good sign for the start of the week because if the Asia timezone takes the invite, the gold price has a good chance to rise. My expectation is a bullish GAP right at the beginning; if so, it's a clear sign for the rest of the day, in my opinion. These thoughts would support my goal from above $3500 during the week.
📰 Geopolitical News Landscape
India / Pakistan
The ceasefire from May 10 remains tense but intact. Both sides claim victory, while Pakistan strengthens ties with China. Cross-border attacks have ceased, but mutual distrust persists.
➡️ Situation remains fragile; renewed escalation is possible.
Gaza Conflict
Israel intensifies "Gideon’s Chariot" with ground forces in Khan Younis. Mass evacuations and high civilian casualties worsen the humanitarian crisis. Peace talks have stalled as the offensive continues.
➡️ No relief in sight; humanitarian conditions are deteriorating further.
Russia / Ukraine
On May 24, Russia launched its largest air assault yet with 367 missiles and drones—13 civilians were killed. Just before, both sides exchanged 1,000 prisoners. Peace talks remain suspended.
➡️ Violence is escalating; a ceasefire remains out of reach.
U.S.–China Trade War
The 90-day tariff pause triggered a rush to import from China. Shipping bottlenecks and high freight rates are straining businesses. Structural issues remain unresolved.
➡️ Short-term easing; long-term tensions persist.
Trade War on global view
The global trade war has escalated in May 2025, with the U.S. imposing a 50% tariff on EU imports and a 25% levy on foreign-made smartphones, citing trade imbalances. The EU has condemned these moves, warning of potential retaliation. In response to U.S. tariffs, China has restricted rare earth exports, impacting global supply chains. ASEAN nations, heavily affected by U.S. tariffs ranging from 10% to 49%, are urging deeper regional integration to mitigate economic disruptions. The IMF has downgraded global growth forecasts to 2.8% for 2025, citing trade tensions and policy uncertainty. Supply chains are being restructured, with companies shifting production to countries like Vietnam and Mexico. Financial markets are volatile, with increased inflationary pressures and investor anxiety.
➡️ Emerging markets face currency volatility and economic instability due to the ongoing trade conflicts.
⚖️Trump vs. Powell
President Trump increases pressure on Fed Chair Powell to cut rates. The Fed holds interest rates at 4.25–4.5% and warns of inflation. A 10% staff reduction is planned to boost efficiency.
➡️Political interference is increasingly destabilizing markets.
U.S. Inflation – April 2025
Inflation dropped to 2.3%, the lowest since February 2021. However, consumer inflation expectations remain high at 7.3%. The University of Michigan Consumer Sentiment Index fell to 50.8—a historic low.
➡️A clear gap is emerging between official data and public perception.
🔋 Technical Analysis – Short-Term
📊 Analysis: May 19–24, 2025
Weekly Low: $3,204 (May 20)
Weekly High: $3,366 (May 23)
Weekly Close (May 23): approx. $3,358
Total Gain: +5%
🟢 Trend: A clear uptrend is evident. After hitting a low of $3,204 on May 20, gold experienced a strong rally, forming consistently higher highs and higher lows. A brief pullback on May 22 was quickly bought up.
📈 Structure: A series of bullish flag patterns developed, each resolving to the upside. The high at $3,366 currently marks the most significant resistance level.
🔮 Outlook from May 26, 2025
Resistance: $3,366 (recent high)
Support: $3,310 (last local low), below that $3,280 (breakout zone)
Bias: Bullish as long as price holds above $3,310
📌 Scenario 1 – Bullish Breakout: A sustained breakout above $3,366 could unlock further upside potential toward the $3,390–$3,410 area. When Asia session starting with bull GAP the Scenario is the one i preffer.
📌 Scenario 2 – Pullback: A retracement to the $3,310–$3,280 zone would be a healthy correction within the trend, provided this zone holds.
🧭 Conclusion:
Gold remains in a steady uptrend. As long as support levels hold, a continuation toward $3,500 is likely. RSI may be overbought on higher timeframes, so short-term consolidations are possible, but structurally the setup remains bullish.
Anything to ad? Feel free to tell your thoughts.
-------------------------------------------------------------------------
This is just my personal market idea and not financial advice! 📢 Trading gold and other financial instruments carries risks – only invest what you can afford to lose. Always do your own analysis, use solid risk management, and trade responsibly.
Good luck and safe trading! 🚀📊

Weekly Market Wrap: Nifty & S&P 500 Outlook The Nifty closed the week at 24,853, down 166 points from the previous week's close. It traded within a range of 25,062 (high) and 24,462 (low) — perfectly aligning with our forecasted zone of 24,450 – 25,600. On the weekly chart, the index formed an inside candle pattern, signaling consolidation.
Positives: Despite the dip, Nifty continues to hold above the critical support level of 23,800, keeping the medium-term bullish structure intact.
Key Levels to Watch for Next Week:
High/Low to mark: 25,116 – 24,378
Breakout above 25,116 can lead to tests of 25,329 and 25,500 (resistance zones).
Breakdown below 24,378 could retest 23,800 and 23,600.
A weekly close below 23,800 could spell trouble for bulls, opening doors for deeper correction towards 22,800 and 22,100.
Trend Analysis:
Monthly Timeframe: Bearish
Daily Timeframe: Turned Bearish
Weekly Timeframe: Still Bullish
Conclusion: Stay cautious below 24,378 — volatility may rise if this level is breached.
S&P 500 Weekly Snapshot:
The S&P 500 ended the week at 5,802, down 156 points. Once again, it faced stiff resistance around the 5,980 mark — a historically significant level where the index began its downward move in March 2025.
Geopolitical Impact: Markets remain jittery amid escalating global trade tensions and Trump’s tariff war, likely keeping volatility high over the next 2–3 weeks.
Key Support Zones:
Immediate support at 5,700
Close below 5,700 may trigger declines to 5,551, 5,458 (key Fibonacci support), and 5,392
Bullish Breakout Scenario:
Sustained close above 6,000 is required to resume bullish momentum
Upside targets: 6,013, 6,082, 6,147 (All-Time High), and potentially 6,225
Final Takeaway:
Both Nifty and S&P 500 are at critical junctures. With technical patterns pointing to mixed signals and geopolitical events adding fuel to volatility, traders should stay alert and focus on key breakout and breakdown levels.

$SFM : Stock with no Tariff exposure and good momentumNASDAQ:SFM : We are revising this stock one more time in our blog series. Sprout Farmers Market NASDAQ:SFM is a retailer which sell high quality food with higher margin in good localities and the best part is the products are locally produced and sourced. This makes it immune to the tariff discussions ongoing in the market. Hence, we have seen relative strength in the $SFM. There are very few stocks in S&P 500 which are at or above the ATH. NASDAQ:SFM touched its ATH of 178 $ on 28th April amidst the tariff discussion. Currently @ 163 $ SFM has a RSI of 60 which is not in overbought territory.
In the chart below we plot the upward slopping regression channel and we see that the stock is currently sitting at the mid-point of this cannel and the 20 Day SMA is above the 50 Day, 100 Day and 200 Day SMA indicating positive momentum in the stock. The lower bound of the parallel channel is always above the 200 Day SMA indicating strong institutional long term holding capability. We like these kind of stocks which have great technical and good fundamentals with strong institutional holdings.
Verdict : Buy NASDAQ:SFM @ 150 $ and DCA @ 160 $. Year end target 200 $

An Unharmonious Outlook for the New WeekGold Bullish? Sure, go ahead, but let me explain where we are and so on... 🤔
1. Newswise 📰
Tariffwar:
Trade tensions between the U.S. and China have intensified following President Trump's tariff hikes. The U.S. increased tariffs on Chinese imports to 145%, while China retaliated with tariffs up to 125% on U.S. goods. Despite these escalations, both countries have engaged in high-level negotiations in Geneva, aiming to de-escalate the situation. However, a recent abrupt withdrawal by the Chinese delegation has cast doubt on the progress of these talks. Analysts caution that even if an agreement is reached, it may offer only temporary relief, leaving markets exposed to prolonged trade tensions.
Federal Reserve does not cut interest rates:
President Donald Trump has been vocal in his criticism of the Federal Reserve’s decision to keep interest rates unchanged, calling Fed Chair Jerome Powell a “fool” for not lowering them. 😡 Trump argues that with falling energy prices, stable employment, and low inflation, the Fed should cut rates to stimulate economic growth. 📉
The Federal Reserve, however, remains cautious. 🏦 Officials have expressed concerns that recent tariffs could increase inflation, making premature rate cuts risky. They emphasize the need for clearer economic data before making further policy adjustments. 🧐
In summary: While Trump pushes for immediate cuts to boost the economy, the Fed is taking a measured approach, prioritizing long-term stability over short-term political pressure. ⚖️
War in Ukraine remains tense:
Western leaders, alongside President Zelensky, are calling for a 30-day ceasefire starting May 12. Russia has shown a willingness to negotiate but demands an end to Western military aid — a condition firmly rejected. 🚨
Conclusion: The coming days will be critical. A ceasefire could open the door to new peace efforts. If rejected, expect tougher sanctions and further escalation. 💥
India–Pakistan Conflict:
Tensions between India and Pakistan have escalated sharply following a militant attack on Indian tourists in Kashmir on April 22, 2025. India responded with airstrikes, prompting mutual accusations of missile and drone attacks. 💣 Despite a U.S.-brokered ceasefire announced on May 10, violations followed within hours. Both countries, nuclear-armed, have mobilized troops along the Line of Control. ⚔️ Global powers — including the U.S., U.K., China, and G7 — have urged restraint and offered to mediate. 🌍
2. Technicalwise 📊
1h Timeframe – Bearish Anti-Gartley Pattern
15m Timeframe – Bearish Anti-Butterfly Pattern
That’s not a sign of gold being bullish in the short term. 🚫
Let’s take a look at RSI values across timeframes:
- 5m – 31 – Down ⬇️
- 15m – 37 – Down ⬇️
- 30m – 43 – Down ⬇️
- 1h – 45 – Down ⬇️
- 4h – 46 – Down ⬇️
- 1d – 55 – Up ⬆️
Interpretation of RSI Values 🧐
5m to 4h (31 to 46 – all “Down”)
→ These low RSI values (below 50) across short- to mid-term timeframes indicate ongoing selling pressure and downward momentum. Although not yet in oversold territory (<30), this still signals relative weakness. ⚠️
1d (55 – “Up”)
→ On the daily chart, the RSI is above 50 and rising, suggesting a possible trend reversal or early signs of recovery — a bullish signal over the longer term. 📈
Overall Meaning 🧠
This points to short-term weakness within a broader potential uptrend. The market is soft on lower timeframes — likely in correction or consolidation — while the daily chart begins to show strength. It's a classic pullback setup in an uptrend. 🔄
Possible Strategy Consideration 💡
If you're leaning bullish, look for reversal signals on the smaller timeframes to align entries with the daily trend — such as RSI divergences or breakouts above local resistance. 📊
My Bias 🤔
Bearish sentiment dominates in the short term. Over the next week, I aim to enter short positions targeting $3,200. 📉
If sentiment shifts or key news emerges, a target of $3,400 becomes more realistic. 🚀
-------------------------------------------------------------------------
This is just my personal market idea and not financial advice! 📢 Trading gold and other financial instruments carries risks – only invest what you can afford to lose. Always do your own analysis, use solid risk management, and trade responsibly.
Good luck and safe trading! 🚀📊

Gold - All eyes on Wednesday 08 May - FED🟡 Gold Traders: Nothing Matters Until Wednesday! ⏳💤
Hey traders! 👋
This week, all eyes are on Wednesday... and everything before that? Mostly noise.
Let me break it down for you. 👇
📊 Technical Outlook
Gold is chilling above a key resistance level right now.
Trendlines suggest we won’t see any major moves before Wednesday unless big news drops. 📰
🕐 Asian session is kicking things off above resistance.
If bulls show up there, we could break Trendline 1 (Image below) and head towards the $3300 🎯 target.
📉 RSI across multiple timeframes? Pretty neutral.
If Asia trades flat or slightly bearish, gold might range between $3210–$3250.
Break below $3201, and things could get shaky... but the European session might push us back above that support.
U.S. session on Monday? Likely a sideways snoozefest 😴 (unless surprise news hits).
🎯 Trade Setup (Mon–Wed)
I’m looking to play the range between:
$3261 (Trendline 2) 🔼 and $3169 (Trendline 4) 🔽
That’s a comfy $90 window I’m aiming to trade before Wednesday's fireworks. 🚀
🔮 After Wednesday – The FED Factor 💣
Here’s the real catalyst:
Wednesday, May 7 at 2:00 PM EST – FOMC Rate Decision
If the FED cuts rates (not likely, but possible under pressure), gold could tank hard. 💥
I’m talking a potential drop to $3150 or lower 🕳️📉
That’d be a -$90+ move easy.
FED has been holding the line 💪, resisting pressure (especially from Trump back in the day), but if the economy flashes red, that rate cut might come sooner than expected.
🧠 Final Thoughts
FED paused hikes, but left the door open for 3 rate cuts this year.
Until we get more clarity, no strong bullish signals on gold.
My bias stays: Bearish unless proven otherwise. 🐻💬
Stay sharp out there, and watch those sessions. Wednesday’s the real deal! 💼📉
And last but not least, look at this and let us know what you think about please:
Some would say its impossible but as we know, gold can do everything!
-------------------------------------------------------------------------
This is just my personal market idea and not financial advice! 📢 Trading gold and other financial instruments carries risks – only invest what you can afford to lose. Always do your own analysis, use solid risk management, and trade responsibly.
Good luck and safe trading! 🚀📊

Russell 2000: Looking Past the Short-term VolatilityCME: Micro E-Mini Russell 2000 Index Futures ( CME_MINI:M2K1! )
On Saturday, May 3rd, Warren Buffett took the center stage of the Berkshire Hathaway annual shareholder meeting. “What has happened in the last 30, 45 days … is really nothing,” declared the “Oracle of Omaha”.
Buffett brushed off recent stock market volatility that has rattled investors over the past weeks. “This has not been a dramatic bear market or anything of the sort,” he said.
In April, U.S. stock market took a deep dive after the start of Reciprocal Tariff against all U.S. trading partners. A few days later, we witnessed spectacular rally with a record daily gain, as a 90-day tariff pause was announced. On May 2nd, the S&P 500 completed a 9-day winning streak, the longest in 20 years.
After a month-long rollercoaster ride, the U.S. stock market is back to where it started. If an investor bought stocks in the beginning of April and then slept for the whole month, he wakes up today and may not even notice any changes in his portfolio.
Sunny Days ahead after the Storm
I concur with Buffet’s assessment that the U.S. economy is fundamentally strong. The supply chain disruptions are painful and will lead to product shortage, higher prices and layoffs in affected industries. However, trade conflicts will be resolved in a few months. The U.S. will be in a strengthening position, making its economy more sustainable.
The U.S. economy contracted 0.3% in Q1 2025, the first negative reading since 2022, according to the Commerce Department. However, the underlying data is much better if you look past the headline.
The formula: GDP = C + I + G + (X - M), where:
• C is consumer spending; I is investment by private business
• G is government spending; (X-M) is the net of exports minus imports
The key driver of the negative GDP is Imports. US buyers front-run the tariffs with massive orders, resulting in a 41.3% increase in imports. We also see a 21.9% gain in investment, primarily the result of US businesses building up inventory with imported goods.
• Imports and Investment contribute -4.83% and +3.6% to Q1 GDP, respectively. Both are one-time events and should not be taken as a long-term trend.
• Consumer spending grew 1.8% in Q1, contributing to 1.21% of GDP. Government spending contracted 1.4% in Q1, contributing to -0.25% of GDP.
Real Story: Q1 constant dollar GDP is +3.5%. By using a price deflator of 3.7%, the government reports a -0.3% “Real GDP at seasonally adjusted annual rates.”
Separately, the Bureau of Labor Statistics (“BLS”) reported that total nonfarm payroll employment increased by 177,000 in April, beating market expectations. The April unemployment rate was 4.2%, in line with expectations.
The above data supports my assessment of a solid U.S. economy. Once we walk past the tariff fear, the stock market will likely resume its growth.
Small Firms May Benefit More from New Trade Policies
A global supply chain helps corporate giants source from the most efficient and lowest cost suppliers. Small businesses may not be so lucky. Take the US textile industry as an example, the BLS data shows that 80% of domestic jobs have been lost since 2000.
The "de minimis" exemption is an import loophole that allows overseas packages under $800 to come into the U.S. duty-free. According to BLS data, e-commerce giants like Amazon, Shein and Temu source 80-90% of their products from overseas.
Closing the "de minimis" loophole and enacting fairer trade deals will help domestic manufacturers. By shielding from low-cost import dumping, a revitalized US manufacturing industry may not be far fetching.
Of the four major US market index, Russell 2000 performed the worst, flat in the last twelve months. Based on my analysis above, the Small Cap Russell index may have a better growth outlook compared to blue-chip indices.
Trade Setup with CME Micro E-Mini Russell 2000 Index Futures
Traders who take a bullish view in Small Cap could buy the Micro Russell Futures (M2K).
M2K contracts have a notional value of $5 times the index value. With Friday settlement price of $2042.70, each September contract (M2KU5) has a notional value of $10,213.5. Buying or selling one contract requires an initial margin of $932 at the time of writing.
The reason for selecting the September contract rather than the more liquid June contract is the time it takes to negotiate trade deals. While some trading partners may reach agreement within the 90-day window, others may not.
Micro Russell futures (M2K, $5) contracts tap into the deep liquidity of E-Mini Russell futures contracts (RTY, $50). As of last Friday, RTY has an open interest (OI) of 457,283 contracts, while the OI for M2K is 41,563, according to data from CME Group.
The risk of long Russell futures is a decline in the index. To hedge against the downside risk, a trader could set up a stop-loss in his buy order.
Hypothetically, a trader enters a buy order of M2KU5 at $2050 with a stoploss at $1950.
• If the Russell goes up 10% to 2,255, the trade will gain $1,025 (= (2255-2050) * 5). The theoretical return is 110% (= 1025/932). This is 10 times bigger than the gain in the underlying index, thanks to the leverage built into the futures contracts
• If the Russell falls 10% to 1,845, the maximum loss with be $500 (= (2050-1950) * 5). This is less than the initial margin of $932 and the trader will not face a margin call. The loss is limited even if your view is incorrect, thanks to the stoploss feature
Happy Trading.
Disclaimers
*Trade ideas cited above are for illustration only, as an integral part of a case study to demonstrate the fundamental concepts in risk management under the market scenarios being discussed. They shall not be construed as investment recommendations or advice. Nor are they used to promote any specific products, or services.
CME Real-time Market Data help identify trading set-ups and express my market views. If you have futures in your trading portfolio, you can check out on CME Group data plans available that suit your trading needs www.tradingview.com

Possible H&S Forming – It’s All About the News NowOANDA:XAUUSD
📉 Watching closely: Possible Head and Shoulders formation developing on the 4H and 1H charts
As of April 24, 2025, Gold (XAU/USD) is forming a potential Head and Shoulders pattern on the shorter timeframes (4H and 1H), which could indicate a reversal setup. While multiple scenarios are still in play, the price action around the $3368 level will be crucial.
If price fails to break above this resistance in the near term, it could suggest weak bullish momentum and open the door for a pullback toward and possibly below the neckline around $3250 .
🔔 Key Economic Events – April 24
08:30 EDT – Durable Goods Orders MoM
Forecast: +2.0%
Personal outlook: Numbers might come in weaker than forecasted.
Durable goods orders are a solid gauge of industrial demand. Weaker-than-expected numbers would likely weaken the USD and could offer some upside pressure on Gold.
10:00 EDT – Existing Home Sales
Forecast: Lower than previous.
As a key barometer of consumer confidence and economic stability, lower-than-expected figures could also put pressure on the USD, potentially providing Gold a short-term bullish impulse.
📊 Potential Scenarios
Scenario 1 – Bullish Breakout
Weak economic data → USD weakens → Gold spikes above $3400
If both data points disappoint, we could see a rally in Gold, possibly breaking the resistance and invalidating the H&S pattern.
Scenario 2 – Bearish Breakdown (Preferred H&S Scenario)
Strong data → USD strengthens → Gold falls below $3200
While less likely, if economic data comes in stronger than forecasted, Gold could see a significant drop, forming the right shoulder and breaking the neckline – confirming the Head & Shoulders reversal.
Scenario 3 – Sideways Movement
Neutral data + Tariff talks in focus
In the absence of impactful data or if figures come in as expected, Gold might consolidate sideways. Ongoing developments around US-China tariff negotiations could dominate sentiment, delaying or nullifying the H&S pattern entirely.
📉 Market Sentiment Snapshot
US stocks are rallying on optimism around tariff reductions
Trump administration signaling potential easing of China tariffs
➡️ Gold under pressure as risk-on sentiment rises
📍 Conclusion
Keep an eye on the $3368 level and $3250 neckline. Short-term moves will likely be dictated by today’s economic releases and the evolving trade narrative. A confirmed break below the neckline would validate the bearish H&S scenario with potential downside toward $3200 and below.
👉 Stay nimble and trade the reaction, not just the forecast.
-------------------------------------------------------------------------
This is just my personal market idea and not financial advice! 📢 Trading gold and other financial instruments carries risks – only invest what you can afford to lose. Always do your own analysis, use solid risk management, and trade responsibly.
Good luck and safe trading! 🚀📊

Spring Loaded Wedge? Let the setup come to you! $SPXLowkey top watch for the next few weeks!
It was a chop zone last week = consolidation? Now zooming out, it’s looking like a loaded wedge/flag forming. A lot of bearish sentiment, tariff talks and unknown lately but this is looking mighty interesting of a formation. Volume also slowly declining, wondering if we’re setting up for once a decision/mutual agreement is made with US, China + others involved.
Green ray is my ENTRY: 5372.44
*Also eyeing 5329.66*
- For potential upside. We have a few gams above to also fill and can magnet upwards if we get news, volume etc.
Looking for the banger* here - of course, things are still brewing. Note this is the HOURLY timeframe. Wait for the setup to come!
Let me know your thoughts! Appreciate any insight. Do your DD! #NFA AMEX:SPY SP:SPX

Gold Price Rollercoaster: Is the Rally Just Beginning?The gold price has had a pretty crazy six days, jumping from 3,014 USD on April 9, 2025, to 3,357 USD on April 17 – that’s a solid 11%+ gain. So, what’s going on now? Is the gold rally over, or could we see even more upside? Let’s break it down.
🔥 What’s driving the gold price?
The big reason behind the recent surge is the trade war between the US and China. Trump has slapped new tariffs on imports from China, Mexico, and Canada, which has shaken things up in the markets. The Fed has also warned that these tariffs are bigger than expected, and could slow down growth and increase inflation.
When things get uncertain, investors tend to rush to safe havens like gold, and that’s exactly what’s happening right now. The demand for gold is up, and so is the price.
📉 What does the ECB rate cut mean?
The European Central Bank (ECB) has lowered interest rates by 0.25% today, dropping from 4.5% to 4.25%. They’re trying to help the economy out and ease inflation.
Lower rates mean fixed-income investments aren’t as attractive, which makes gold a better option. But, the US Fed has made it clear they won’t cut rates before June 2025, which could strengthen the US dollar and make gold a little less appealing.
🕊️ What if there’s a trade deal?
Now, imagine there’s a breakthrough – a trade deal, fairer tariffs, and everyone’s calming down. That could change things for gold:
📉 Less risk = less demand for gold: If things chill out, less capital will flow into gold.
💵 Stronger Dollar?: A trade deal could make the US dollar stronger, which isn’t necessarily great for gold. But Trump has made it clear that he doesn't want a strong dollar, since it makes US goods less competitive abroad. Even if the dollar does strengthen, it might put pressure on gold since it becomes more expensive for people using other currencies.
🔁 Money shifts: If things get calmer, investors might move away from gold and back into stocks or bonds for better returns.
So, a deal could definitely slow down or even end this gold rally.
🧭 What does this mean for investors?
Daytraders
For day traders, the current ups and downs can offer some good opportunities, but they also come with risks. The markets are super sensitive to news about the trade war and rate cuts. Quick gains are possible, but you’ve got to be careful. If a trade deal happens, expect the classic “Sell the News” scenario where the market cools off.
Medium-Term Investors (1 Month)
Over the next few weeks, we’ll see if more trade war news or central bank decisions impact the gold price. The rally could keep going, but nothing is guaranteed. If you’re in it for the medium-term, keep your positions flexible and manage risk closely. A trade deal could be bad news for gold, though.
Long-Term Investors
Long-term, gold is still a great way to hedge against inflation and geopolitical risks. The current trends could help gold prices, but keep in mind there could be some ups and downs. If the price drops due to a trade deal, it might actually be a good opportunity to buy.
📊 The Bottom Line
Gold has been on a hot streak lately, driven by the trade war and central bank moves. Whether this rally continues or cools down depends on what happens next. A trade deal could bring a correction. So, keep an eye on things and adjust your strategy accordingly.
-------------------------------------------------------------------------
This is just my personal market idea and not financial advice! 📢 Trading gold and other financial instruments carries risks – only invest what you can afford to lose. Always do your own analysis, use solid risk management, and trade responsibly.
Good luck and safe trading! 🚀📊

Netflix (NFLX) – A Safe Haven Amid Tariff UncertaintyKey Supporting Arguments
Amidst the unpredictability of Donald Trump's tariff policies, Netflix might serve as a defensive play.
Positive consumer sentiment, a surge in subscriber growth, and strategic hikes in subscription prices are poised to power robust results for the first quarter of fiscal year 2025.
Investment Thesis
Netflix (NFLX) is a global leader in video streaming, offering a vast library of original and licensed content to subscribers worldwide. With over 95% of its revenue stream coming from subscriptions, the company secures a solid foundation against the whims of market volatility. NFLX’s nascent foray into advertising contributes a mere 3% to its revenue, ensuring that any tremors in the macroeconomic climate have a minimal ripple effect.
Netflix's business model, anchored in subscription revenue and expansive geographic diversification, shields the company from the whims of unpredictable tariff policies. Amidst the relentless cycle of tariffs being slapped on and lifted from a variety of products and the growing tide of protectionism, streaming platforms such as Netflix, which thrive on subscription-based models, emerge as devensive assets. This is largely because they steer clear of the tumultuous world of physical goods production, importation, and exportation. The sustainability of the company’s streaming empire is anchored in its formidable user engagement—clocking in at around 2 hours per household daily—paired with historically low subscriber churn and entertainment value that punches well above its price tag. These elements collectively mitigate NFLX’s risk profile in the face of a potential recession. While advertising revenue may take a hit if trade tensions intensify and trigger an economic downturn, it is worth noting that ads only contribute to about 3% of Netflix's total revenue. Despite its worldwide footprint, the company still rakes in a hefty slice of its revenue—around 40-45%—from the U.S. market, offering a protective buffer against possible international sanctions or restrictions. Meanwhile, its strategic geographic diversification across Europe, Latin America, Asia, and the Middle East not only mitigates risks but also fortifies the sustainability of its business model.
Netflix is poised to potentially exceed expectations in its Q1 2025 earnings report. In Q4 2024, the company shattered expectations by pulling in a recordbreaking 19 million new users, a surge we anticipate will roll into 2025, powered by its rich and diverse content lineup. By the year's end, Netflix strategically hiked prices in the U.S. and UK, a move poised to bolster its Q1 2025 revenue. With a bold target of 29% growth for 2025, the company is banking on buoyant consumer spending and these subscription price upticks to hit the mark. Netflix projects a free cash flow of no less than $8 billion, creating a strategic opportunity for potential share buybacks.
Our target price for NFLX over the next two months is pegged at $1,080, paired with a "Buy" recommendation. We suggest setting a stop-loss at $880.

Spotify (SPOT) – Sustainable Business Model Amid Tariff WarsKey Supporting Arguments
Spotify’s business model is resilient enough to rising tariff barriers between countries and economic downturns
Spotify and other music streaming platforms are undercapitalized and may demonstrate substantial growth in 2025, driven by increasing subscription prices.
Investment Thesis
Spotify (SPOT) stands as the world’s leading global audio streaming platform, boasting over 600 million active users, around 265 millions of whom are paying subscribers. The company’s primary revenue stream is derived from premium subscriptions, which constitute approximately 88% of its total revenue, with advertising revenue comprising the remaining 12%. This model offers the company relative stability amidst ongoing tariff tensions.
Amidst global economic instability and the threat of escalating trade wars, Spotify emerges as a safe haven for investors. Spotify’s audio streaming platform is not reliant on the supply of physical goods, rendering it immune to tariff barriers. The high entertainment value, the ingrained habit of daily usage, and the superior quality of the platform ensure a strong subscriber base, even during times of economic uncertainty. 88% of Spotify’s revenue is derived from paid subscribers, while advertising revenue accounts for only about 12%. This revenue structure makes the company more resilient to downturns in consumer demand and reduced advertising budgets. Approximately 40% of Spotify’s revenue is generated in the U.S. and 10% in the UK, with the remainder coming from other markets worldwide. This geographic diversification mitigates vulnerability to localized economic shocks.
The music streaming sector is undercapitalized. This industry is undergoing transformation. Initially, competition among music streaming platforms was centered on mass user acquisition, often keeping prices low to attract listeners away from piracy services. However, beginning in 2022 and through 2023, a wave of price increases was initiated by all major industry players, including Spotify, Apple, Amazon, and YouTube. As users have grown accustomed to paid subscriptions and their loyalty has increased due to enhanced user experiences, the cost of switching between platforms has risen substantially. This has empowered streaming services, particularly Spotify, to raise prices without experiencing significant audience loss. We anticipate that subscription price increases will be a primary driver of the company’s revenue and margin in 2025.
Our two-month price target for the SPOT stock is $650, with a “buy” rating. We recommend setting a stop-loss order at $500.

Tata Motors at ₹600: Support Zone in Focus...
Tata Motors at Key Technical Support: A Long-Term Buying Opportunity..?
Tata Motors is currently trading near the ₹600 level, which marks a significant technical support zone. This level is important not only because of historical price action but also because it aligns with the 0.5 Fibonacci retracement level of the broader uptrend seen in recent months.
The ₹600 mark has acted as a strong support on the monthly chart, suggesting a potential reversal point for long-term investors looking for value entry. From a purely technical perspective, this level could provide a solid foundation for a possible bounce or even a continuation of the longer-term bullish trend.
However, it is important to note that while technical indicators may suggest an attractive entry point, Tata Motors remains subject to various fundamental factors that could drive volatility in the short to medium term. These include:
- JLR (Jaguar Land Rover) Sales Data
- Quarterly Earnings Results
- Global Tariff and Trade Policy News
These elements can significantly impact investor sentiment and stock performance, sometimes overriding technical signals.
Disclaimer: This analysis is based solely on technical chart patterns and should not be considered financial advice. Market conditions can change rapidly, and it’s crucial to conduct your research and consider fundamental factors before making any investment decisions.

$SPX: Rising WedgeSPX looking a bit tight, possibly a rising wedge?
Tariff news has been such a wash up. Tariffs on/Tariffs off. A lot of moving pieces and indecision. If the news is false regarding electronics not included, then markets can possibly take a downturn.
Green ray is my entry, I’m looking for a short. But tbh, any one word “positive” said can move things up and fill the gap above.
I’m going to bias short. Let’s see what the week brings.
SP:SPX AMEX:SPY NASDAQ:TSLA NASDAQ:NVDA

Ethereum Surges Past Resistance as Trump Halts Tariff Plans..!🚨 **Market Update** 🚨
President Donald Trump has announced a 90-day pause on the full effect of new tariffs for certain countries, and the markets are reacting strongly! 📈 Both the stock and crypto markets are surging as a result.
Right now, Ethereum is testing the $1600 resistance level on the 1-hour timeframe. 💥 Our trading strategy is to let it break the resistance and sustain above it, then look for a solid entry on the pullback.
Stay tuned and trade wisely! 🚀💰

Nifty recovers from lows of the day. But not out of danger yet.Nifty as expected suffered heavy losses due to Trump Tariff Tornado which has engulfed the global markets. The good thing which is the silver lining in the cloud was that it recovered from the lows of the day by a lot. The lowest point of today or perhaps the year 2025 so far was 21743 and we closed the day at 22161. Which is about 418 points. However we are not out of the woods yet. We will hopefully see bottom formation later during this week or the next if this lowest point is already not the bottom. The support levels for Nifty remain at 21743, 21289, 20790 and 20320. Resistance for Nifty will be at 22266, 22711, 23083 and 23384. Above 23384 closing Nifty will be back to the bulls territory and we can hope for a recovery towards 24K first and then 25K.
As of now the ball is still in Trump's court as the world sizzles with his Whims and fancies. China is planning a stimulus package for its industry and High level cabinet meeting is going on in India as I write this to counter the effects of Trump Tariff and swift recovery of our economy in addition to minimising the effect of damage.
The best strategy is to wait out the Trump Storm reassess the situation once bottom is formed. Those who have liquidity this is a good oppertunity to go long after bottom fishing.
Disclaimer: The above information is provided for educational purpose, analysis and paper trading only. Please don't treat this as a buy or sell recommendation for the stock or index. The Techno-Funda analysis is based on data that is more than 3 months old. Supports and Resistances are determined by historic past peaks and Valley in the chart. Many other indicators and patterns like EMA, RSI, MACD, Volumes, Fibonacci, parallel channel etc. use historic data which is 3 months or older cyclical points. There is no guarantee they will work in future as markets are highly volatile and swings in prices are also due to macro and micro factors based on actions taken by the company as well as region and global events. Equity investment is subject to risks. I or my clients or family members might have positions in the stocks that we mention in our educational posts. We will not be responsible for any Profit or loss that may occur due to any financial decision taken based on any data provided in this message. Do consult your investment advisor before taking any financial decisions. Stop losses should be an important part of any investment in equity.

Trump Tariffs send global Markets into free fall. Trump Tariff announcements has sent the global markets into free fall. The reaction has sent global markets into knee jerk reaction. Global trade will axis will realign because of these actions of US. As per the analysis of many experts the disadvantages to India are limited. There are opportunities galore in sectors like Pharma and Textile etc. The support levels for Nifty currently are at 22338, 21983, 21289, 20095 and finally 19864. The resistances for Nifty are 23037, 23266 and 23894. Long term Resistance for Nifty remain at 24831 and 25K levels.
Short term outlook for Nifty is weak. In the medium term Nifty can remain range bound and Long term outlook for Nifty still remains strong. Investors with Long term outlook can search for Bottom Fishing opportunities in Blue chip stocks which are available at good prices.
Focus should be on India centric themes where products and companies are less dependent on exports specially to US. Having said that it can be a blessing in disguise for sectors like Pharma and Textile. If Indian leadership can turn this obstacle into oppertunity by taking the right steps it can be a curse in disguise. Investors can also look at collecting some ETFs international as well as local as a long term investment.
In cricket matches sometimes losing a toss can be a blessing in disguise this is something like that.
Disclaimer: The above information is provided for educational purpose, analysis and paper trading only. Please don't treat this as a buy or sell recommendation for the stock or index. The Techno-Funda analysis is based on data that is more than 3 months old. Supports and Resistances are determined by historic past peaks and Valley in the chart. Many other indicators and patterns like EMA, RSI, MACD, Volumes, Fibonacci, parallel channel etc. use historic data which is 3 months or older cyclical points. There is no guarantee they will work in future as markets are highly volatile and swings in prices are also due to macro and micro factors based on actions taken by the company as well as region and global events. Equity investment is subject to risks. I or my clients or family members might have positions in the stocks that we mention in our educational posts. We will not be responsible for any Profit or loss that may occur due to any financial decision taken based on any data provided in this message. Do consult your investment advisor before taking any financial decisions. Stop losses should be an important part of any investment in equity.
