2050 : SAVOLA (The trade is ready)SAVOLA Group is a major F&B producer and distributer in Saudi Arabia and Middle East. The stock has been trading in down trend over the last year while most other companies were making new all-time high. Why?
The reason being there is a major macro trend taking place since 2006. Lower lows and Higher highs forming a triangle that is generally a sign of major pull after it breaks to the upside.
For the time being, the chart seems to have bottomed at around 30 SAR and now is moving on the leg up to make a new high at the upper edge of the triangle lines.
We have entered the trade at 32 SAR with our target at (+23%). Keep watching this will be the trade of 2022 and 2023.
Best,
FBH
TASI

2380 : Petro Rabigh (+50% by Dec 2022)Petro Rabigh chart had performed very well for us last year from sub 14 to 27 SAR and now is about to perform again!
The reason for this projection is the underline macro trend that is now confirmed and is about to break to the upside with potential gains of +50%.
The method we use is HVF, long tested and proved accurate with combined with volume analysis.
What we see in this chart is an imminent move in the stock to +23% from current levels by July 2022. And +50% by year end. Other targets are marked on the chart.

2270 : SADAFCO (+50% by December 2022)Macro analysis for Saudi Diary and Food Company,
The chart indicates a bull macro trend since 2008 from H&S bottom to the top in 2017 that sent it to the bottom of the trend channel in 2018. Since then the stock has been in a pull pattern.
Since recent weeks the chart has been in accumulation pattern around 170-177 SAR. It now broke above and is going for targets at 210 SAR (+23%) with potential even to achieve 50% at the top of trend channel by year end.


ARAMCO technical analysis, update, 2222We expected for ARAMCO to reach 45$ level within a year, so it took 9 months.
The share rose by 27% in 9 months with 0 reversal from entry point.
That was the most accurate technical analysis we've ever made.

AL RAJHI BANK: And the show goes on The 15th of February , TADAWUL:1120 has broken above a key level (153.2) with huge bullish momentum ,
which triggered a sudden spike to around the 170 .
After the quick spike ,price pulled back down to the 150.5-155.5 area which is an ideal buy zone with strong demand . Actually price is very likely to go up to the 179-180.5 area ,with the possibility to break above the 179-180.5 area and continue to the 195-200 area .
For position management it is recommended to apply Jesse Livermore's method to this trade :
Open 2 positions with the same Stop set in the red area .The first position's target is set at the 1st target area .The second position's target is set at the 2nd target area .When the first position reaches the 1st target area and closes , it is recommended to move the stop loss to the entry price for the second position targeting the 2nd target area .
Fervently brought to you by Manhattan Stocks.
All Requests , Suggestions and Remarks are Welcomed .

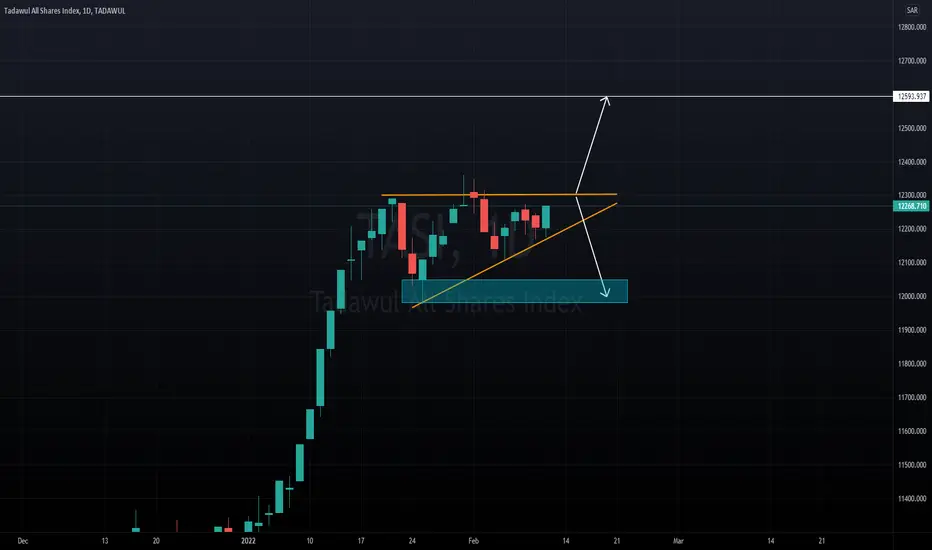
Bullish PatternMarket is again turning bullish if this wedge breaks to the upside we can expect it to touch 12600 levels at the same time lets prepare negative side as well if it breaks to the downside we can see a retest of 12000 levels too. Over all looking very bullish !
Hit like & follow guys ;)


Correction TimeThere is no doubt that TASI is in a strong bull trend but we also know that market cannot just keep moving in 1 direction there is always a correction phase. Market as of now is over heated and need some healthy correction I think it will respect the support which coincides with the long term trendline. Overall surely TASI is a bullish market!!
Hit like & follow guys ;)

Aljazirah bank target These are the targets of 1020 aljazirah bank chart.
Be attention to not close below the black horizontal line.
Lets see what will happen

TASI -Saudi stock market DIRECTION SOUTHI believe that tasi has finished or is about to finish a multiyear pattern therefore I expect tasi to sharply move downwards

TASI - Tadawul broke his Weekly KidjunTadawul broke his Weekly Kidjun, are we going to visit the Monthly Kidjun ?!
I think buyers need a few months vacation ;)


THE SAUDI NATIONAL BANK (1180)Looking pretty bullish, the weekly close is tempting.. the targets may seem imaginary, but it's only a matter of time.


Is the Tadawul All Share Index (TASI) overdue for a correction?The Tadawul All Share Index (TASI), which tracks the performance of all stock listed on The Tadawul, has recorded a 30.34% increase since the beginning of 2021.
However, the TASI is sitting at a peak level, which appears to be a repetition of the previous boom and bust cycle. The TASI was in a comparable position in late 2014 and late 2007, before wiping out more than half its value over the proceeding months. If past performance is any indicator, the TASI might be overdue a correction.
About the Tawadul
The Tadawul (TADAWUL) is the only licensed Stock Exchange in Saudi Arabia, the largest Stock Exchange in the Middle East, and the twelfth largest in the world by market capitalisation. According to Statista, The aggregate market cap of the 200 companies listed on The Tadawul is approximately US $2.6 trillion (July of 2021).
Contributing to an outsized portion of The Tadawul’s market capitalisation is Saudi Aramco (TADAWUL: 2222), the fourth-largest company in the world (market cap as of Sept 2021, US ~$1.9 trillion). Perhaps unsurprisingly, a vast swath of the listings on The Tadawul are companies concerned with crude oil and chemical products. Saudi Basic Industries (TADAWUL: 2010) is the Exchange’s second-largest listing, with a comparatively modest market capitalisation of US $99 billion.
Financial institutions and banking groups help to diversify the offerings of the Stock Exchange. The Exchange’s former largest listings, Al Rajhi Banking & Investment (TADAWUL: 1120) and Saudi National Bank (TADAWUL: 1180 ), are currently the third and fourth largest with market caps between US $70 and US $80 billion.

Safe trend indicator experience series - Tasi 2330 3MHello guys
I offer you the experience of the safe trend indicator in the global financial markets.
Main Market: Tadawul ( TASI ).
Country: Kingdom of Saudi Arabia.
Stock: 2330
Time interval (trading candle): 3 months. Long term investing.
Safe Trend Indicator.
Yes, By Muteb - There is a trace.

Safe trend indicator experience series - Tasi 2330 3MHello guys
I offer you the experience of the safe trend indicator in the global financial markets.
Main Market: Tadawul (TASI).
Country: Kingdom of Saudi Arabia.
Stock: 2330
Time interval (trading candle): 3 months. Long term investing.
Safe Trend Indicator.
Yes, By Muteb - There is a trace.


Safe trend indicator - Long investmentMy trades in the Saudi stock market using the safe trend indicator.
Long term investment and great success.
Close of trading session on Tuesday 7 September 2021.

Safe trend indicator - By MutebHi
my name is Mutab.
42 years old.
Interested in following the stock market.
Innovative of ( safe trend indicator ).
a great indicator for a long-term investment. Keeping up with the rising waves and avoiding the descending waves, to achieve amazing long-term investment goals.
-------------------------------------------------------------------
What distinguishes the safe trend indicator?
It is one of the safest indicators in dealing with the financial markets.
* Direct indicator, no need to wait for the candle to close to confirm the decision.
* It keeps up with the ascending waves and avoids the descending waves.
* Very effective in investing in the long term.
* Amazing long-term results.
* High stability while reading the candle, as it does not give an opposite reading except in rare cases.
* Few errors compared to successes, which means that the ratio of losses to profits is very small, which enables the investor to achieve high profits in long-term investment.
-------------------------------------------------------------------
I am using it now in my trading in the Saudi stock market and it is yielding amazing results in my long term investment (quarterly and half yearly).
It gives me great pleasure to share with you my success story, as I publish a weekly report and I record and display the week's trades to prove the feasibility and credibility of the indicator.
I wish you success.

